
Before we go off to dive into the deep waters of the Wi-Fi sea, it is time to invite our good seafaring friend, Wireshark, to the scene. Just as we had used Wireshark to capture traffic on our wired Ethernet networks in the previous chapters, we will now use it to capture the Wi-Fi network traffic.
Sniffing Wi-Fi traffic can be quite challenging. Wireless networks work on multiple channels and use different frequencies, even in the same location. The challenge is to select a specific static channel. The next challenge is identifying the channel number that we have decided to capture.
Another important factor to consider is the distance between the point of capture and the transmitting point. The greater the range, the less reliable the collection. Interference and collisions can also affect the quality of capture. As discussed earlier, certain network frequencies are subject to interference by devices such as cordless phones and microwave ovens.
Before we begin sniffing, we need to manually set up our network interface in the monitor mode. Most drivers for Wi-Fi NIC's under Linux use the Linux wireless interface, which provides us the ability to configure the wireless card in the monitor mode. Unfortunately, Windows does not offer us that capability, therefore, we need to use specialized software such as AirPcap before we begin our capture. Of course, the best solution is to use a bootable distribution of Kali Linux. This has a plethora of open source tools that are very useful for all sorts of activities related to forensics and network security.
As in the case of wired (Ethernet) networks, we will use Wireshark to capture network traffic.
The following are the three different types of traffic that we may wish to capture:
- The traffic to and from our own computer and processes. To do this, we need to set our network interface (wireless card) in the loopback mode.
- The traffic between our sniffing computer and other computers on the network. Assuming that we are only interested in regular network data, rather than management and control packets; signal strengths; and data rates, then running a capture on our network interface without any special set up will be sufficient.
- The traffic that is not from or to our investigation machine. By this, we mean that our interest lies in capturing traffic between other machines on the network (not necessarily our own). We could also be interested in radio layer information, such as signal strengths and data rates, or 802.11 management, or control packets. To do this kind of capture, we would need to set our computer network interface in the monitor mode.
Before we take this exercise further, we need to understand the type of packets that exist. The 802.11 traffic has data packets (these are normal packets), management packets, and low-level control packets. Packets can be unicast, multicast, or broadcast:
- Unicast packets: Any network packet that is sent to a single destination is unicast. All IPv4 addresses are unicast by default, except the ones that are multicast or broadcast.
- Multicast packet: Any network packet sent to multiple destinations is multicast.
- Broadcast packet: Any packet sent to all destinations on a network segment is a broadcast packet.
To capture any traffic other than the unicast traffic, the wireless network interface will need to be set to the monitor mode. This can be done in most Linux and Mac implementations. Lets take a look at the following steps to do this:
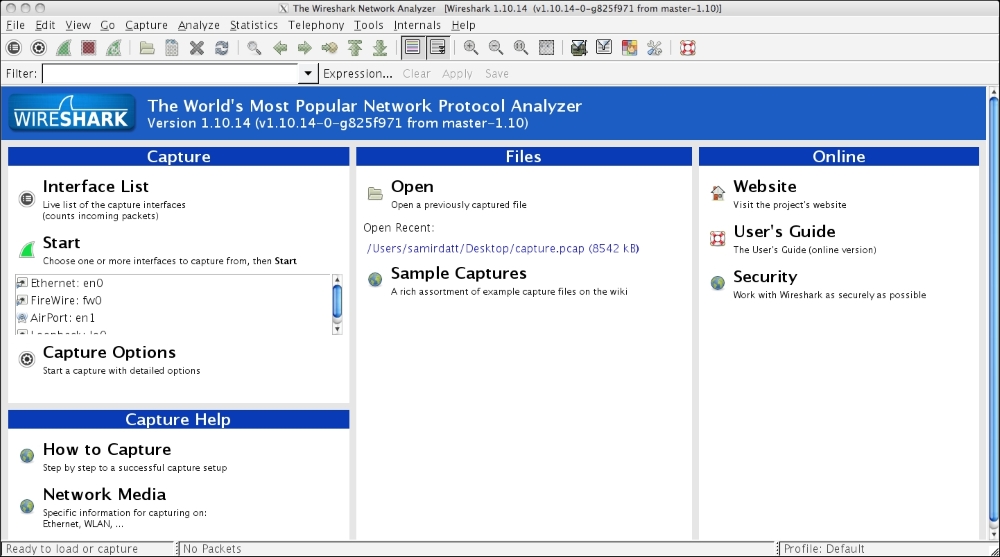
- The first step is to start Wireshark, as shown in the following image:

- Next, we need to select the network interface that will be used for capturing the traffic, as follows:

- In our case, we will select the en1 Wi-Fi interface. Once this is done, we can start capturing the traffic like we did with the Ethernet networks. The following screenshot shows a packet capture in progress:

- The moment we gather sufficient frames for the purpose of analysis, we can stop the capture and proceed with saving the capture to a
.pcapfile. To stop the capture, we will click on the red button shown in the following image:
- The next step for us is to save the captured frames or packets in a
.pcapfile. This is done as per the following screenshot:
This is quite important as the saved .pcap capture file can be analyzed in greater detail at a later time.
Now that we have collected the evidence (or sniffed it, as in this case) it is time to mine through the data capture packets in order to make sense of the data that we have collected.
While it is very tempting to dive straight away into viewing the packet headers and contents, that will just end up confusing you as an investigator.
The best way to begin is to start by getting an overview of all the data that has been captured, baseline the environment, identify the focus areas, and narrow the focus using filters.
Let's start by loading our previously saved packet capture file:
- Start Wireshark, as shown in the following image:
- As we can see from the preceding screenshot, it shows us the recent capture we made. Let's click on this to load the data in Wireshark, as shown in the following image:

- The preceding screen capture shows the captured packet file. Once we have the previously captured packet file loaded, we will navigate to Statistics | Protocol Hierarchy. You should get the following screenshot:

- This helps us in understanding, at a glance, the kind of data present in our capture file. As we can see, in our case, most of the packets are TCP (95.05%), out of which 54.7% are SSL. There is a small percentage of malformed packets as well that we may wish to investigate.
This information provides us a baseline from where we initiate our investigation.
- To identify the different players in the captured session, we navigate to Statistics | Conversations. You should get something like the following screenshot:

- In the preceding screenshot of the conversations, the Ethernet tab shows the different pairs of Ethernet devices that are in conversation with each other in the segment of the network that we are monitoring. Again, this is useful information. Further, a closer look shows us which of the Ethernet device pairs on the network is the most active based on the number of packets received and sent.
We can carry out a similar analysis on the IP addresses involved in conversations with each other, as shown in the following screenshot:

- Another really useful feature that is built in Wireshark is the GeoIP feature. This allows Wireshark to resolve the IP addresses to actual cities and countries and even helps in plotting IP addresses on a map.
Geocoded IP address information in database form is available for use in both paid and unpaid versions at https://www.maxmind.com/en/home. When this is correctly installed and configured to work in these versions of Wireshark that are compiled with GeoIP code, it acts as a further enhancement of this already-powerful tool.
To determine whether the version downloaded by you is compatible with the GeoIP database, navigate to Help | About Wireshark.
In the window that pops up, there is a section that talks about the different modules that the downloaded version of Wireshark has been compiled with. If this mentions GeoIP, as shown in the following screenshot, then your version of Wireshark is set to go places:

- Another very important aspect of analysis of packet data is that of filters. Using filters allows us to narrow down on investigation specifics.
As an example, if we wish to look at only the traffic that adheres to the HTTP protocol, we need to type
httpin our filters box. As we type in the box, the color of the box changes from red (unacceptable/meaningless input) to yellow (needs refinement) to green (acceptable). When we hit the apply button, the display will change to show us all the packets that comply with our requirement, as shown in the following screenshot: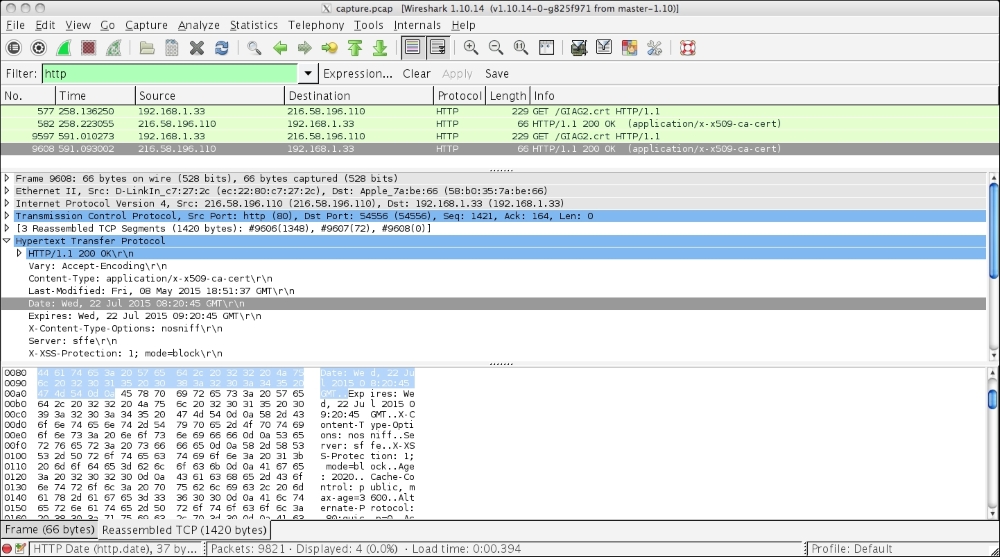
- As we can see, the image only shows us pure TCP packets. If we examine the header of a selected packet in more detail in the middle pane, we can see the date information, from and to IP addresses, as well as the information related to the source and destination ports.
We can further trace the complete TCP stream by right-clicking on the packet to view this in more detail. The following screenshot shows us the options when we right click on a packet:

- In this case, we will select Follow TCP Stream.
The output is as follows:

- Every forensic investigator needs to have sharp observation skills. You would have all noticed that at the bottom left-hand corner of the Wireshark interface window, there is a red dot. This red dot indicates that there is expert information available for the investigator about the data that we sniffed earlier. When we click on this dot, the Expert Info window pops open.
This window, as we can see, carries a plethora of information, including errors such as malformed SSL and TCP packets, warnings, notes, and so on. All of these add to our knowledge about the various activities on our network:
