
Now that we have the logs, it is high time we understood how to collect and analyze them from a network forensic's perspective.
The tool of choice is Splunk. This is a very versatile tool (it also has a free version) that offers users the ability to collect log files from multiple sources, index and normalize the data within, then carry out an in-depth analysis to look for anomalies, prepare reports, and visualize the results. Lets take a look at it:

Splunk offers the facility to import and index data in a multitude of formats. This includes structured data, web services, network devices, Microsoft servers, application services, the cloud, and a host of others. The following are the steps to download and start using Splunk:
- To get started, we need to download Splunk from http://www.splunk.com/, as shown in the following screenshot:

- All we need to get started is to download the relevant binary based on the operating system that we intend to use for the analysis. As we can see in the preceding screenshot, Splunk supports Windows, Linux, Solaris, and Mac OS.
- In our case, we will download the Windows binary so that we can collect the logs directly from the system itself and see whether we can get our hands on some interesting data.
- Once the download is complete, Splunk requires the user to create a username and password. The password so created permits admin access to Spunk via the browser-based logon screen.
The next stage is to add data to Splunk, as shown in the following screenshot:

To do this, complete the following steps:
- We click the first option, Add Data.
- When we do this, we are provided three options as shown in the following screenshot:

The first is the upload option; this is to be selected when we want to analyze the log files that we have brought from the computer under investigation or have locally on our drive or removable media. In this case, the analysis is of the data of events that have occurred in the past and the log files are not changing dynamically. We can use this for the syslog files that are downloaded as a part of the tutorial on the Splunk site.
The second is the monitor option; in this case, we can monitor the ports as well as the files that are changing dynamically on the system. This is quite useful when we want to monitor the log activity in real time.
The third is the forwarding option. This allows multiple instances of Splunk to run on different machines. At one end, Splunk acts as a collector and at the other, it acts as a receiver. This helps in the collection and consolidation of logs over the network.
- In this case, let's start by analyzing our own system's logs dynamically. The first step is to select the source of data. In our case, we will select Local Event Logs, as shown in the following image:

- Once we do that, Splunk looks for all sorts of logs on the local system. Once these are identified (it takes only a few seconds), we are presented with a window showing us the logs that we wish to ingest into Splunk and then index for later analysis, as shown in the following screenshot:

- We can select the logs one by one or add all at the same time. Once this is done, we move onto the Input Settings stage, as shown in the following image:

- This stage is optional. Here, additional input parameters for the data are defined. In this case, we just accept the defaults and proceed to the Review stage, as shown in the following screenshot:

- We review our selection and confirm that everything is as it should be. Once this is complete, our data import to Splunk is done. In the background, Splunk moves to the indexing mode, where it builds full in-depth indexes from the logs for high-speed retrieval, as shown in the following screenshot:

This is the stage where our long wait is over and we can indulge our 007 instinct. We can now begin to search for all sorts of suspicious activity. The Splunk Search page is shown in the following screenshot:
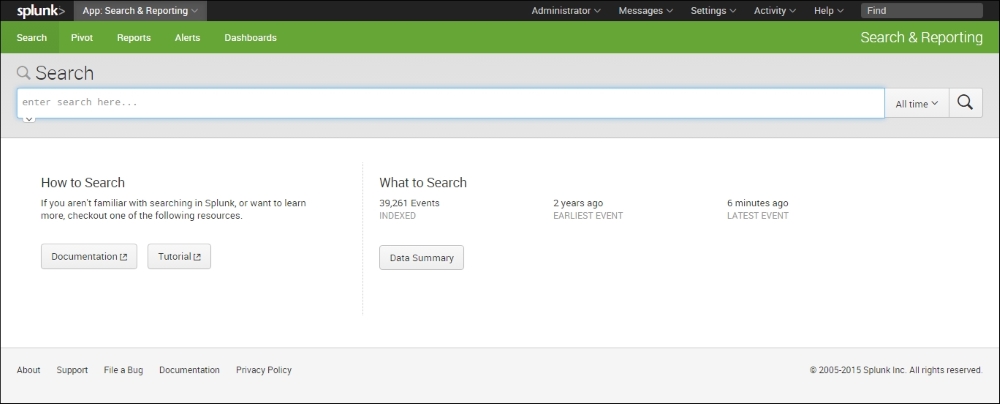
Just under it, Splunk lists the number of events indexed as well as the earlier and later event.
A quick click on Data Summary shows us the following result:

There are three tabs. The first Hosts tab shows that the data indexed by Splunk relates to a single host. The next two tabs show us that the data relates to four different sources and source types. Let's select the single host and see if there are any security events that merit our attention.
The good part about Splunk is that it has a Google-type search interface. We simply type in the text that we want it to look for and it shows us the results. In this case, let's look for the log entries that have the word logon as well a word beginning with pass. The wild card * denotes that the output that should include everything that starts with pass including passes and password (which is what we are looking for). It is shown in the following screenshot:
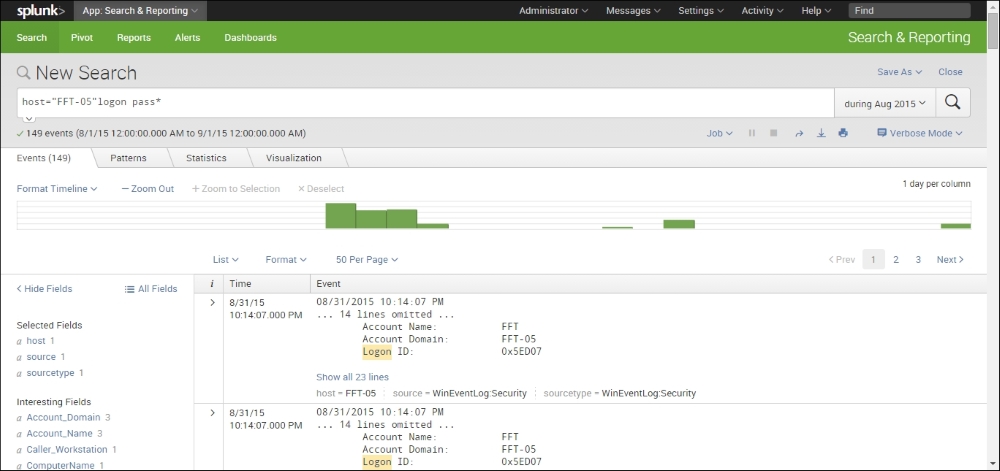
A quick look at the interface shows us that there are 149 events that meet our criterion during the month of August, 2015. This is something we would definitely like to look at in more detail.
Let's expand these entries by clicking on the > sign on the left-hand side of the entry, as shown in the following:

Suddenly, things have become a lot clear. If we look closely, we see that on August 31, 2015, at about 22:14 hours, an attempt was made to log on to the FFT-05 host with a blank password. This is an example of the kind of interesting things that we are looking for.
While this reflects a single event, wouldn't it be great if we could see all the similar events visually. Luckily for us, this is what Splunk does really well. This aspect is called visualization and allows Splunk to aggregate the data and show it to us in an easy-to-understand graphical format. The following image illustrates this idea:

As we can see from the preceding image, our first attack began on August 11 and the latest was discovered on August 31.
This kind of information is quite valuable as it gives us an immediate insight into the kind of attack being directed at our information resources and gives us an excellent starting point to begin our investigation.
With a little bit of practice and the use of the excellent online tutorials available with Splunk, it is quite easy to gain the necessary expertise to begin your journey into log analysis and push your understanding of network forensics to another notch.