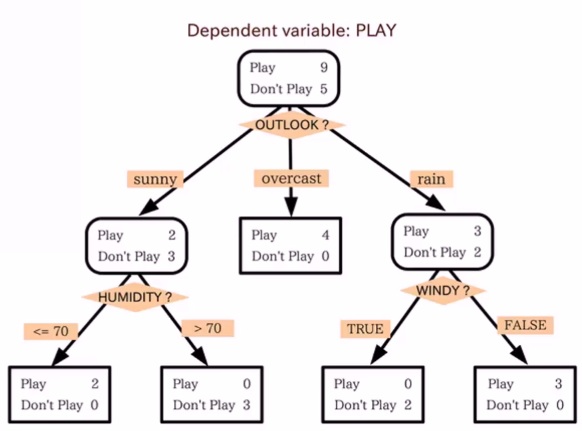
Believe it or not, given a set of training data, you can actually get Python to generate a flowchart for you to make a decision. So if you have something you're trying to predict on some classification, you can use a decision tree to actually look at multiple attributes that you can decide upon at each level in the flowchart. You can print out an actual flowchart for you to use to make a decision from, based on actual machine learning. How cool is that? Let's see how it works.
I personally find decision trees are one of the most interesting applications of machine learning. A decision tree basically gives you a flowchart of how to make some decision.You have some dependent variable, like whether or not I should go play outside today or not based on the weather. When you have a decision like that that depends on multiple attributes or multiple variables, a decision tree could be a good choice.
There are many different aspects of the weather that might influence my decision of whether I should go outside and play. It might have to do with the humidity, the temperature, whether it's sunny or not, for example. A decision tree can look at all these different attributes of the weather, or anything else, and decide what are the thresholds? What are the decisions I need to make on each one of those attributes before I arrive at a decision of whether or not I should go play outside? That's all a decision tree is. So it's a form of supervised learning.
The way it would work in this example would be as follows. I would have some sort of dataset of historical weather, and data about whether or not people went outside to play on a particular day. I would feed the model this data of whether it was sunny or not on each day, what the humidity was, and if it was windy or not; and whether or not it was a good day to go play outside. Given that training data, a decision tree algorithm can then arrive at a tree that gives us a flowchart that we can print out. It looks just like the following flow chart. You can just walk through and figure out whether or not it's a good day to play outside based on the current attributes. You can use that to predict the decision for a new set of values:

How cool is that? We have an algorithm that will make a flowchart for you automatically just based on observational data. What's even cooler is how simple it all works once you learn how it works.
