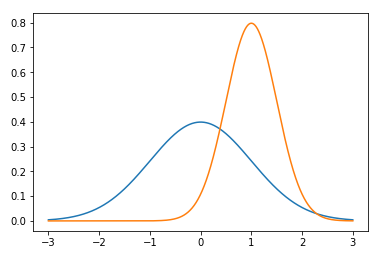
Let's say I want to plot more than one thing at a time. You can actually call plot multiple times before calling show to actually add more than one function to your graph. Let's look at the following code:
plt.plot(x, norm.pdf(x))
plt.plot(x, norm.pdf(x, 1.0, 0.5))
plt.show()
In this example, I'm calling my original function of just a normal distribution, but I'm going to render another normal distribution here as well, with a mean around 1.0 and a standard deviation of 0.5. Then, I'm going to show those two together so you can see how they compare to each other.

You can see that by default, matplotlib chooses different colors for each graph automatically for you, which is very nice and handy of it.
