What if I want to play games with the line types and colors? You can do that too.
axes = plt.axes()
axes.set_xlim([-5, 5])
axes.set_ylim([0, 1.0])
axes.set_xticks([-5, -4, -3, -2, -1, 0, 1, 2, 3, 4, 5])
axes.set_yticks([0, 0.1, 0.2, 0.3, 0.4, 0.5, 0.6, 0.7, 0.8, 0.9, 1.0])
axes.grid()
plt.plot(x, norm.pdf(x), 'b-')
plt.plot(x, norm.pdf(x, 1.0, 0.5), 'r:')
plt.show()
So you see in the preceding code, there's actually an extra parameter on the plot() functions at the end where I can pass a little string that describes the style of a line. In this first example, what b- indicates is I want a blue, solid line. The b stands for blue, and the dash means a solid line. For my second plot() function, I'm going to plot it in red, that's what the r means, and the colon means I'm going to plot it with a dotted line.

If I run that, you can see in the above graph what it does, and you can change different types of line styles.
In addition, you can do a double dash (--).
axes = plt.axes()
axes.set_xlim([-5, 5])
axes.set_ylim([0, 1.0])
axes.set_xticks([-5, -4, -3, -2, -1, 0, 1, 2, 3, 4, 5])
axes.set_yticks([0, 0.1, 0.2, 0.3, 0.4, 0.5, 0.6, 0.7, 0.8, 0.9, 1.0])
axes.grid()
plt.plot(x, norm.pdf(x), 'b-')
plt.plot(x, norm.pdf(x, 1.0, 0.5), 'r--')
plt.show()
The preceding code gives you dashed red line as a line style as shown in the following graph image:

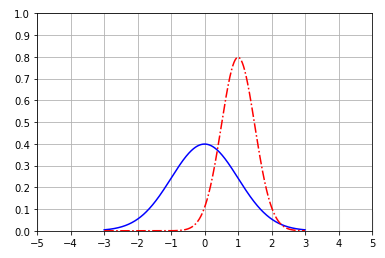
I can also do a dash dot combination (-.).
axes = plt.axes()
axes.set_xlim([-5, 5])
axes.set_ylim([0, 1.0])
axes.set_xticks([-5, -4, -3, -2, -1, 0, 1, 2, 3, 4, 5])
axes.set_yticks([0, 0.1, 0.2, 0.3, 0.4, 0.5, 0.6, 0.7, 0.8, 0.9, 1.0])
axes.grid()
plt.plot(x, norm.pdf(x), 'b-')
plt.plot(x, norm.pdf(x, 1.0, 0.5), 'r-.')
plt.show()
You get an output that looks like the following graph image:

So, those are the different choices there. I could even make it green with vertical slashes (g:).
axes = plt.axes()
axes.set_xlim([-5, 5])
axes.set_ylim([0, 1.0])
axes.set_xticks([-5, -4, -3, -2, -1, 0, 1, 2, 3, 4, 5])
axes.set_yticks([0, 0.1, 0.2, 0.3, 0.4, 0.5, 0.6, 0.7, 0.8, 0.9, 1.0])
axes.grid()
plt.plot(x, norm.pdf(x), 'b-')
plt.plot(x, norm.pdf(x, 1.0, 0.5), ' g:')
plt.show()
I'll get the following output:

Have some fun with that if you want, experiment with different values, and you can get different line styles.
