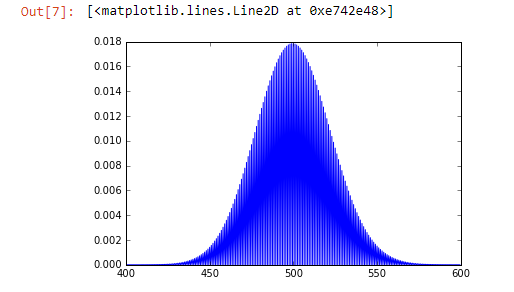
Lastly, the other distribution function you might hear about is a Poisson probability mass function, and this has a very specific application. It looks a lot like a normal distribution, but it's a little bit different.
The idea here is, if you have some information about the average number of things that happen in a given time period, this probability mass function can give you a way to predict the odds of getting another value instead, on a given future day.
As an example, let's say I have a website, and on average I get 500 visitors per day. I can use the Poisson probability mass function to estimate the probability of seeing some other value on a specific day. For example, with my average of 500 visitors per day, what's the odds of seeing 550 visitors on a given day? That's what a Poisson probability mass function can give you take a look at the following code:
from scipy.stats import poisson
import matplotlib.pyplot as plt

mu = 500
x = np.arange(400, 600, 0.5)
plt.plot(x, poisson.pmf(x, mu))
In this code example, I'm saying my average is 500 mu. I'm going to set up some x values to look at between 400 and 600 with a spacing of 0.5. I'm going to plot that using the poisson.pmf function. I can use that graph to look up the odds of getting any specific value that's not 500, assuming a normal distribution:

The odds of seeing 550 visitors on a given day, it turns out, comes out to about 0.002 or 0.2% probability. Very interesting.
Alright, so those are some common data distributions you might run into in the real world.
So that's probability density functions, and probability mass functions. Basically, a way to visualize and measure the actual chance of a given range of values occurring in a dataset. Very important information and a very important thing to understand. We're going to keep using that concept over and over again. Alright, let's move on.
