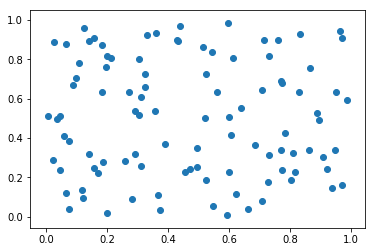
Another basic plot type is scatter plot, a plot of dots. You can draw it by calling plt.scatter(x,y). The following example shows a scatter plot of random dots:
import numpy as np
import matplotlib.pyplot as plt

# Set the random seed for NumPy function to keep the results reproducible
np.random.seed(42)

# Generate a 2 by 100 NumPy Array of random decimals between 0 and 1
r = np.random.rand(2,100)

# Plot the x and y coordinates of the random dots on a scatter plot
plt.scatter(r[0],r[1])

# Show the plot
plt.show()
The following plot is the result of the preceding code:

