The scatter plot is one of the most common plots in the scientific and business worlds. It is particularly useful for displaying the relationship between two variables. While we can simply use matplotlib.pyplot.scatter to draw a scatterplot (see Chapter 2, Getting Started with Matplotlib, and Chapter 4, Advanced Matplotlib, for more details), we can also use Seaborn to build similar plots with more advanced features.
The two functions, seaborn.regplot() and seaborn.lmplot(), display a linear relationship in the form of a scatter plot, a regression line, and the 95% confidence interval around the regression line. The main difference between the two functions is that lmplot() combines regplot() with FacetGrid, such that we can create color-coded or faceted scatter plots to show the interaction between three or more pairs of variables.
The simplest form of seaborn.regplot() supports NumPy arrays, pandas Series, or pandas DataFrames as input. The regression line and the confidence interval can be removed by specifying fit_reg=False.
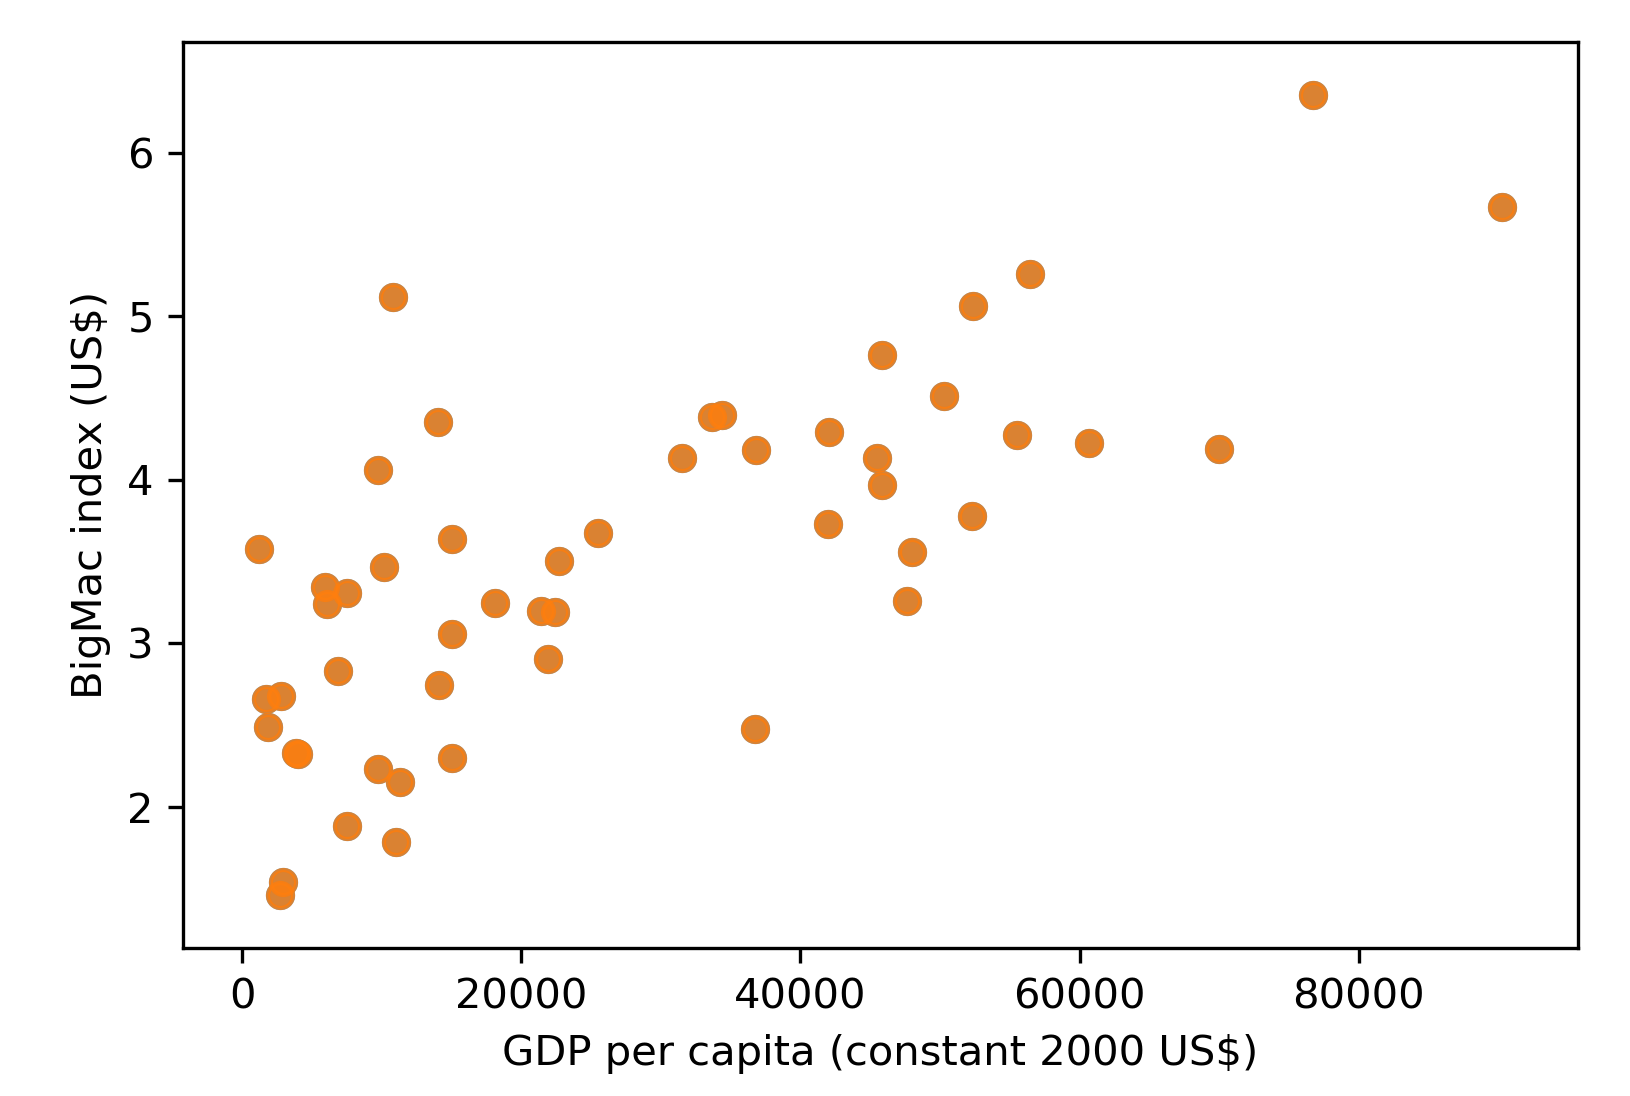
We are going to investigate the hypothesis that Big Macs are cheaper in countries with lower GDP, and vice versa. To that end, we will try to find out whether there is any correlation between the Big Mac index and GDP per capita:
import seaborn as sns
import matplotlib.pyplot as plt

# seaborn.regplot() returns a matplotlib.Axes object
ax = sns.regplot(x="Value", y="dollar_price", data=merged_df, fit_reg=False)
# We can modify the axes labels just like other ordinary
# Matplotlib objects
ax.set_xlabel("GDP per capita (constant 2000 US$)")
ax.set_ylabel("BigMac index (US$)")
plt.show()
The code will greet you with a good old scatter plot:

So far so good! It looks like the Big Mac index is positively correlated with GDP per capita. Let's turn the regression line back on and label a few countries that show extreme Big Mac index values (that is, ≥ 5 or ≤ 2). Meanwhile, the default plotting style is a bit plain; we can spice up the graph by running sns.set(style="whitegrid"). There are four other styles to choose from, namely darkgrid, dark, white, and ticks:
sns.set(style="whitegrid")
ax = sns.regplot(x="Value", y="dollar_price", data=merged_df)
ax.set_xlabel("GDP per capita (constant 2000 US$)")
ax.set_ylabel("BigMac index (US$)")
# Label the country codes which demonstrate extreme BigMac index
for row in merged_df.itertuples():
    if row.dollar_price >= 5 or row.dollar_price <= 2:
     ax.text(row.Value,row.dollar_price+0.1,row.country)
plt.show()
Here is the labeled plot:

We can see that many countries fall within the confidence interval of the regression line. Given the GDP per capita level for each country, the linear regression model predicts the corresponding Big Mac index. The currency value shows signs of undervaluation or overvaluation if the actual index deviates from the regression model.
By labeling the countries that show extremely high or low values, we can clearly see that the average price of a Big Mac in Brazil and Switzerland were overvalued, while it is undervalued in South Africa, Malaysia, Ukraine, and Egypt.
Since Seaborn is not a package for statistical analysis, we need to use other packages, such as scipy.stats or statsmodels, to obtain the parameters of a regression model. In the next example, we are going to get the slope and intercept parameters from the regression model, and apply different colors for points that are above or below the regression line:
from scipy.stats import linregress

ax = sns.regplot(x="Value", y="dollar_price", data=merged_df)
ax.set_xlabel("GDP per capita (constant 2000 US$)")
ax.set_ylabel("BigMac index (US$)")

# Calculate linear regression parameters
slope, intercept, r_value, p_value, std_err = linregress(merged_df.Value, merged_df.dollar_price)

colors = []
for row in merged_df.itertuples():
    if row.dollar_price > row.Value * slope + intercept:
        # Color markers as darkred if they are above the regression line
        color = "darkred"
    else:
        # Color markers as darkblue if they are below the regression line
        color = "darkblue"

    # Label the country code for those who demonstrate extreme BigMac index
    if row.dollar_price >= 5 or row.dollar_price <= 2:
        ax.text(row.Value,row.dollar_price+0.1,row.country)

    # Highlight the marker that corresponds to China
    if row.country == "CHN":
        t = ax.text(row.Value,row.dollar_price+0.1,row.country)
        color = "yellow"

    colors.append(color)

# Overlay another scatter plot on top with marker-specific color
ax.scatter(merged_df.Value, merged_df.dollar_price, c=colors)

# Label the r squared value and p value of the linear regression model.
# transform=ax.transAxes indicates that the coordinates are given relative to the axes bounding box,
# with 0,0 being the lower left of the axes and 1,1 the upper right.
ax.text(0.1, 0.9, "$r^2={0:.3f}, p={1:.3e}$".format(r_value ** 2, p_value), transform=ax.transAxes)

plt.show()
This screenshot shows the color-labeled plot:

Contrary to popular belief, it looks as if China's currency was not significantly undervalued in 2016, as the value lies within the 95% confidence interval of the regression line.
We can also combine histograms of x and y values with a scatter plot using seaborn.jointplot:
# seaborn.jointplot() returns a seaborn.JointGrid object
g = sns.jointplot(x="Value", y="dollar_price", data=merged_df)

# Provide custom axes labels through accessing the underlying axes object
# We can get matplotlib.axes.Axes of the scatter plot by calling g.ax_joint
g.ax_joint.set_xlabel("GDP per capita (constant 2000 US$)")
g.ax_joint.set_ylabel("BigMac index (US$)")

# Set the title and adjust the margin
g.fig.suptitle("Relationship between GDP per capita and BigMac Index")
g.fig.subplots_adjust(top=0.9)
plt.show()
The jointplot is as follows:

