GeoPandas is a geographical plotting package integrated with Matplotlib. It has comprehensive functionalities to read common GIS file formats.
To use GeoPandas, we will import the library as follows:
import geopandas as gpd
import matplotlib.pyplot as plt
In the following example, we will explore the climate change data prepared by the World Bank Group.
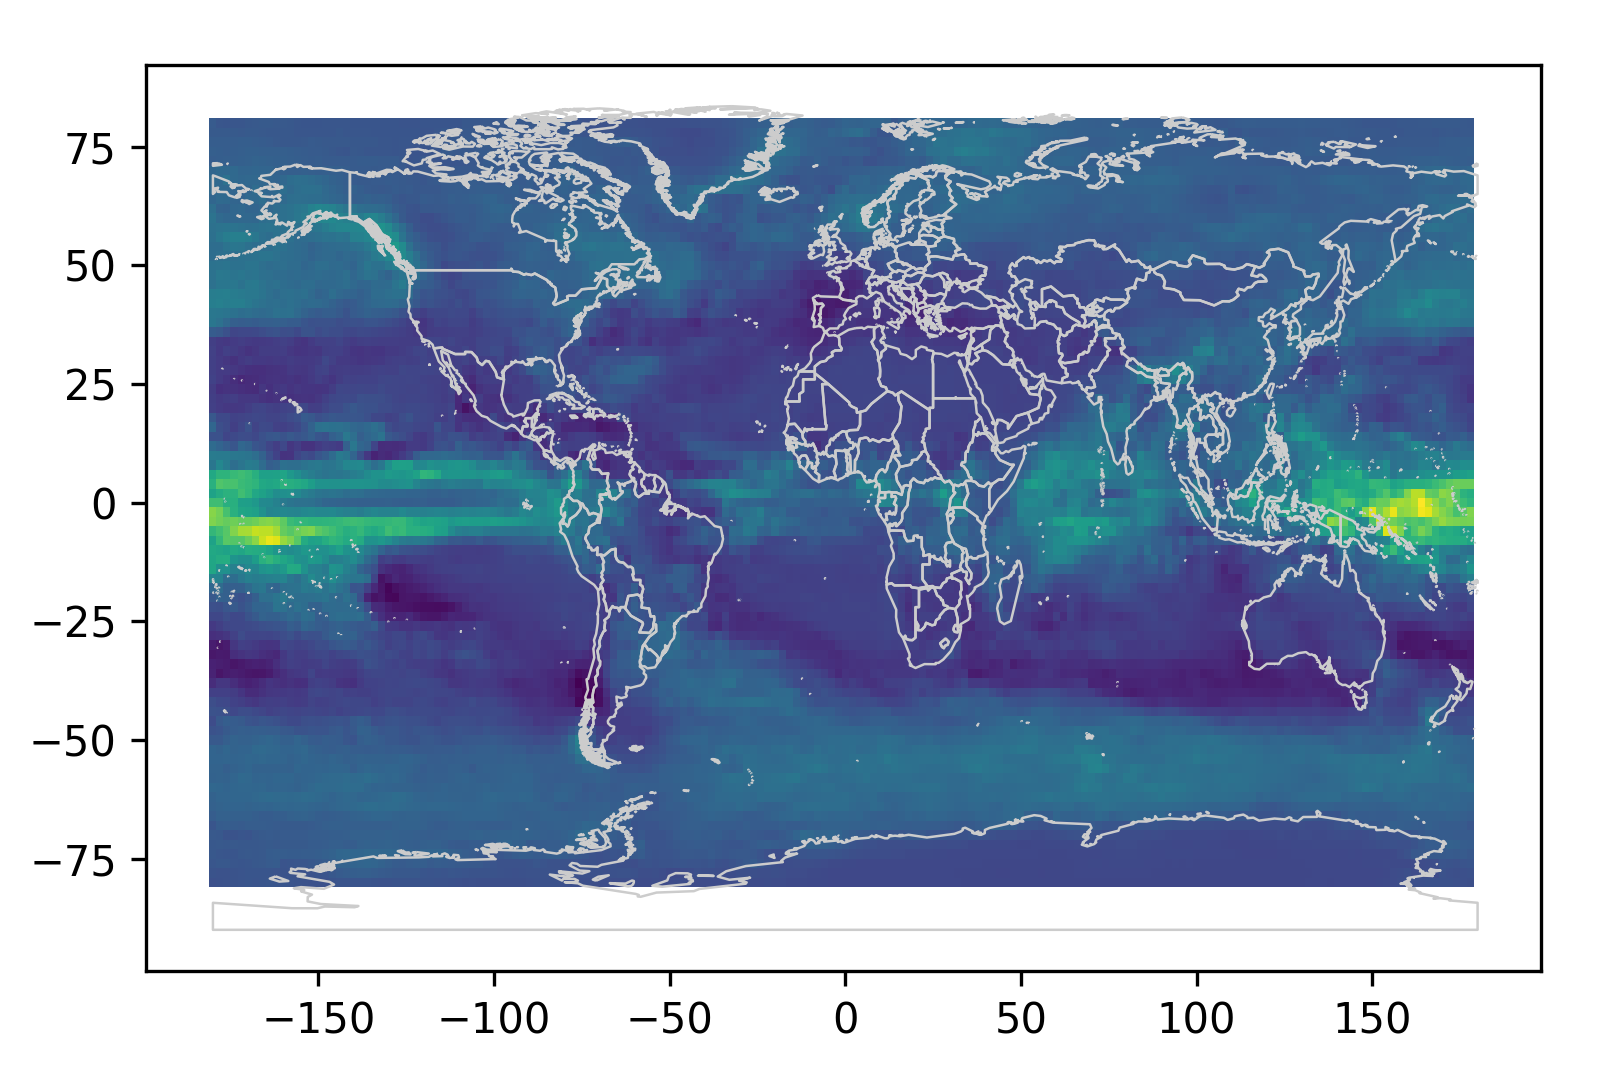
We have selected the projection of precipitation in 2080-2099 based on scenario B1: a convergent world with global population peaking in mid-century and then declining. The storyline describes economies becoming more service- and information-oriented, with the introduction of clean and resource-efficient technologies but without additional climate initiatives.
As input, we have downloaded the shapefile (.shp), which is one of the standard formats used in geographical data analysis:
# Downloaded from the Climate Change Knowledge portal by the World Bank Group
# Source URL: http://climate4development.worldbank.org/open/#precipitation
world_pr = gpd.read_file('futureB.ppt.totals.median.shp')
world_pr.head()
We can look at the first few rows of the GeoPandas DataFrame. Note that the shape data is stored in the geometry column:

Next, we will add borders to the world map to better identify the locations:
# Downloaded from thematicmapping.org
# Source URL http://thematicmapping.org/downloads/world_borders.php
world_borders = gpd.read_file('TM_WORLD_BORDERS_SIMPL-0.3.shp')
world_borders.head()
Here we inspect the GeoPandas DataFrame. The shape information is also stored in the geometry as expected:

The geometry data will be plotted as filled polygons. To draw the edges only, we will generate the geometry of borders by GeoSeries.boundary:
# Initialize an figure and an axes as the canvas
fig,ax = plt.subplots()

# Plot the annual precipitation data in ax
world_pr.plot(ax=ax,column='ANNUAL')

# Draw the simple worldmap borders
world_borders.boundary.plot(ax=ax,color='#cccccc',linewidth=0.6)

plt.show()
Now, we have obtained this result:

The website also provides data for another scenario, A2, which describes a very heterogeneous world, with local identities preserved. How will the picture look? Will it look similar or strikingly different? Let's download the file to find out!
Again, GeoPandas provides many APIs for more advanced usage. Readers can refer to http://geopandas.org/ for the full documentation or further details.
