
Chapter 9: Incident Management
In Chapter 7, Creating Analytic Rules, you learned that the rules in analytics create incidents. These incidents can represent potential issues with your environment and need to be looked at to determine whether they are indeed an issue. Are they false positives, irrelevant to your environment, or actual issues? The way to determine this is through incident management.
There are no hard-and-fast rules for incident management other than to look at the incidents and determine whether they are actual issues. There are various ways to do this and this chapter will look at the options Azure Sentinel provides to perform these investigations, including a graphical representation of the incident, viewing the full details of the incident, and running other queries to obtain more information.
In this chapter, we will cover the following topics:
- Using the Azure Sentinel Incidents page
- Exploring the full details page
- Investigating an incident
Using the Azure Sentinel Incidents page
To look at the Azure Sentinel Incidents page, click on the Incidents link in the left-hand navigation panel. This will take you to the Incidents page, which will look similar to what is shown in the following screenshot. The actual numbers and incidents listed may be different, of course:
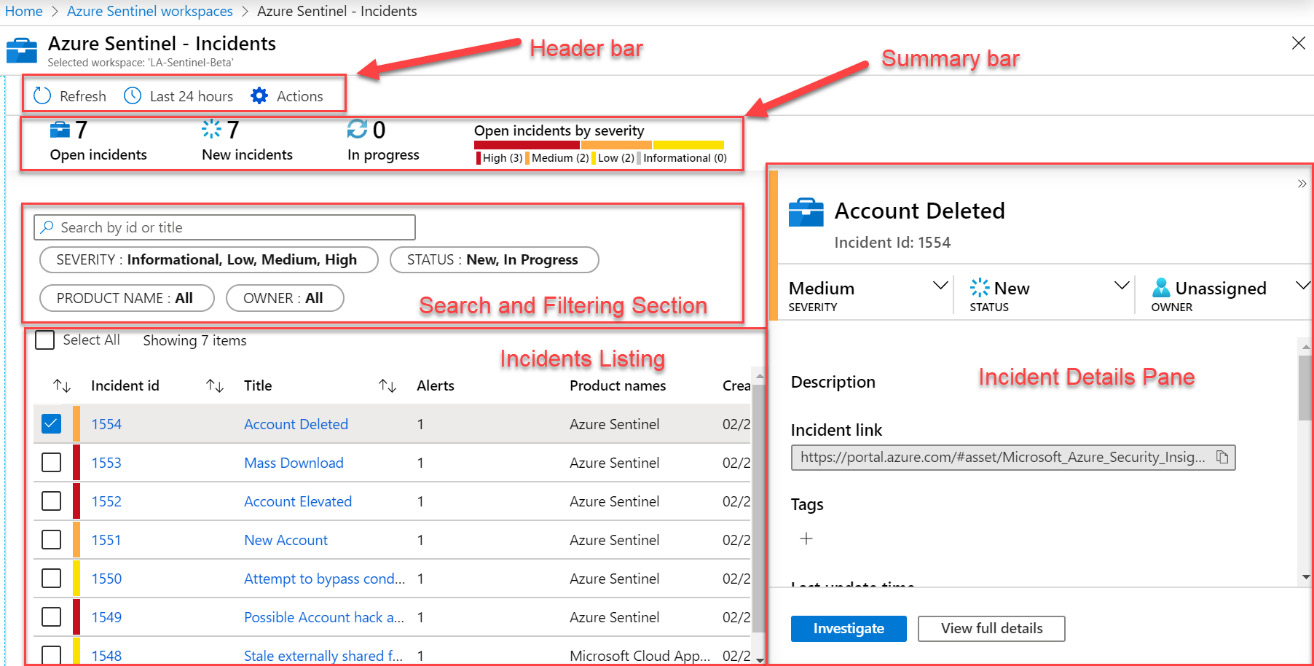
Figure 9.1 – Azure Sentinel Incidents page
The page has been broken up into the header bar, the summary bar, the search and filtering section, the incidents listing, and the incident details pane. Each of these sections is described in more detail next.
The header bar
The header bar, shown in the following screenshot, at the top of the page has the usual Refresh button and timespan drop-down option. However, there is also another button called Actions:
Figure 9.2 – Incidents page’s header bar
The Actions button will allow you to perform actions against multiple incidents at once, including changing the severity, assigning an owner, changing the status, and adding tags. See the Using the Actions button section for more information.
The summary bar
Under the header bar is the summary bar, shown in the following screenshot. This shows the total number of open incidents, the number of new incidents, and the number of incidents that are in progress:

Figure 9.3 – Incident page’s summary bar
On the right side of the summary bar is a listing of the open incidents broken down by severity. By looking at the two different summaries of the incidents, you can get an idea of how your incidents are broken down.
The search and filtering section
Below the summary bar is the search and filtering section. This is where you can filter what results you see in the listing of all the incidents:

Figure 9.4 – Incident page’s filtering section
Let’s take a look at all the parameters under the search and filtering section:
- Search by id or title: This filter allows you to enter a search term to find specific incidents. This can either be text found in the title of the incident(s) or the incident ID number.
Note
If you search by ID number, the value entered must be an exact match to an incident’s ID number.
You can also filter by the various fields that make up the incident display discussed next. As you can see, you can filter by SEVERITY, STATUS, PRODUCT NAME (which product generated the incident), and/or the OWNER (which is the person that is assigned to the incident).
- SEVERITY: This filter allows you to select one or more of Select All, Informational, Low, Medium, High, and/or Critical. By default, Select All is selected, which appears as just All in the summary bar, as shown in the preceding screenshot.
- STATUS: This filter allows you to select one or more of Select All, New, In-Progress, or Closed. By default, only the New and In Progress values are selected.
- PRODUCT NAME: This filter allows you to select one or more of Select All, Microsoft Cloud App Security, Azure Security Center, Azure Advanced Threat Protection, Azure Active Directory Identity Protection, Azure Information Protection, Microsoft Defender Advanced Threat Protection, and/or Azure Sentinel. By default, Select All is selected, which appears as just All in the summary bar, as shown in the preceding screenshot.
Additional products
As Microsoft adds more security-related products to Azure and the ability to create alert rules based on those products are added to Azure Sentinel, it is expected that this list will expand to include them.
- OWNER: This filter allows you to select one or more people to filter. Since anyone could be an owner of an incident, the actual list is too long and the values will not be listed here. Note that there are some special entries, including All Users and Assigned to me. All Users will show the incidents assigned to anyone, including those that are unassigned. Assigned to me will just show those incidents that are assigned to the user currently logged in.
Select All / All Users
The Select All / All Users entry in the filters section is a shortcut that allows you to select all the entries in the listing rather than having to select each one individually. By deselecting it, all the individual entries will be deselected as well, and each one can then be selected individually.
The search and filtering section is very useful for finding a specific incident. You can make use of these features to help you quickly locate incidents when there is a long list, especially if you just need to view those incidents to which you are assigned. Next, we will discuss what you do when you’ve found the incident you want.
Incident listing
Below the search and filtering section is the list of each incident, one per row, shown in the following screenshot. Here you can see a summary of the incident, including the incident ID, title, the number of alerts that make up the incident, the product names that created the incident, the date and time of creation, the owner, and the status:
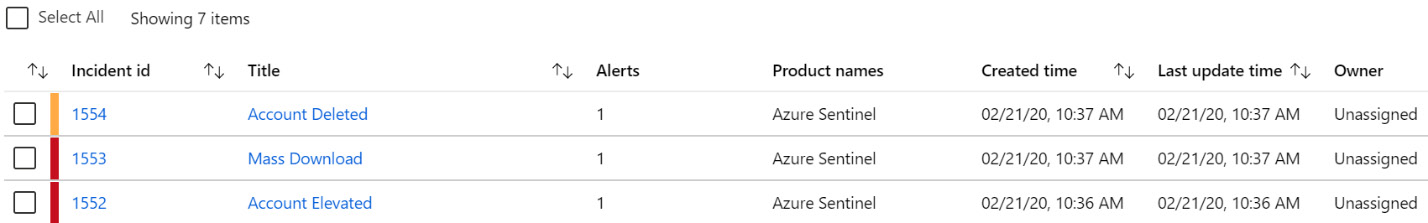
Figure 9.5 – Incident listing
On the far left is a checkbox. This checkbox is used to state that you want to perform an action on this incident. Refer to the Using the Actions button section for more information. You can also check the Select All checkbox at the top of this section to select all the incidents at once.
After that is a colored strip. The colored strip indicates the incident’s severity: red for high, orange for medium, yellow for low, and gray for informational.
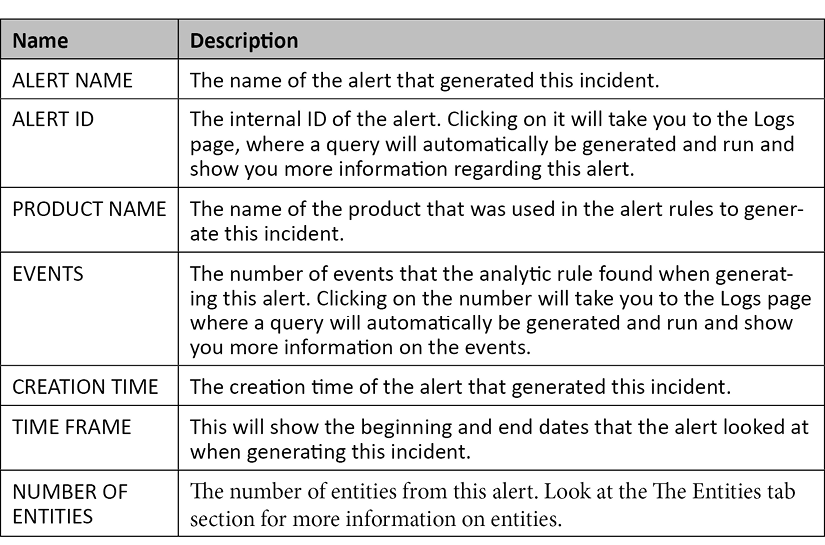
The remaining fields are described in the following table:
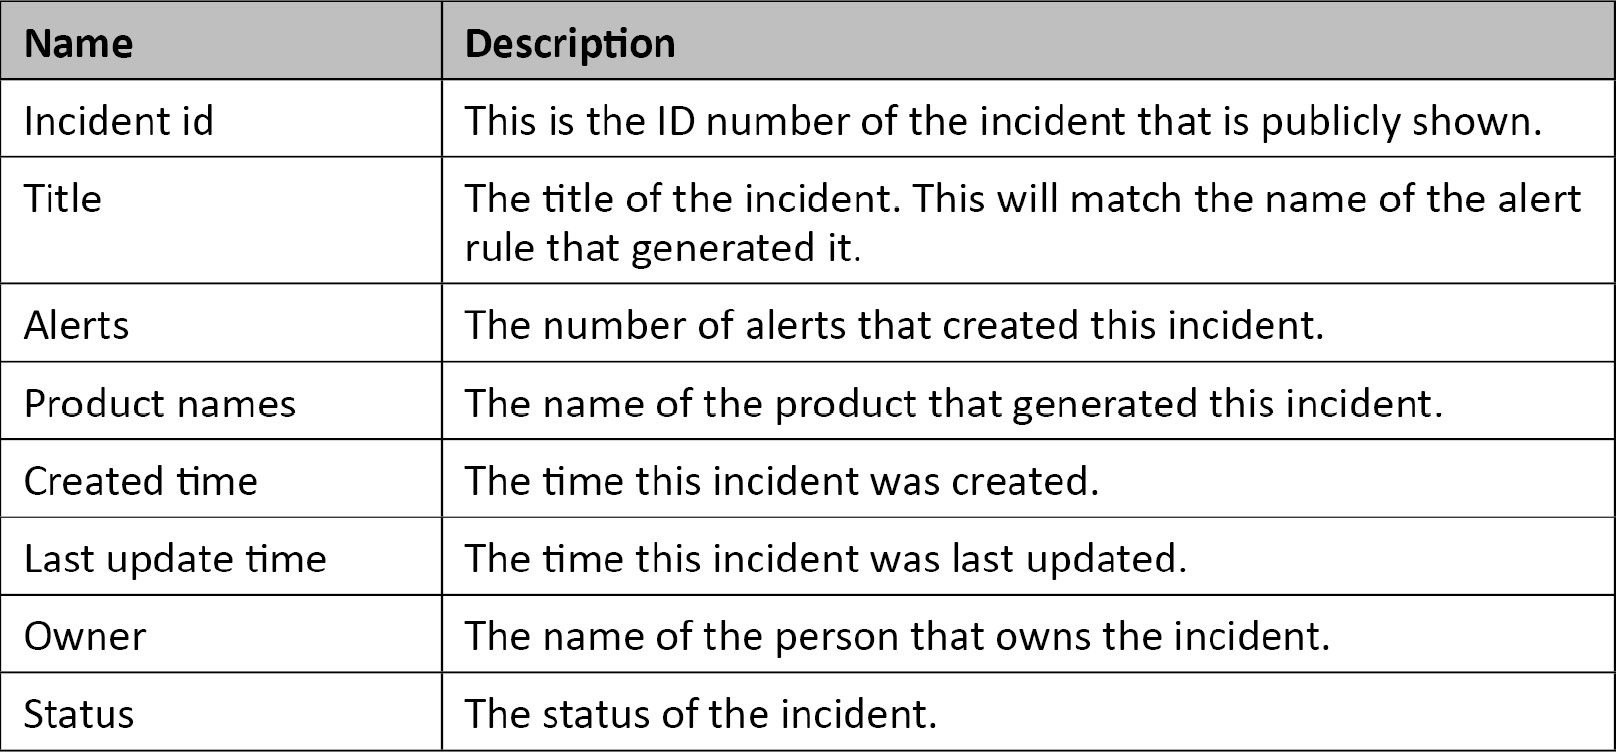
You can sort by the Incident id, Title, Created time, Last update time, and Status fields. Clicking on any of these fields will sort the listings in ascending order. Clicking again will change the sort to descending order.
Each incident has its own row in the listing with its own properties, as we have just seen. You can use most of these properties to sort the rows to help you find the incident you want. Next, we will look at the incident details pane, which will provide even more information about the selected incident.
Incident details pane
When you select any incident from the list, the incident details pane will open, which shows more information about the selected incident. Of course, the information will be different depending on which incident you select:
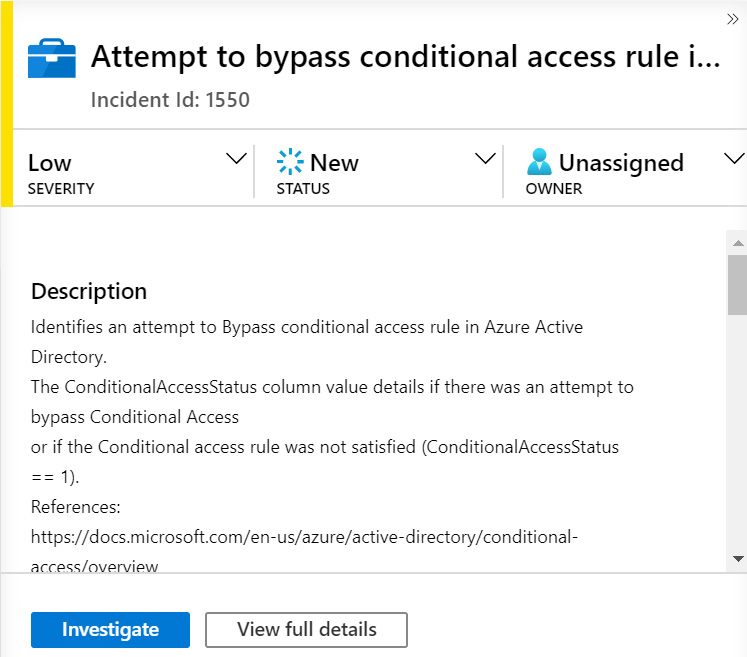
Figure 9.6 – Incident details page
At the top of the page is the title and the incident number appears directly beneath it. To the left of the title is a colored strip indicating the severity of the incident: red for high, orange for medium, yellow for low, and gray for informational.
Under that is the SEVERITY of the incident. This indicates how big of an issue this incident is and is defaulted from the analytic rule used to create this incident. You can change this value by using the drop-down list to select the new SEVERITY and then clicking on the Apply button to change the value, as shown in the following screenshot:
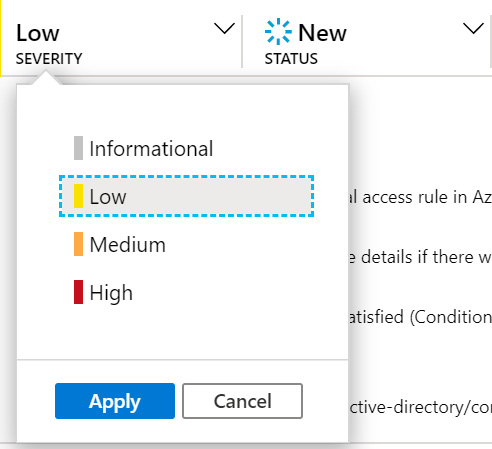
Figure 9.7 – Severity options
To the right of SEVERITY is STATUS. This indicates whether the incident is new, is being worked on, or is closed. Again, you can change the value by using the drop-down list to select the new status and then click the Apply button to change the value. Note that if you select Closed status, a new pop-up window will appear asking you to select the reason, either True Positive or False Positive, and add a comment. You will then have to click Apply again for the new status to take effect:
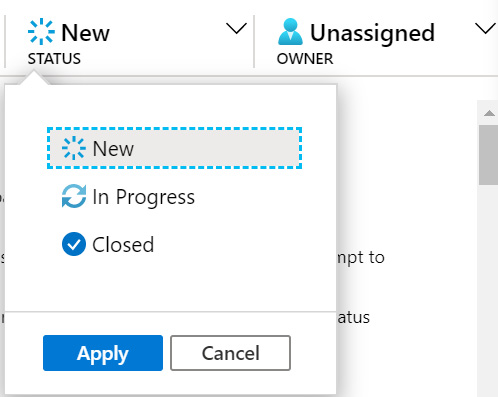
Figure 9.8 – Status options
On the far right is the owner of the incident. This is the person assigned to handle the investigation of the incident. Click the drop-down option to be presented with a list of possible owners, including an entry called Assign to me, which will assign the incident to the currently logged-in user, and Unassign Incident, which will remove the current owner of the incident. Click Apply once the owner has been selected to assign the incident to that user. Note that there can only be one owner for an incident, but it does not stop others from working on the incident:
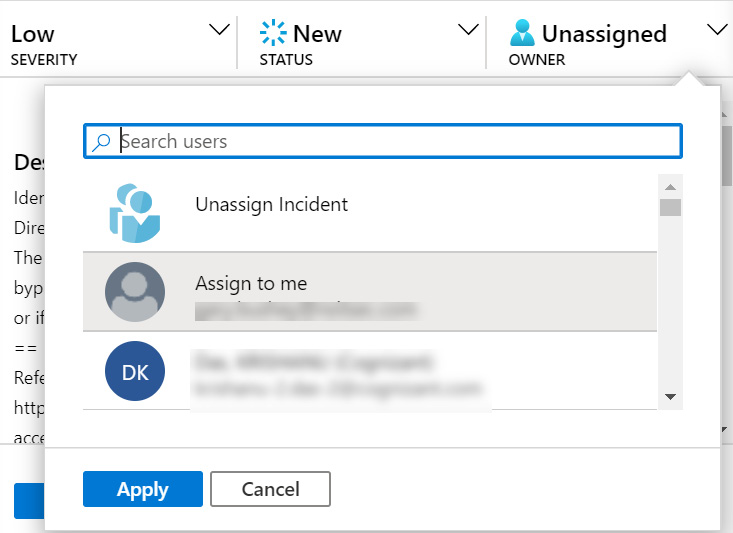
Figure 9.9 – Owner options
Under those dropdowns are descriptions of the incidents. This provides more details about an incident and can include items such as what the incident is looking for, how it was determined, and even external links to get more information.
Scrolling down on the details pane, we find Incident link, Tags, and Last update time, as shown in the following screenshot:
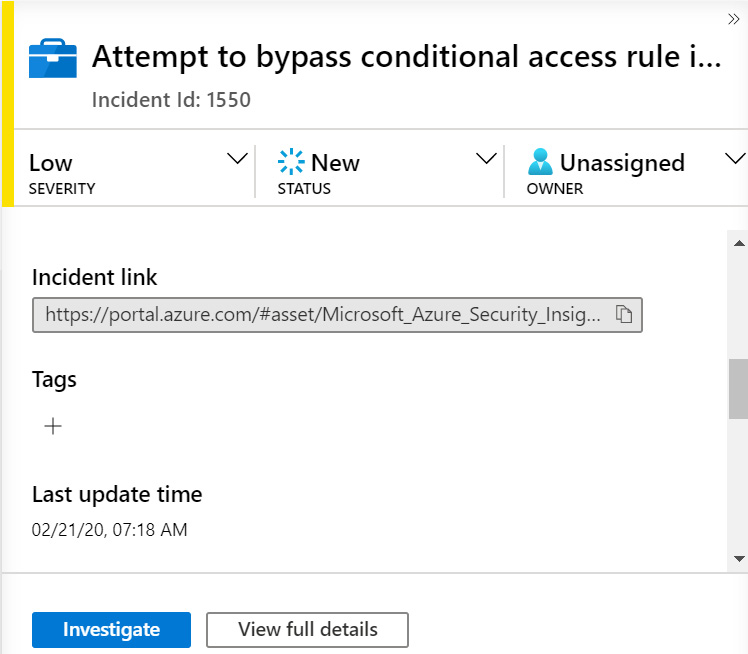
Figure 9.10 – Incident details page continued
The fields from the preceding screenshot are as follows:
- The Incident link provides a URL that you can provide to others that will take them directly to the incident’s full details page, described in the Full details page section. This makes it easier to get to an incident as the person will not need to traverse the Azure portal’s menus and then search for this incident.
- Under that are any tags that have been assigned to the incident. Tags are name/value pairs that enable you to categorize resources. Assigning a tag does not change the incident in any way; it just provides a way to filter incidents. Click the + button to add a new tag.
- Under Tags is Last update time, which tells you the last time the incident had any changes, including adding or removing a tag.
Scrolling down again, we find Creation time, Close reason, and Evidence, as shown in the following screenshot:
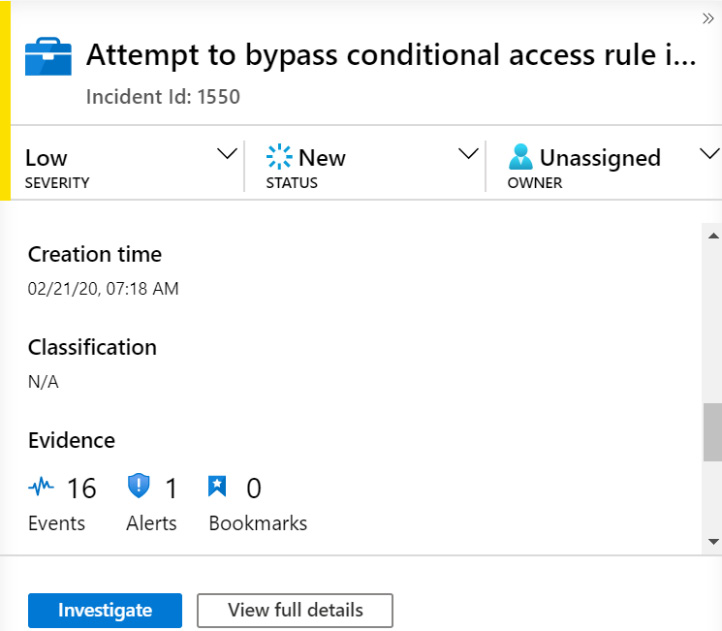
Figure 9.11 – Incident details page continued
The fields from the preceding screenshot are as follows:
- Creation time shows when the incident was created.
- Close reason will show the reason, either True Positive or False Positive, that was added if the incident was closed.
- Evidence shows the number of events that were found in the analytic rule that generated the alert. It is the total number of events from all the alerts that generated this incident, which is the number in the middle, and the number of bookmarks associated with the incident. Bookmarks will be described in the The Bookmarks tab section.
Scrolling to the bottom of the details pane, we find the Entities and Last comment fields as follows:
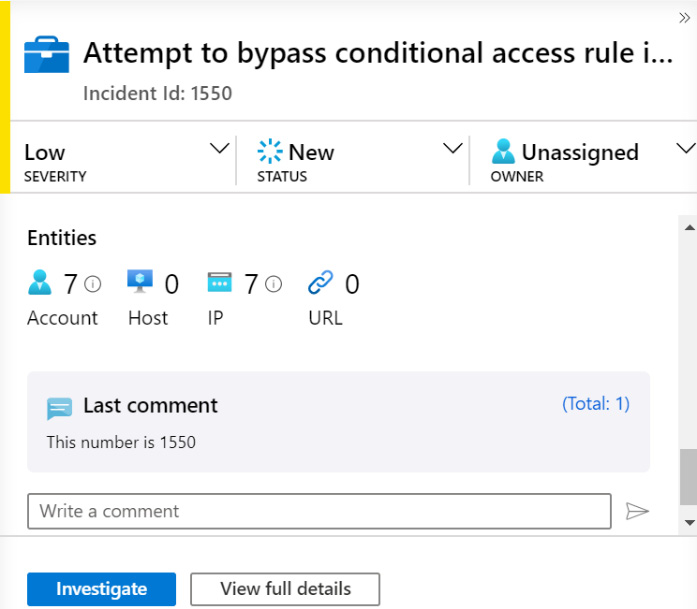
Figure 9.12 – Incident details page continued
The preceding fields are as follows:
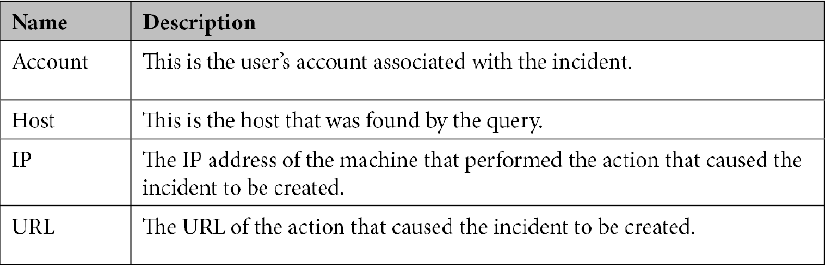
- Entities are used by Azure Sentinel when investigating an incident. At the time of writing, there are four different entities that may have a value, as listed in the following table. Depending on how the incident was created, each of the entities can have zero, one, or more associated values. There needs to be at least one of these entities with a value for the Investigate button to be active. Investigation will be discussed in the Investigating an incident section. The entities are as follows:
- At the bottom of the page will be the last comment that been added to the incident. To the right of Last comment is the total number of comments associated with this incident. Clicking on this number will take you to the Comments tab in the View Full Details page, described in more detail in The Comments tab section. To add a new comment, enter the text in the Write a comment text box and click on the submit button on the right. It will look like an arrow pointing to the right.
The Investigate button will open the investigation page, which will be discussed in the Investigating an incident section. The View full details button will open the full details page, which will be discussed in the Exploring the full details page section.
Now that you have seen how to look at and update a single incident, let’s take a look at how you can update multiple incidents at once. This is done by using the Actions button in the page’s header.
Using the Actions button
You have just learned how to change a single incident. What if you need to change more than one at a time? The Actions button from the header bar will allow you to do that.
The Actions button will allow you to make changes to multiple incidents at once. Looking back at the header in figure 9.2, you will see the Actions button. This button will allow you to perform the same action on multiple selected incidents.
First, in the listing of all the incidents, select the checkbox to the left of the incidents on which you want to perform the action. You can also select the checkbox called Select All to select all the incidents shown in the list.
After selecting the incidents that you want to handle, click on the Actions button and the Actions pane will open on the right, as the following screenshot shows:
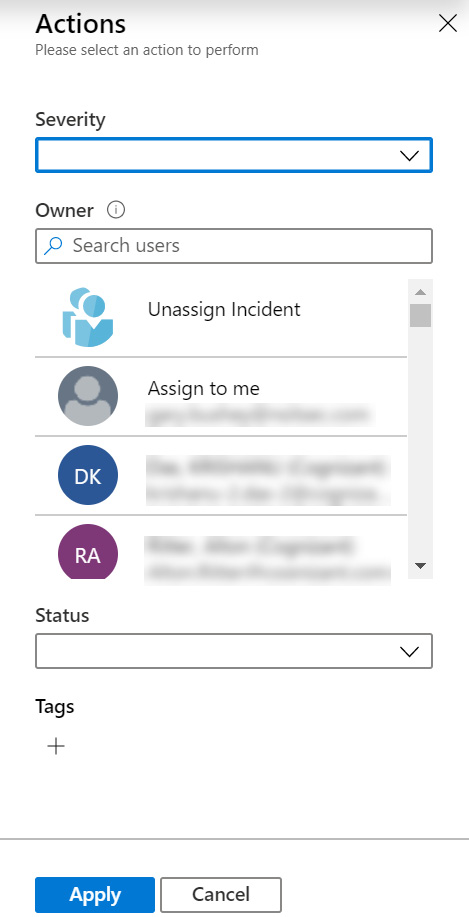
Figure 9.13 – Incident actions
Make any changes to Severity, Owner, Status, or Tags that you wish and then click Apply. Refer to the Incident details pane section for a refresher on any of the fields.
Now you know how to change some of the settings, not only for a single incident but also for multiple incidents. This will help you keep your incidents up to date. Next, we will look at the full details page, which will show us even more information regarding an incident.
Exploring the full details page
The full details page shows you a lot more information about the incident than you would see in just the incident listings and the incident details pane. Some additional information includes details on the alert(s) that make up the incident, any bookmarks associated with this incident, details on any entities that are part of this entity, and any comments added to this incident.
Clicking on the View full details button in the incident details pane will take you to the incident’s full details page, as shown in the following screenshot:
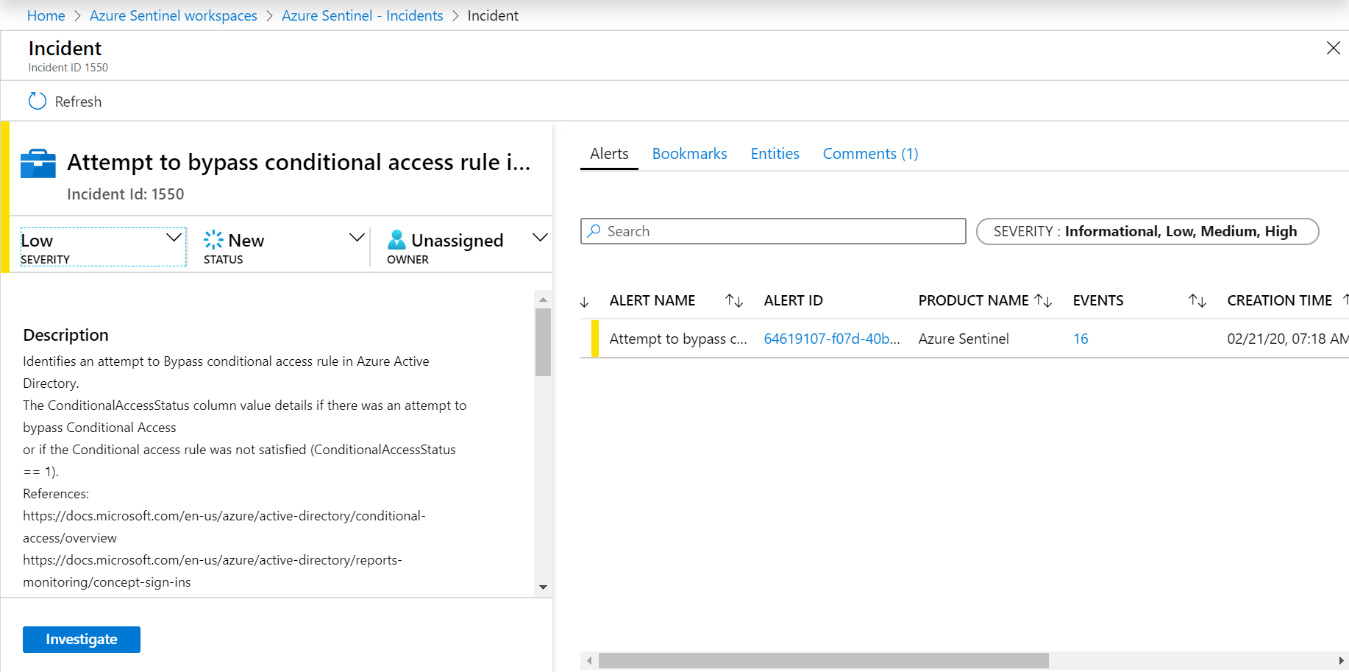
Figure 9.14 – Incident full details page
The left side of the page will show the same information as we saw in the Incident details pane section. As a matter of fact, the left side of the page is the same as the incident details pane. The right side of the page is broken up into tabs that show information about the alert itself, any bookmarks for this incident, the entities for this incident, and a list of all the comments. Each tab is described in further detail in the following sections.
The Alerts tab
This tab will show the one or more alert(s) that make up this incident. The following screenshot shows what it looks like, with a description of the fields following:

Figure 9.15 – Incident alert tab
First is a colored strip. The colored strip indicates the alert’s severity: red for high, orange for medium, yellow for low, and gray for informational.
The rest of the fields are described in the following table:
At the far right of this screen is the View playbooks link. Clicking on it will open a new pane showing all the playbooks:
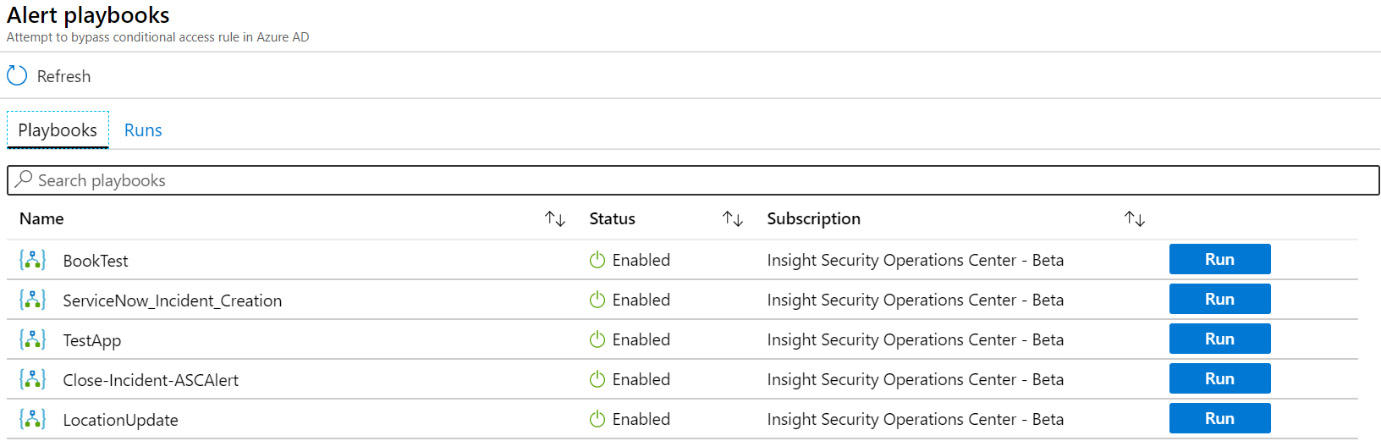
Figure 9.16 – Incident alert playbooks
You can click the Run button in each playbook’s row to run the playbook against the alert’s information, even if this was not the playbook associated with the analytic rule. Refer to Chapter 11, Creating Playbooks and Logic Apps, for more information on playbooks.
The Bookmarks tab
Clicking on the Bookmarks tab will show you all the bookmarks associated with this incident, as shown in the following screenshot. For more information on creating bookmarks, look at Chapter 10, Threat Hunting in Azure Sentinel:
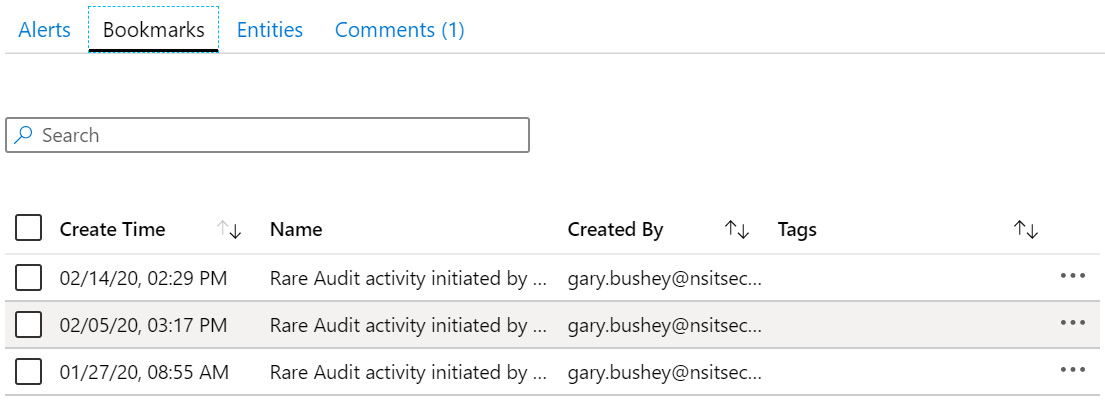
Figure 9.17 – Incident Bookmarks tab
You can use the Search textbox to search for a specific bookmark.
For each bookmark, the Create Time, Name, Created By, and Tags fields will be displayed. At the far-right side of each listing is a context-sensitive menu where the only option is Remove from incident.
Clicking on the context-sensitive menu will automatically select the bookmark, and clicking on the Remove from incident entry will prompt you to confirm that you meant to remove the bookmark. Selecting Yes will remove the bookmark from this incident. Note that if you have selected multiple bookmarks, the entry will change to say Remove X bookmarks from incident, where X is the number of selected incidents.
The Entities tab
This tab will show all the entities associated with this incident as shown in the following screenshot. There will be one row for each of the entities associated with the incident:
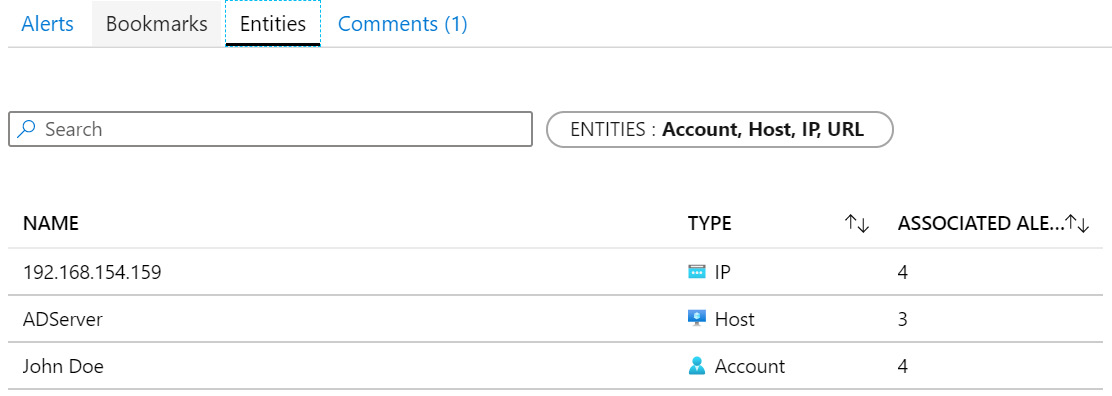
Figure 9.18 – Incident Entities tab
You can use the Search textbox to search for specific entities.
The ENTITIES filter allows you to select one or more of Select All, Account, Host, IP, and/or URL. By default, Select All is selected.
Each entity will be listed on a separate row. The name of the entity (which is also its value), the type, and the associated alerts will be shown. ASSOCIATED ALERTS tells you the number of other alerts that have been raised that contain the same entity. This information will be used in the Investigating an incident section.
The Comments tab
This tab will show all the comments associated with the incident. Note that the link will also show the total number of comments—in this case, 1. You can also use this page to add new comments if desired:
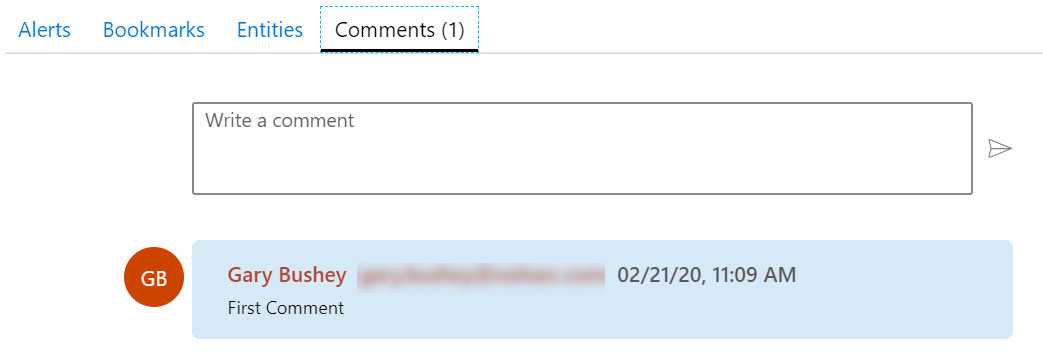
Figure 9.19 – Incident Comments tab
Adding comments while performing your investigation will help you remember what you were doing. They will also help others that may need to come in later and either look at the same incident or investigate one that is similar. Next, we will look at how to go about investigating an incident.
Investigating an incident
Remember in Chapter 7, Creating Analytic Rules, you learned that the rules in analytics create incidents. Incidents are not worth anything if they just sit there without being investigated; after all, that is the reason they were created. An investigation is used to determine whether the incident is actually an issue. For example, an incident describing failed logons could be as simple as someone forgetting their password, or it could be someone trying to crack a password. You will not know which until an investigation is performed.
Now that you know how to look at an incident and retrieve all the information regarding it, it is time to see how to investigate an incident. The main way this is done in Azure Sentinel is via the graphical investigation page. This is a graphical interface that not only shows you the incident in question but can also be used to find related information.
When you are looking at an incident’s details, at the bottom of the screen is the Investigate button. You click this to start the graphical investigation. If this button is grayed out, that means there are no entities associated with this incident. There needs to be at least one entity for the graphical investigation to work.
Clicking on the button will take you to a page that looks something like the following. Depending on the entities associated with your incident, the actual information presented will likely look different, but the functionality will be the same:
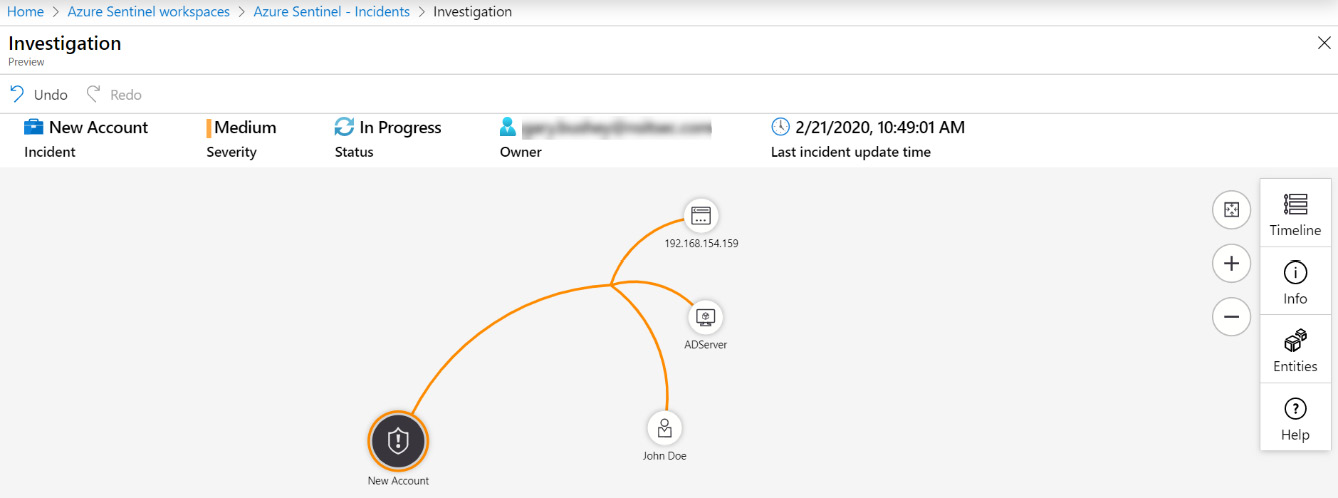
Figure 9.20 – Incident investigation screen
The header bar gives you general information regarding the incident including title, severity, status, owner, and last update time.
On the right side of the screen are two columns of buttons. The column on the left contains the screen control buttons. The top button will fit your diagram to the screen. This is useful if you zoom in or out too far. Under that is the zoom-in button, and at the bottom is the zoom-out button. You can also use your mouse’s middle button to perform zooming if you have one. On the far right of the page are the buttons related to the incident itself, and each is described in more detail in the following sections.
This is an interactive user interface, so you can move the various objects shown on the screen around as needed, as well as the entire image. This can make it easier to see the part you are interested in when you zoom in.
While being able to see the incident graphically is nice, the real benefit comes when you look at the related alerts to get a bigger picture of the incident.
Showing related alerts
If you hover your mouse over an entity, this will show a pop-up window with more options, as shown in the following screenshot. This will vary a bit depending on the type of entity you have selected, but they will all show the Related alerts action:
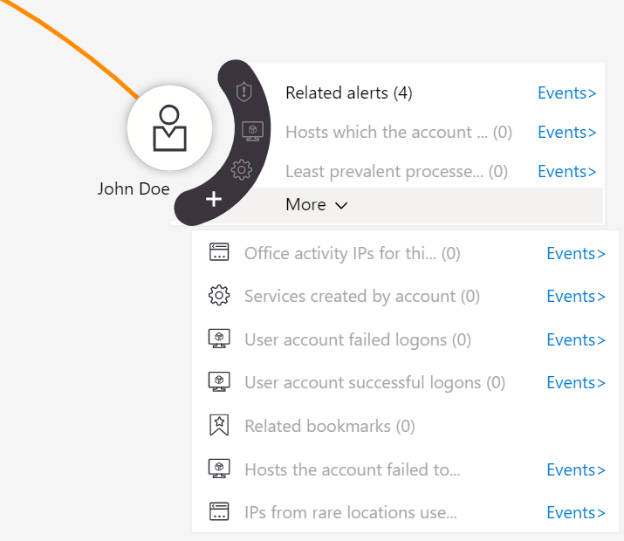
Figure 9.21 – Related alerts
Selecting this will bring up all the alerts related to that entity. In the following screenshot, the related alerts for the user entity are shown:
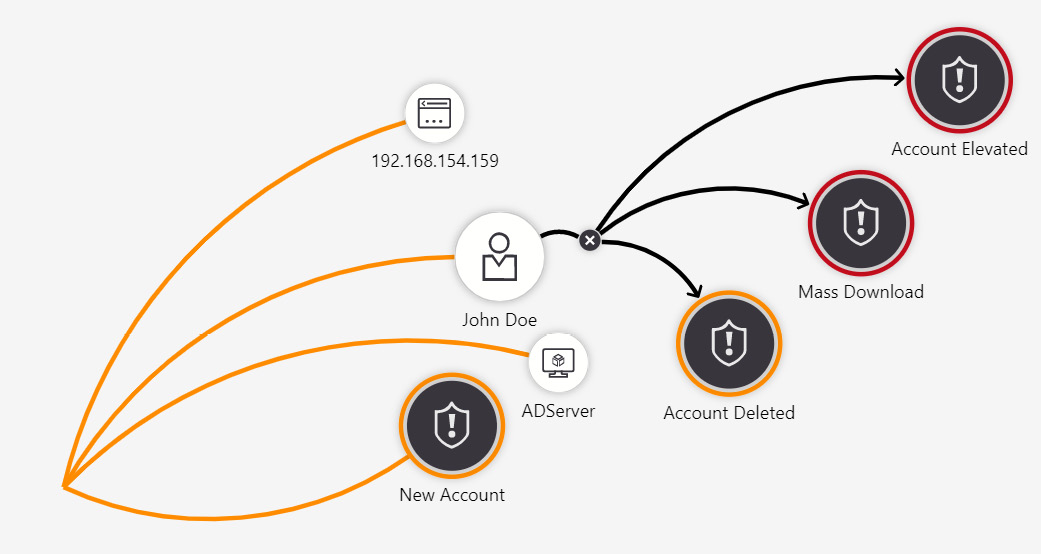
Figure 9.22 – Alerts related to the selected user entity
This will help you determine what else has occurred that is related to this entity. By seeing what other alerts are related to this user, in this example, you can see what else they have done. We can see that the user entity is also an entity in an Account Elevated, a Mass Download, and an Account Deleted incident.
Although it is called Related entities, since you are looking at an alert rather than an entity, you can perform the action that we just discussed. In the following screenshot, Mass Download was expanded. This has brought in a new host entity, HRServer, and the connections made:
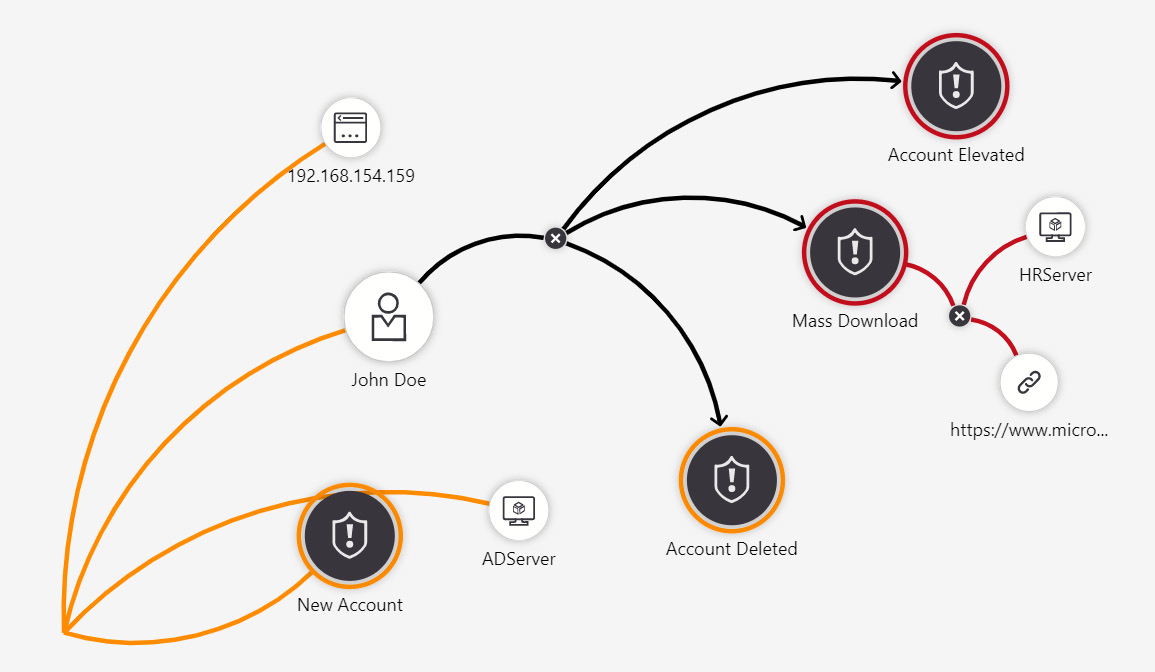
Figure 9.23 – Investigating user activities
The other actions available when you mouse over an entity, called exploration queries, will work similarly to how the related alerts action works. Looking back at Figure 9.21, you can see that there are entries called Services created by this account, user account failed logons, and more. In this case, all the entries have a (0) after the name, indicating that the query did not find any results. If any of these entries had one or more results, it would be worth selecting it to see what the results are as part of your investigation.
Now that we know how to look at an incident, its related incidents, and its exploration queries, let’s discuss the incident buttons located on the far-right side of the screen in detail.
The Timeline button
The Timeline button shows the timeline of all the incidents being shown on the screen. If this incident was just opened, then there will probably only be one incident shown, but if you show a lot of related alerts, then the timeline will show a history of when the alerts occurred, as shown in the following screenshot:
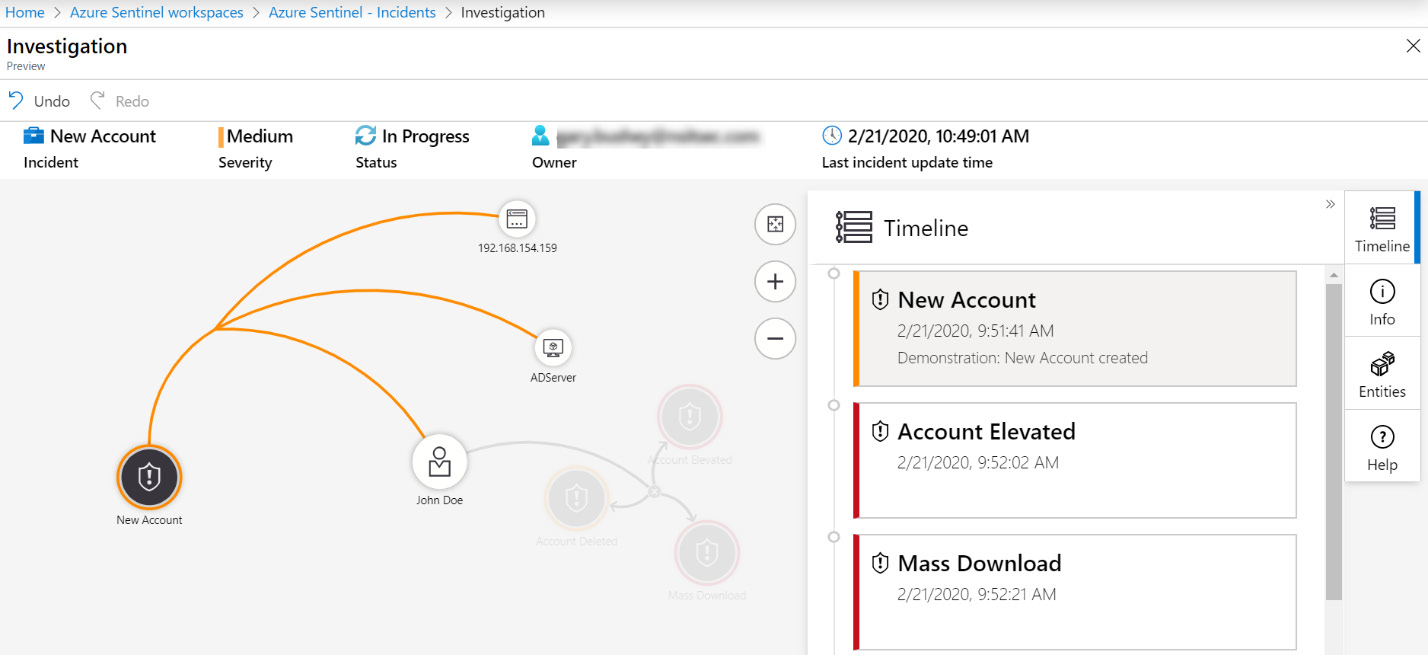
Figure 9.24 – Investigation timeline
In the preceding screenshot, notice that New Account incident is selected in the Timeline list. When you select a single incident, only those entities related to that incident will be highlighted in the view; the rest will be grayed out as shown. This makes it easy to progress through the timeline and see what entities are related to which incidents.
The Info button
The Info button will show information on whichever entity you have selected. For the IP, host, and account, this will show either ADDRESS, HOSTNAME, or ACCOUNTNAME depending on which type you have selected, and, no matter which type you selected, the FRIENDLYNAME of the selected entity as follows:
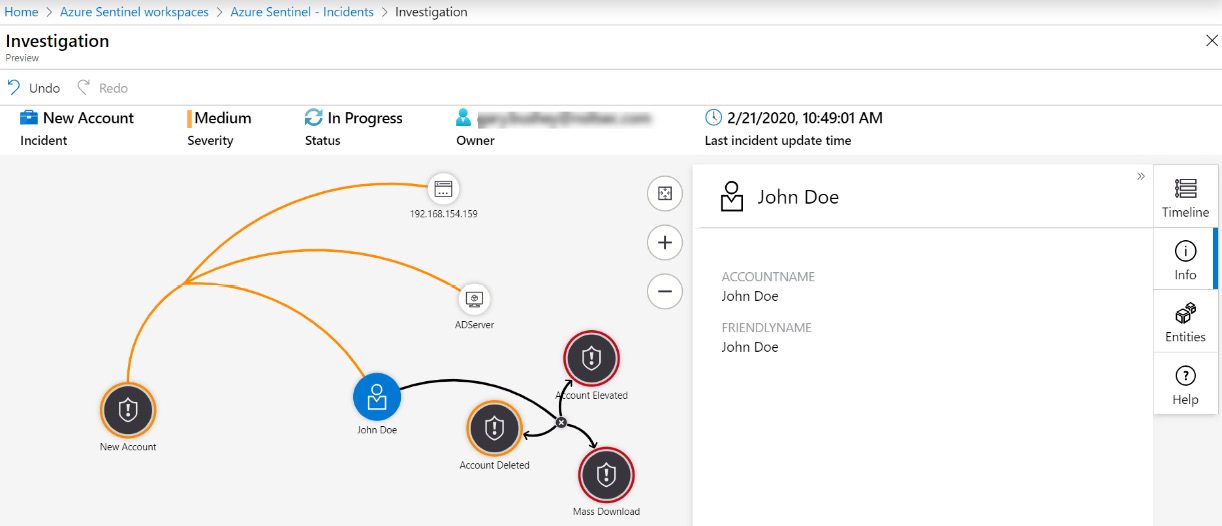
Figure 9.25 – Entity information
However, when you select a URL, what is shown in the pane will look very different from when you select any other entity. Azure Sentinel will perform URL detonation on all URL entity types. This means it will check the URL against a list of known bad addresses and will go out and grab a screenshot of the website at the time the alert fired.
The following screenshot shows what this may look like:
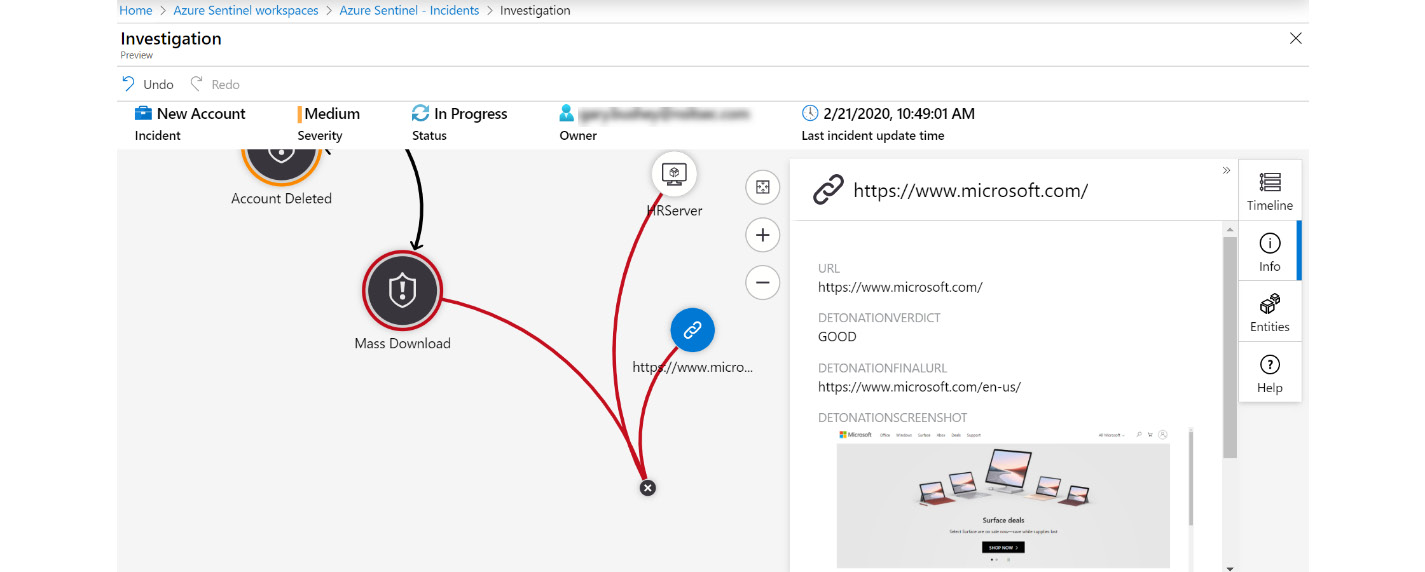
Figure 9.26 – URL investigation
URL is the URL entity from the incident. DETONATIONVERDICT is either BAD if the URL is deemed to be a bad site (for instance, one known to push malware), or otherwise GOOD. DETONATIONFINALURL is the final destination after all the URL redirects occur. DETONATIONSCREENSHOT is a screenshot of the site at the time the alert was fired. You can click on that image to see a larger view.
The Entities button
The Entities button will show a list of all the Entities, Alerts, and Bookmarks related to all the information being shown on the screen. If you are just starting to investigate this incident, then this will most likely just be the information for your incident. However, if you are looking at a lot of related alerts, this will show all the information for those alerts as well:
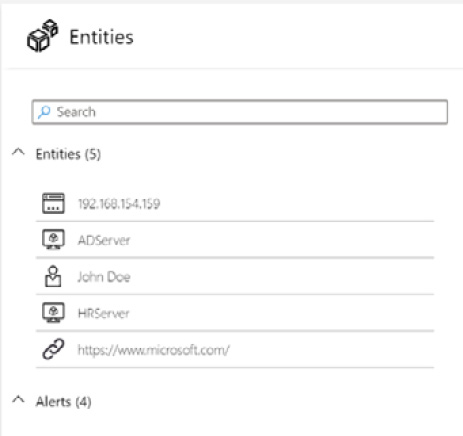
Figure 9.27 – List of related entities
If you hover your mouse over any of the items listed, the user interface (UI) will highlight the entities related to the item, much like it did for Timeline.
The Help button
The Help button shows general help for this screen. The main screen of this page shows the entities and how they are related to each other. This is a fully interactive screen, meaning you can move around the objects to get a better view as well as zooming in and out.
That was an introduction to how to start performing an investigation into an incident in Azure Sentinel. There is much more to performing investigations and the links in the Further reading section should help.
Summary
In this chapter, you learned about the Azure Sentinel Incidents page and its various components. You learned how to view an incident and change its values, including who owns that incident, its severity, and how to close an incident.
You also learned how to view more details about the incident along with the alert(s) that generated it, any bookmarks associated with it, the entities that incident contains, and all the comments added to it.
Finally, you learned about Azure Sentinel’s graphical incident investigation feature. This allows you to not only view the incident in question but also the related alerts, the timeline of those alerts, and more information about the entities.
In the next chapter, you will learn about hunting for issues that alerts and incidents may not have found.
Questions
- If I only want to see a listing of incidents that are in progress, what should I do?
- Looking at an incident in the details pane, in what two ways can I tell what the incident’s severity is?
- I am looking at an incident in the incident details pane and the Investigate button is grayed out. What does that indicate?
- If I want to get the full details of the first alert that generated an incident, what should I do?
- How can I tell whether the URL in my URL entity is malicious?
Further reading
You can refer to the following links for more information on topics covered in this chapter:
- Use tags to organize your Azure resources: https://docs.microsoft.com/en-us/azure/azure-resource-manager/management/tag-resources
- Keep track of data during hunting with Azure Sentinel: https://docs.microsoft.com/en-us/azure/sentinel/bookmarks
- Five steps of Incident Response: https://digitalguardian.com/blog/five-steps-incident-response
- SANS Incident Response Policy template: https://www.sans.org/security-resources/policies/general/doc/security-response-plan-policy
- SANS Sample Incident Handling Forms: https://www.sans.org/score/incident-forms
- NIST Incident Response Guide: https://nvlpubs.nist.gov/nistpubs/SpecialPublications/NIST.SP.800-61r2.pdf