
Chapter 10: Threat Hunting in Azure Sentinel
Threat hunting is part science, part art, and part intuition. Usually, you are looking for something that may have happened in your environment. It may be that you think something has happened due to external events, such as something odd showing up in the workbooks, a notice from a threat intelligence feed, or even something you just read about on the internet, and you want to investigate. No matter why you are performing your hunt, the tools in Azure Sentinel, including queries and Jupyter Notebooks, remain the same.
Threat hunting is a series of activities that you will perform during your investigation. While there is no set guidance on how to perform threat hunting, this chapter will introduce you to the tools that are available in Azure Sentinel to help you perform your investigations.
A brief introduction on how to perform threat-hunting activities will also be discussed, which will include aspects such as how to determine where to look for information. The cyclic process of threat hunting will be introduced as well.
In this chapter, we will cover the following topics:
- Introducing the Azure Sentinel Hunting page
- Working with Azure Sentinel Hunting queries
- Working with Livestream
- Working with bookmarks
- Using Azure Sentinel Notebooks
- Performing a hunt
Introducing the Azure Sentinel Hunting page
To access the Azure Sentinel - Hunting page, select the Hunting link in the Azure Sentinel navigation menu. This will show the Azure Sentinel - Hunting page, which will look like the following screenshot:
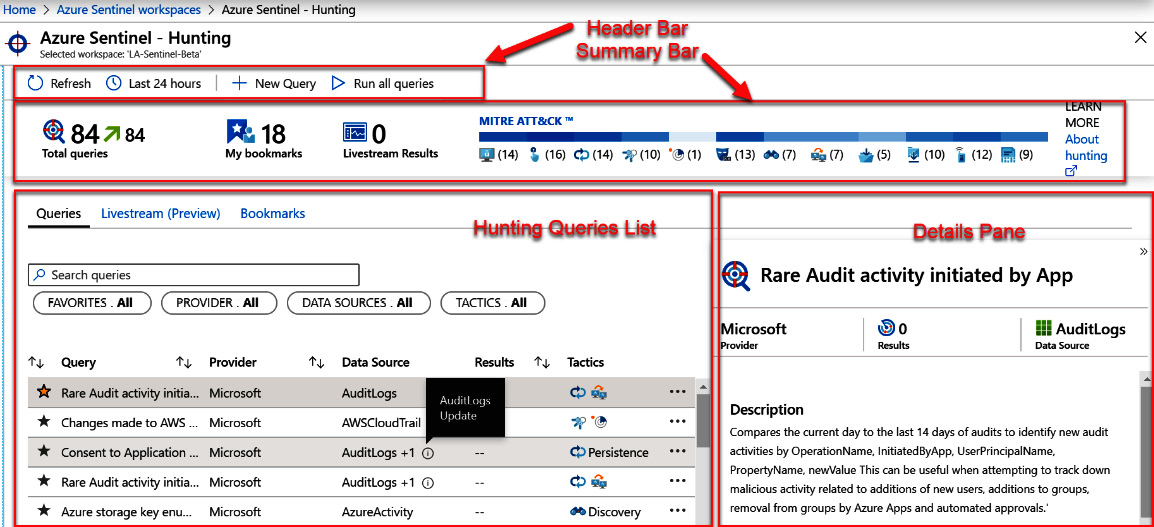
Figure 10.1 – Hunting page overview
Each of these sections will be described in more detail in the following sections.
The header bar
The header bar, at the top of the page, has the usual Refresh and timespan dropdown. There is also a New Query button that will allow you to create a new query (refer to the Adding a new query section for more information). The header bar can be seen in the following screenshot:

Figure 10.2 – Hunting page's header bar
Finally, we have the Run all queries button. This button will run all the hunting queries in the background and will then update the hunting query list section with the number of results found. This is easier than running each query one after another, and should usually be one of the first actions you perform when accessing this page.
The summary bar
The summary bar shows the total number of queries that are available to run, the total number of bookmarks that you have (refer to the Working with bookmarks section for more information), the number of results from running Livestream queries (refer to the Working with Livestream section for more information), and then, how the queries are broken down based on their MITRE ATT&CK™ tactics, as shown in the following screenshot:

Figure 10.3 – Hunting page's summary bar
Note
You can visit https://attack.mitre.org/tactics/enterprise/ to learn more about MITRE ATT&CK® tactics.
Clicking on any of the icons in the MITRE ATT&CK® breakdown will show you only those queries that have that specific attack type associated with it. So, if you click on the Initial Access icon (the first icon that looks like a monitor), it will only show those hunting queries that have Initial Access as one of their entries in the Tactics field.
The summary bar gives you a good overview of how your hunting queries are broken down. This can make it easier to find those queries that you need in your investigations.
The hunting queries list
Below the header is a listing of all the hunting queries. At the top of the listing is the search and filtering section. This works like other pages' search and filtering sections, so it will not be described in detail here. Refer to the Search and filtering section in Chapter 9, Incident Management, for a refresher on how this works.
Each row will show a star icon that shows whether it is a favorite. If it is a favorite query, the star will be selected; otherwise, it is not. Another benefit of making a query a favorite is that each time you go the Hunting page, the favorite queries will automatically run.
Each row will also list the name of the query, where it came from, the first data source that is required (note that in the following screenshot, the more information icon was shown with the mouse placed on it to display what the tooltip would look like if there are multiple data sources required), the number of results found for the query, and then, any of the MITRE ATT&CK® tactics selected for this query, as follows:
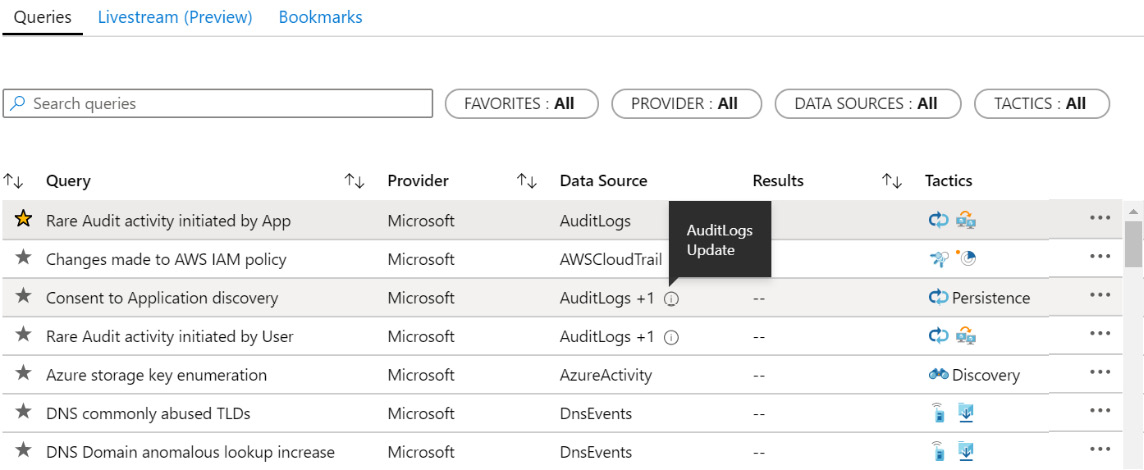
Figure 10.4 – Hunting queries list
At the very end, on the right-hand side, is the context-sensitive menu where you can run the query, add/remove the query to your FAVORITES list, edit the query (if you created it), clone the query (so that you can edit it), and delete the query (again, if you created it). Refer to the Working with Azure Sentinel Hunting queries section for more information.
This covers all the fields of the Azure Sentinel - Hunting page. As you saw, you can learn a lot about each hunting query from here. However, there is more information pertaining to the query, and you will read about that in the next section.
Hunting query details pane
When you select any query from the list, the hunting query details pane will open the query and will show more information about it. Naturally, the information shown will depend on which query was selected. An example can be seen in the following screenshot:
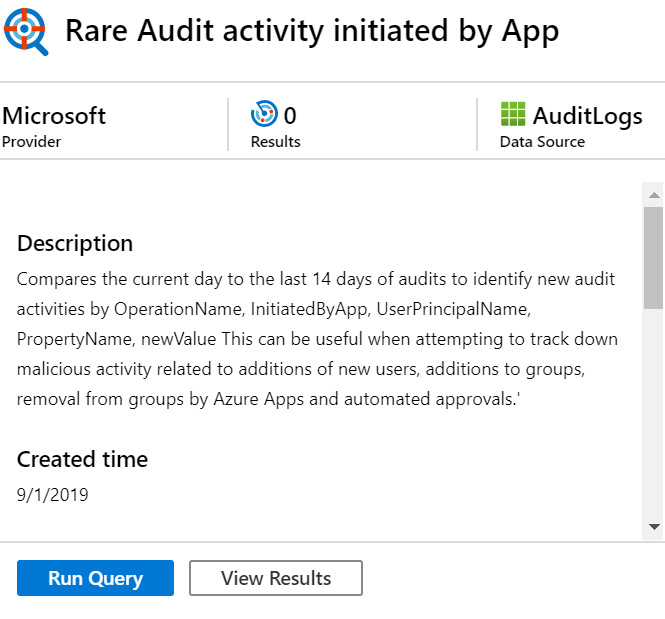
Figure 10.5 – Hunting query detail pane
At the very top of the page is the title of the page. Immediately under that is the name of the who that wrote the query. In this case, it is Microsoft, but if it is a query that you created, it will say Custom Queries. Next to that is the number of results for this query. On the right of that is the first data source that this query is using. If there is more than one data source for this query, you will need to hover your mouse over the more information icon to see them, as shown in Figure 10.4.
Under that is the description of the query. This will provide you with information as to how the query works and what it is looking for.
Under the Description field is the Created time field, which will tell you when this query was created. For any of the queries that came with Azure Sentinel, this will be when this Azure Sentinel instance was created.
Scrolling down, there are more fields, as shown in the following screenshot. The Query field will show the Keyword Query Language (KQL) query that this query will run. Under this is a link called View query results, which will take you to the Logs page and run this query. Refer back to Chapter 6, Azure Sentinel Logs and Writing Queries, for more information on the Logs page:
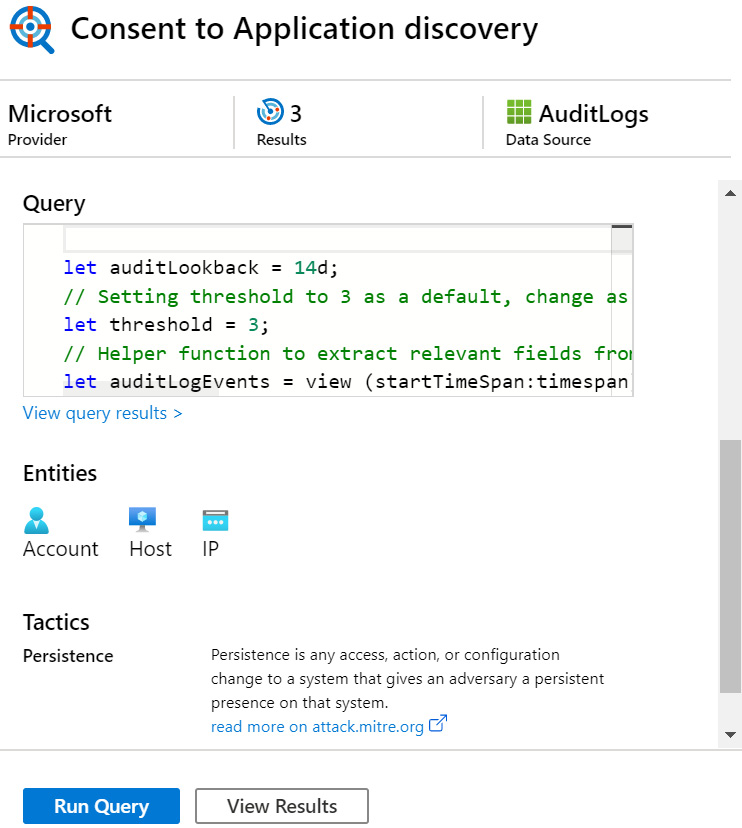
Figure 10.6 – Hunting query detail pane (continued)
Under that is a listing of Entities that will be filled in when this query is run.
Note
If there are no entities, this section will not show at all.
Under that is the Tactics section, which will provide more details about each tactic that is associated with this query, as well as a link to get more information on the tactics. If there are none, this section will not show at all.
At the bottom of the details page are the Run Query and the View Results buttons. The Run Query button will run the query in the background and will show the number of the results in the Hunting Queries listing section. The View Results button will work just like the View query results link described earlier.
Now that you have seen the various parts of the Hunting page, let's take a look at the hunting queries that you can run to start your investigation.
Working with Azure Sentinel Hunting queries
While there are a lot of pre-existing queries, with more being added all the time, there may be times when you need to add your own or modify an existing query to better suit your needs.
Adding a new query
To add a new query, click on the New Query button at the top of the Hunting page. This will open the Create custom query page, as shown in the following screenshot. This is very similar to creating a new scheduled query, as discussed in Chapter 7, Creating Analytic Rules, so you can read the Creating a new rule using the wizard section as a refresher:
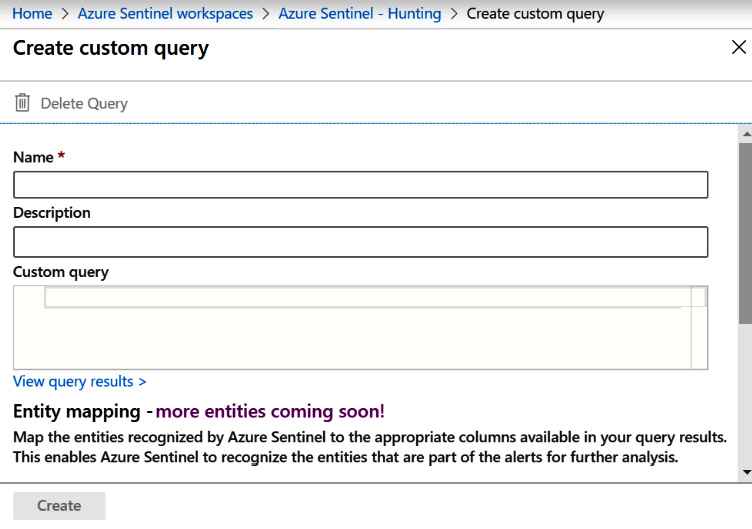
Figure 10.7 – Adding a new query
Fill in the Name, Description, and Custom query fields. If your query has any entities, use the Entity mapping section to add the entity mapping to the query. Remember to add them one at a time. Finally, select one or more tactics (not shown in the screenshot) that this query is using.
Once all the information has been filled in, click on the Create button to create the new query.
Now that you have added a new query, what happens if you need to make a change to it? The next section talks about editing a query and will answer that very question.
Editing a query
If a query is not working quite like you expect, or you want to update information about the query, you can edit it to make the needed changes.
To edit a query, click on the context-sensitive menu (denoted by the three periods at the far right of the line) to the right of the query's name in the Query list, and select Edit Query, as shown in the following screenshot:
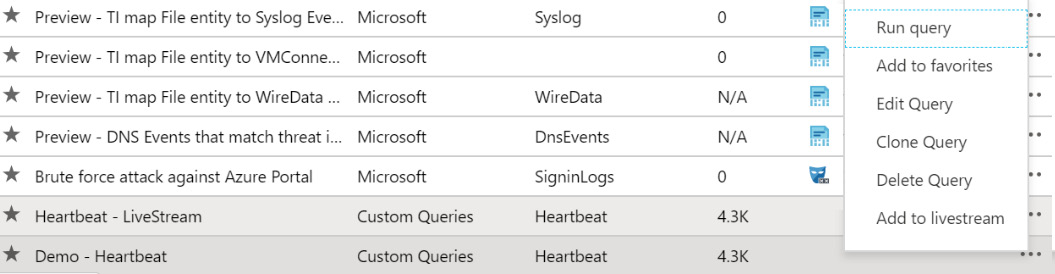
Figure 10.8 – Context-sensitive menu
This will bring up the same page that was shown in figure 10.7, when adding a query was discussed earlier. Make the necessary changes, and click on Save to save your changes.
You can always click on the X in the upper right-hand corner of the window to close the window without saving any changes. If you have made any changes, you will be prompted for verification that you want to close the window without saving your changes.
Now, you know how you can change a query as needed. What if you want to make a new one and change the new one? You can clone the query, as described in the next section.
Cloning a query
You may have noticed that you cannot edit a pre-existing query. If you need to modify a pre-existing query, you will need to clone it first to make a custom query, and then change the new custom query.
To clone a query, click on the context-sensitive menu, as shown in the previous section, and click Clone Query. This will open the same window that is shown when adding a new query, and all the fields will be filled in with the same information that the original query has, except for the Name field.
The Name field will be filled in with the name of the original query, but will have Copy of prepended to the name. This is done so that there are not two queries with the same name, which can lead to confusion, although there is nothing preventing you from having multiple queries with the same name.
When you have made all the necessary changes, click the Create button to create the new query.
At this point, you can add a new query, edit a query, and create clones of the queries. You may find that some of the queries are no longer needed, and so you may want to get rid of them. The next section will tell you how to delete queries that are no longer needed.
Deleting a query
If you need to delete a query, click on the context-sensitive menu and select Delete. This will show a pop-up window, asking to verify that you want to delete the query. Click on Yes to delete it.
Now, you know how to work with the individual hunting queries. Running these queries can be the first step of your investigation. Usually, you will need to perform more queries than just those, though, and being able to retrieve the results later can be quite useful.
The next section will discuss working with Livestream, a new feature that allows you to watch the results of a query in real time.
Working with Livestream
Livestream is a new feature for Azure Sentinel that will allow you to watch one or more hunting queries in real time, to see new results as they occur. This can be useful when performing an investigation, to watch whether a query has any new results without having to constantly rerun the query.
Note
At the time of writing this book, the Livestream feature was still in preview and, as such, the features and functionality may have changed.
Looking back to Figure 10.8, the last entry in the context menu is called Add to livestream. Selecting this will add the query to the Livestream window, as follows:
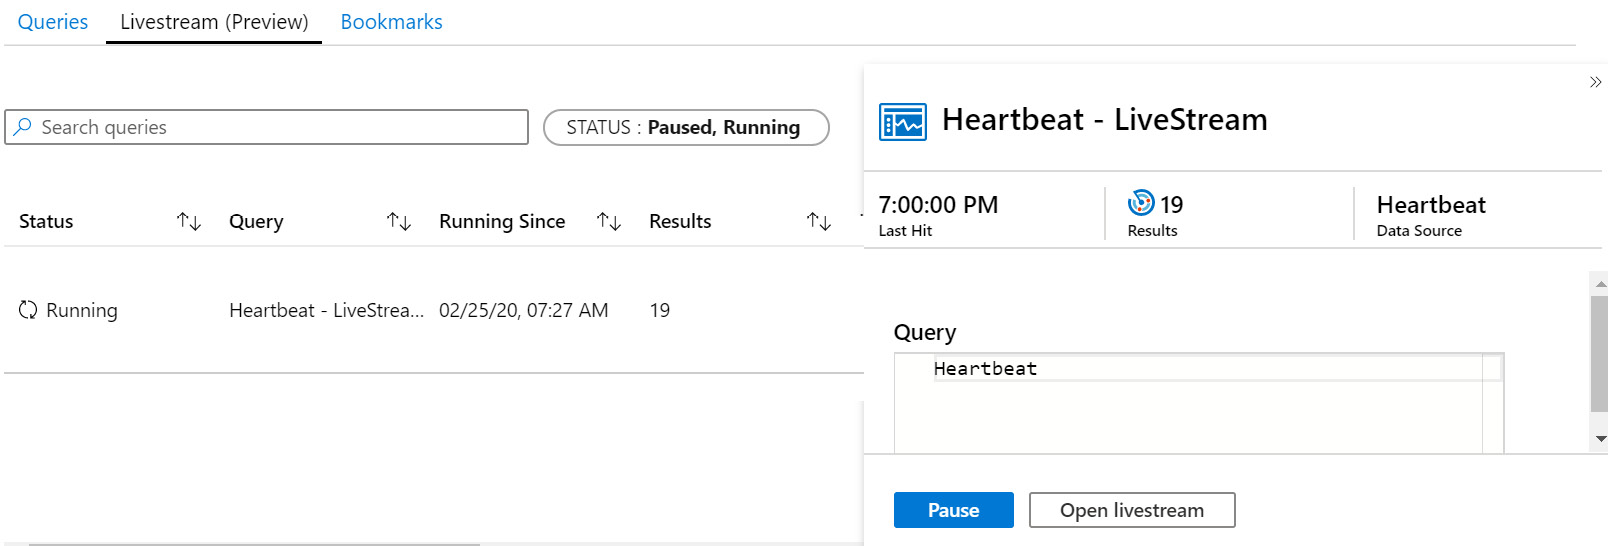
Figure 10.9 – Adding a query to Livestream
While this query is added to Livestream, it is not yet running. Click on the Open livestream button on the bottom of the query's detail page. If there is more than one query listed on the page, make sure to select the query you want to watch before clicking this button.
This will open the Livestream window. Here, you can start or stop the query, promote it to an alert rule, modify the query, and see the results, as shown in the following screenshot:
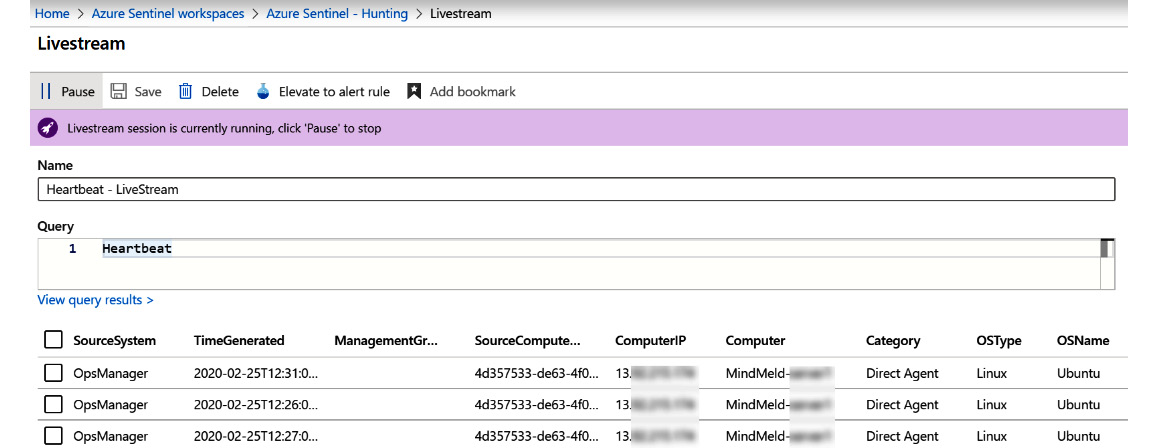
Figure 10.10 – Livestream page
At the bottom of the screen are all the results that have been added since the query started running. The columns that are displayed will depend on the query that is being run.
Adding a query to the Livestream and enabling it causes that query to be run every minute. If the query runs and the display increments, it means that a potential threat is active. Additionally, you can move away from the Livestream tab, and it will continue running. You will be notified through the Azure console notification system as new artifacts are incrementing during the Livestream session. You can also select the individual rows of the results and add them as bookmarks, which will be described in the next section.
Adding queries to Livestream can be a very useful tool to watch what is happening in your environment in almost real time. By watching one or more queries, you will get to see the results show up when they happen.
In the next section, we will discuss bookmarks, which will allow you to save the results from queries and associate them with an incident, to assist you further with your investigations.
Working with bookmarks
While carrying out investigations, there may be times when you need to keep track of the results from previously run queries. It could be that you need to work on another project and will come back to this investigation later, or another user will be taking over the investigation. You may also need to keep certain results as evidence of an incident. In any case, using a bookmark will allow you to save this information for later.
Creating a bookmark
In order to create a new bookmark, you must run a query from the Logs page—refer to Chapter 6, Azure Sentinel Logs and Writing Queries, for a refresher. While on the Hunting page, clicking the Viewing Results button in the query's details pane will open the Logs page showing your results, as follows:
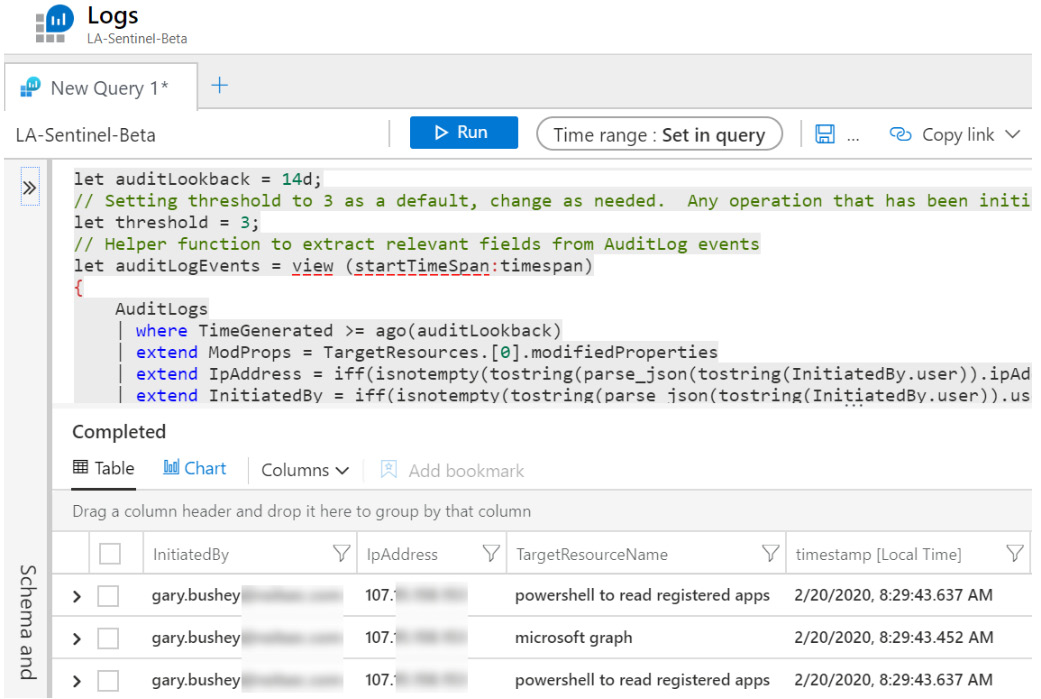
Figure 10.11 – Viewing query results
You may have noticed that there are checkboxes to the left of each result. To create a new bookmark, select one or more checkboxes. When at least one checkbox has been selected, the Add bookmark link will be enabled in the result's header bar.
When you click on Add bookmark, a new blade will open, as shown in the following screenshot (the actual title of the blade will be different if you select one checkbox from what it will be if you select multiple checkboxes):
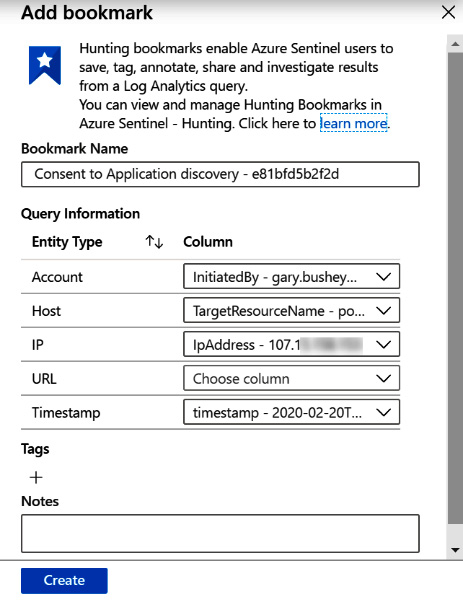
Figure 10.12 – Add bookmark blade
The Bookmark Name will be filled in with the name of the query followed by a random 12-digit hexadecimal number, so that if you create multiple bookmarks from the same query, they will each have a unique name. Below that is a list of all the available entities. If the query has any entities associated with it, those will be filled in.
Add any Tags and Notes that are needed. When adding Notes, make sure they provide enough information so that when you or someone else comes back to this bookmark, it will be easy to understand what is going on. Enter any Tags that will be useful to filter, to find the various bookmarks when needed.
Click Create to create the bookmark when all the fields have been filled in.
Note
If you select multiple checkboxes when creating a bookmark, the first bookmark created will follow the naming convention stated earlier. For the rest, a new bookmark will be created for each selected result, and the Name will have (x) appended to it, where x is the copy number of the bookmark. For example, if there are four checkboxes selected and the bookmark name was set to Test Bookmark – 123456789012, then the first bookmark will have that name; the second will be named Test Bookmark – 123456789012 (1); the third will be named Test Bookmark – 123456789012 (2); and the fourth will be named Test Bookmark – 123456789012 (3). This way, you can easily tell which bookmarks were created together.
It is very easy to add bookmarks when you are performing your queries. In the next section, we will discuss how to use them.
Viewing bookmarks
If you go back to the Hunting main page, you will see that there is a Bookmarks tab above the listing of all the queries. Clicking it will change the page to show the Bookmarks tab, as illustrated in the following screenshot:
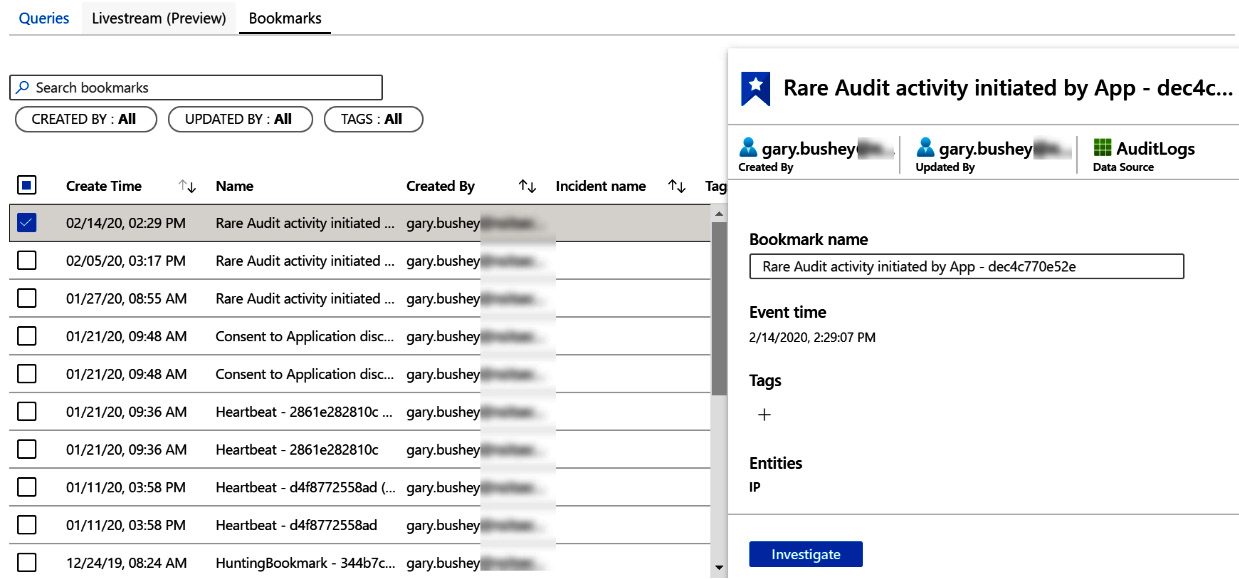
Figure 10.13 – Bookmarks tab
When a bookmark is selected, the details pane is opened on the right, showing more information about the bookmark, as illustrated in the following screenshot:
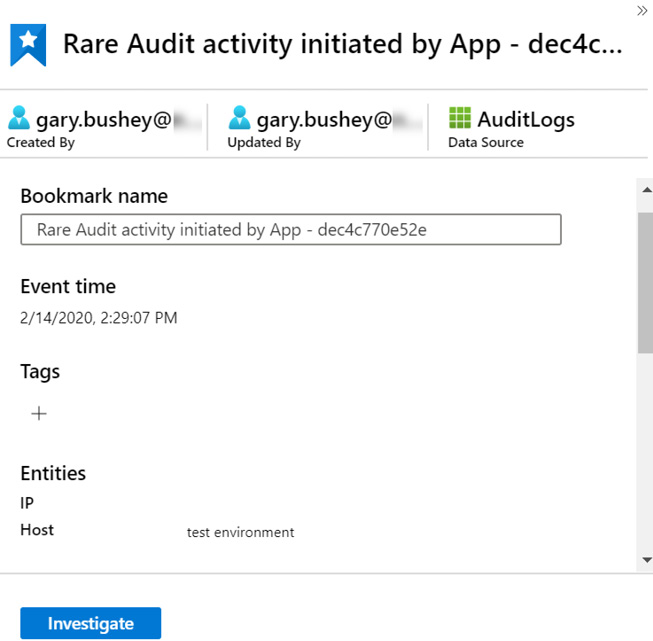
Figure 10.14 – Bookmark details pane
At the top of the page is the bookmark's name, and under that is who created it, who last updated it, and the data source used by the query that created the bookmark, or the first data source if there were multiple data sources.
Below that is another field that contains the bookmark name. This field is editable, so if you want to change the bookmark's name, you can make the changes here. Once you leave the field, the new change will be automatically applied.
Under that is the time the result was created, any tags associated with the bookmark, and also the entities that are associated with this bookmark.
Under that is the Query result row, which contains the values for all the columns displayed for the query result. You will need to scroll down to see all the fields. Directly under that is a link called View source query, which will allow you to view the source query itself. The text for this link is in a very small font, so it is easy to miss.
There is also the Notes section, where you can add any notes that you need to. This is an editable field, and any changes you make in this field will automatically be updated when you leave the field.
After that is the bookmark's internal ID, with a link to view the bookmark log for this query so that you can view the history of the bookmark. This will include items such as the creation of the bookmark, any changes to the bookmark's name, and when notes were added. Since there is nothing on the screen that tells you when notes were added or updated, this is a useful feature for determining when actions were performed against the bookmark.
Note
You may see a message stating “Investigation cannot be used to investigate this bookmark because some of the data related to this bookmark is no longer stored.” This can occur if the results that were stored in a bookmark have been deleted due to your data retention policy. Refer back to Chapter 2, Azure Monitor – Log Analytics, for information on setting your data retention policy.
At the bottom of the screen is the Investigate button, which will only be enabled if there is at least one entity with a value. Clicking the button will open the investigation screen, which was described in detail in Chapter 9, Incident Management.
There is one change to the Investigate screen; since you are working with bookmarks rather than incidents, the main icon will look as follows:
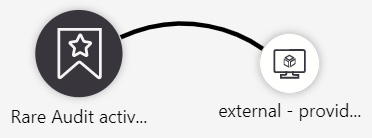
Figure 10.15 – Bookmark investigation
You now know how to view the bookmarks that you have created. You can get more details about them and see how to view the information using the Investigate button. Next, we will learn how to associate the bookmark with an incident.
Associating a bookmark with an incident
Bookmarks, by themselves, are not that useful. In order to be useful, they need to be associated with an incident, either a new incident or an existing one. This section will discuss the various ways to associate the bookmark with an incident.
No matter how you want to associate the bookmark with an incident, the first step is using the context menu. The context menu for each bookmark appears as follows:
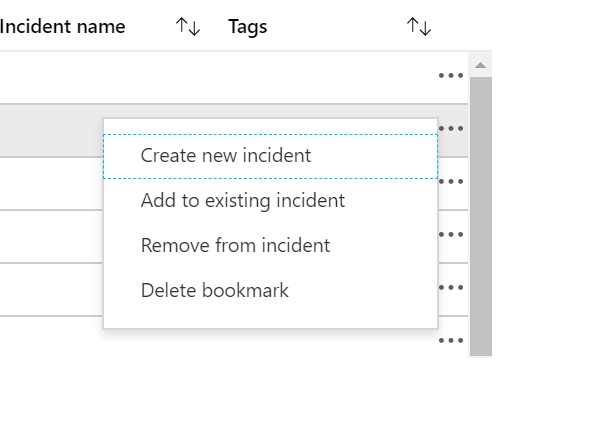
Figure 10.16 – Bookmark context menu
Let's now take a look at the different fields under the context menu in detail:
- If you select Create new incident, the new incident blade will open as follows. This will allow you to create a new incident based on the selected bookmark:
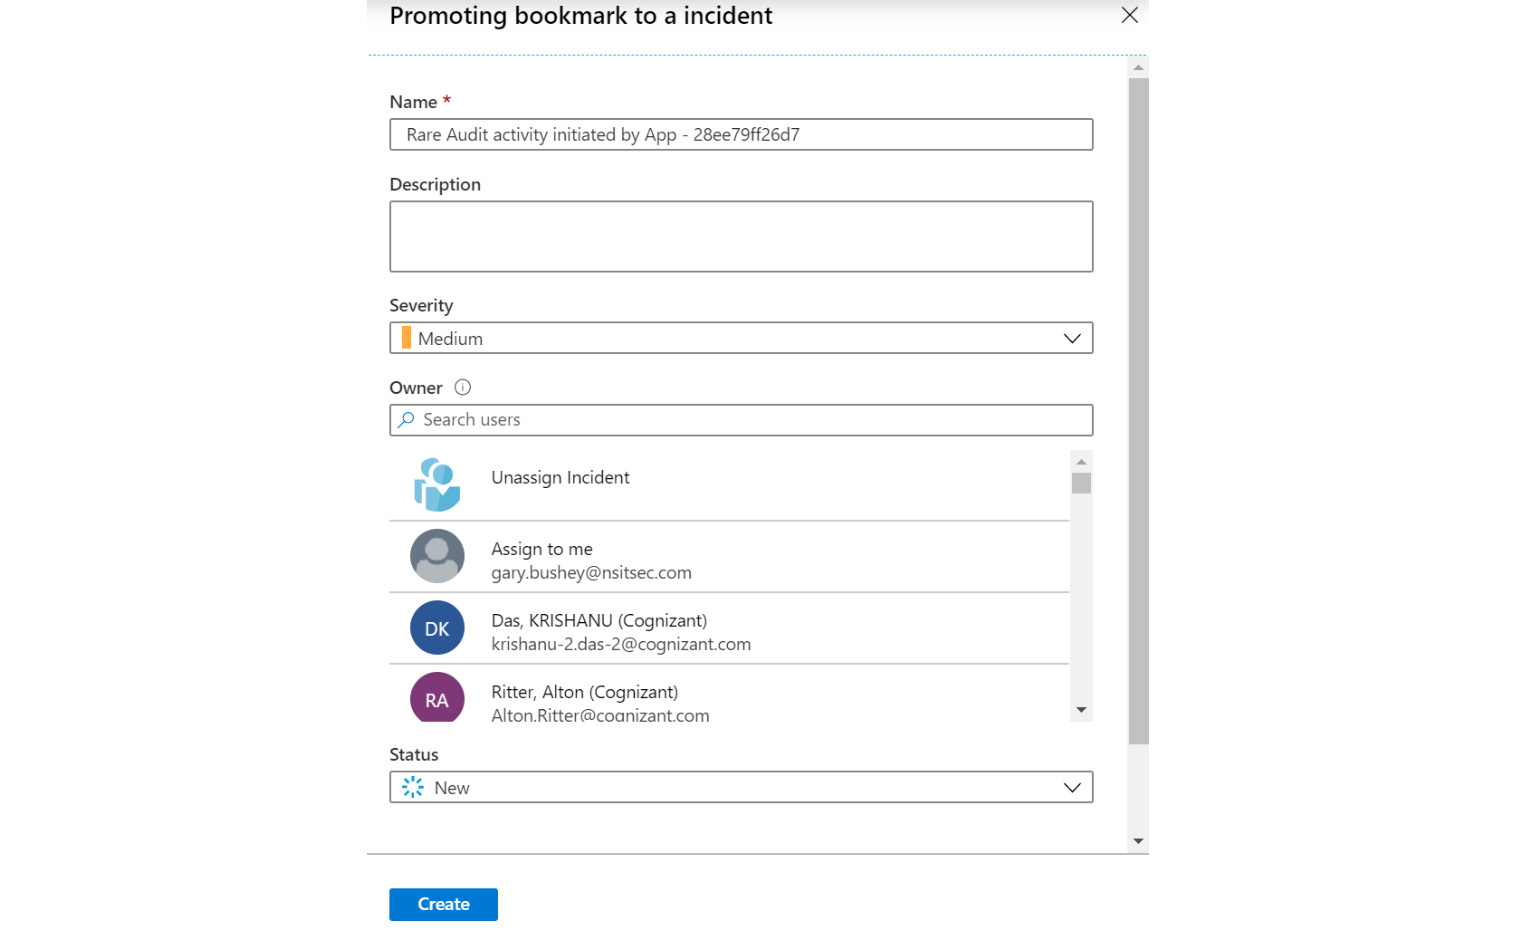
Figure 10.17 – Creating an incident from bookmark
These fields are the same as any other incident, so they will not be covered here. Refer to Chapter 9, Incident Management, for more information on incidents. Click Create to create a new incident from this bookmark.
- Clicking on Add to existing incident will open a new blade allowing you to choose one or more incidents with which to associate this bookmark, as shown in the following screenshot. Select the incident with which you wish to associate this bookmark, and then click Add:
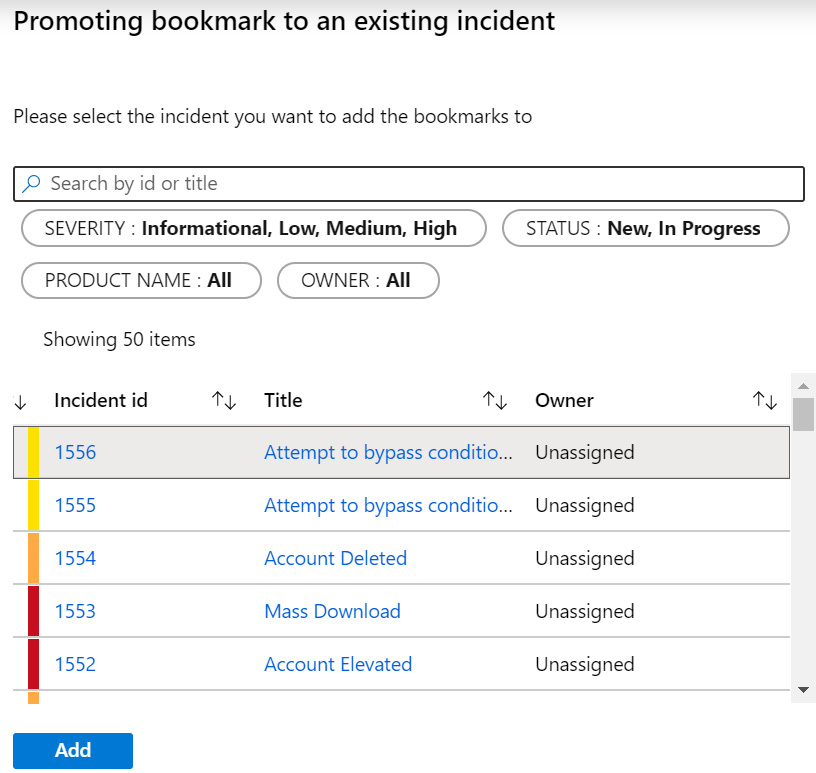
Figure 10.18 – Adding bookmark to an existing incident
- Clicking on Remove from incident will cause a pop-up box to show, asking you to verify that you do want to remove the bookmark from the incident. If you confirm the choice, the bookmark will be unassociated with the incident.
- Clicking on Delete bookmark will cause a pop-up box to show, asking you to verify that you do want to delete the bookmark. If you confirm the choice, the bookmark will be deleted.
That is all there is to the Azure Sentinel - Hunting page. As you have read, it is quite useful, with a large number of built-in queries, and the ability to add your own queries and add a bookmark of results in order to help the investigation.
However, there may be times when this is not enough. Perhaps you need information that is only available outside of Azure Sentinel, or you want to use a graph that is not part of Azure Sentinel. In cases like this, you can use Jupyter Notebooks, which is the topic of our next section.
Using Azure Sentinel Notebooks
Sometimes, just using KQL queries against logs does not give enough information to assist with properly performing hunting activities. In cases such as this, you can use Jupyter Notebooks, hosted in the Azure Notebooks service, to perform additional work. Jupyter Notebooks combine text with code and outputs to provide an overall view of your threat-hunting activities. The code can be written in Python, F#, and other languages, so threat hunters can work with a language they are most likely already familiar with.
Note
The full scope of Jupyter Notebooks is beyond the scope of this book. For more information, go to https://jupyter.org/.
Click on Notebooks in the Azure Sentinel navigation area to go to the Notebooks page, which will look like the following screenshot:
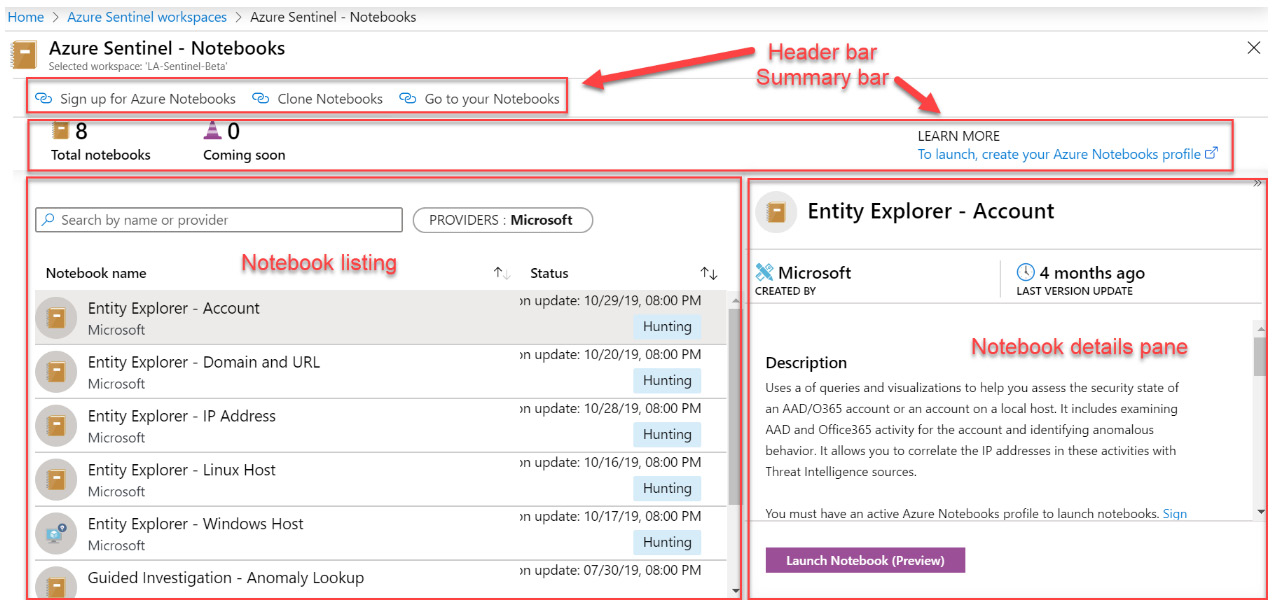
Figure 10.19 – Notebooks page overview
Each of the sections on this page is described in more detail in the following sections.
The header bar
The header bar allows you to work with the notebooks and is shown in the following screenshot:
Figure 10.20 – Notebooks' header bar
On the left side is a button allowing you to sign up for Azure Notebooks. Although the notebooks are hosted in Azure, you will need to sign up for this feature separately. This action will only need to be performed once. When you click on it, you will be taken to another page where you can sign up for this service.
To the right of that is the Clone Notebooks button. This will allow you to create a new project inside notebooks, with a copy of the existing notebooks that are stored in GitHub.
On the right of that is the Go to your Notebooks button, which will take you to your instance of Azure Notebooks.
The summary bar
The summary bar shows the number of existing notebooks, the number of any coming soon, and a link to learn more information about Azure Notebooks, as illustrated in the following screenshot:

Figure 10.21 – Notebooks' summary bar
This summary bar is useful to see whether there are any new notebooks that have been added to Azure Sentinel. You can view these new notebooks to see whether they may be something you can use.
The notebook list
Looking at the page, you will see that all the available Jupyter Notebook templates are shown. These notebooks are provided by the Azure Sentinel GitHub repository, maintained by Microsoft and updated regularly.
Note
While the majority of the Azure Sentinel information is stored in the Azure Sentinel GitHub repository, located at https://github.com/Azure/Azure-Sentinel, these notebooks are stored in the Azure Sentinel Notebook GitHub repository, located at https://github.com/Azure/Azure-Sentinel-Notebooks.
For each notebook, the name of the notebook will be shown with the authoring company underneath it. The last update time, as well as the type—either Hunting or Investigation—will be shown to the right.
The notebook details pane
Selecting a notebook will show the notebook details blade, as shown in the following screenshot. This will show the notebook's name at the top of the page. Under that is the name of the company that created it, and the last time it was updated.
Beneath that is the description of the notebook, which will tell you what the notebook is trying to find. Under that is the Required data types field, which refers to the Azure Sentinel logs that it will be querying. Below that is a listing of the data sources (not shown) that are used to populate the data types, and finally, one or more images pertaining to the notebooks:
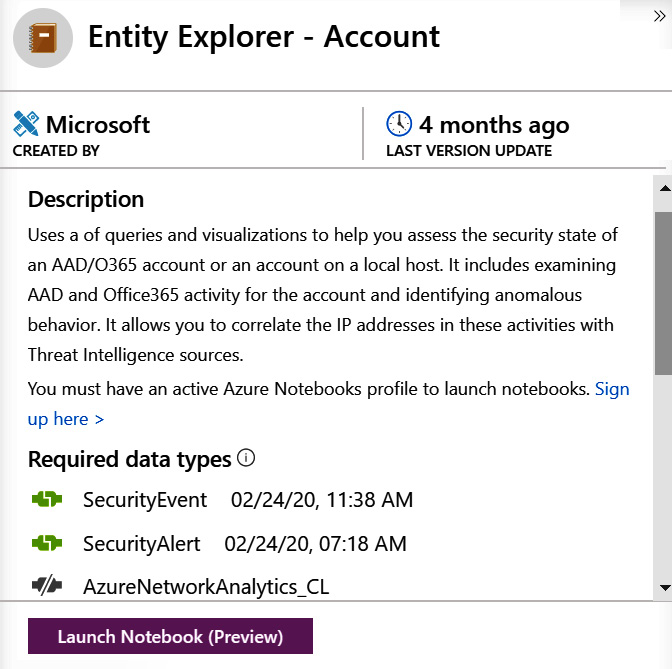
Figure 10.22 – Notebook details pane
At the bottom of this blade is the Launch Notebook (Preview) button. This will clone the selected notebook, even if you already have the same one present, and will then take you into the notebook.
It is recommended that you only use this button once or use the Clone Notebooks button in the header to create a copy of the notebooks. From that point on, click the Go to your Notebooks button in the header to access your notebooks.
Note
At the time this book was written, the button was called Launch Notebook (Preview). It is possible that when you are reading this chapter, the Notebook feature will be out of preview, and the button will be called Launch Notebook, or something similar to this.
As stated previously, the best way to get to your notebooks is to use the Go to your Notebooks button in the header. Clicking that will take you to a page similar to the following:
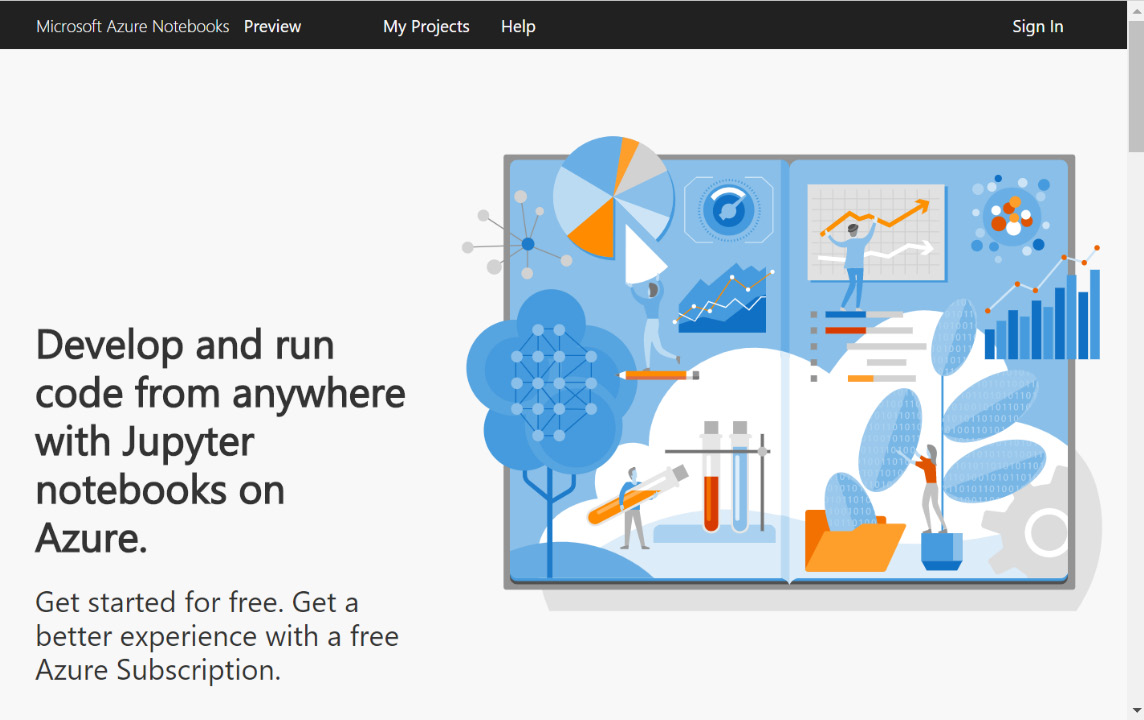
Figure 10.23 – Azure Notebooks home page
Click on the My Projects link in the header to continue. This will take you to the My Projects page, as shown in the following screenshot. This will vary depending on how many projects you have:
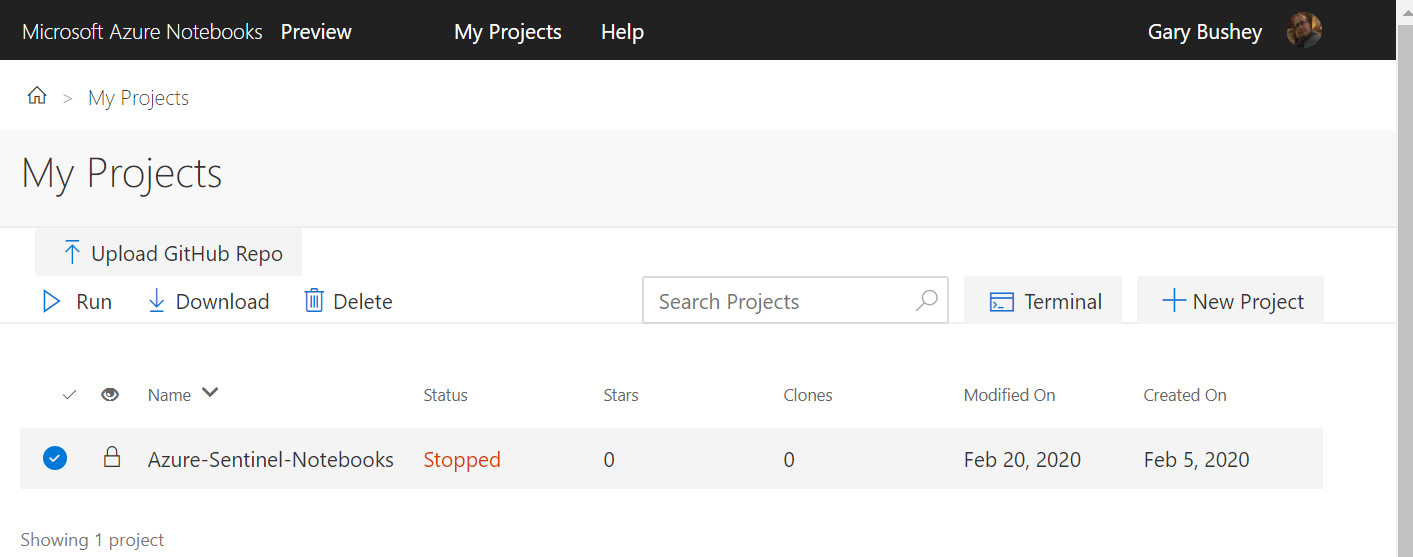
Figure 10.24 – My project page
From here, you can select your notebook and start working with it. The actual usage of the notebooks is outside the scope of this book.
Azure Notebooks will allow you to perform queries outside Azure Sentinel. They can incorporate text and code and can include data inside and external to Azure Sentinel. They can also make use of graphics packages that are not available to Azure Sentinel, to create graphs that you would not be able to create in Azure Sentinel.
Next, we will look at the mechanics of how to perform a threat hunt. This is going to focus on the tasks you will perform, and not on how to do it inside Azure Sentinel.
Performing a hunt
While there are no real set rules on how to run a hunt, there are some steps that you can take to focus your work: develop premise, determine data, plan hunt, execute investigation, respond, monitor, and improve.
As shown in the following diagram, this is a never-ending process. As new logs are added or new threats are recognized, this will be done over and over again. Even something as simple as checking for a malicious IP address will most likely be done many times and, based on previous findings, can be improved upon. You can find the logs that are most likely to contain the IP address and check those first, rather than blindly searching across all logs:
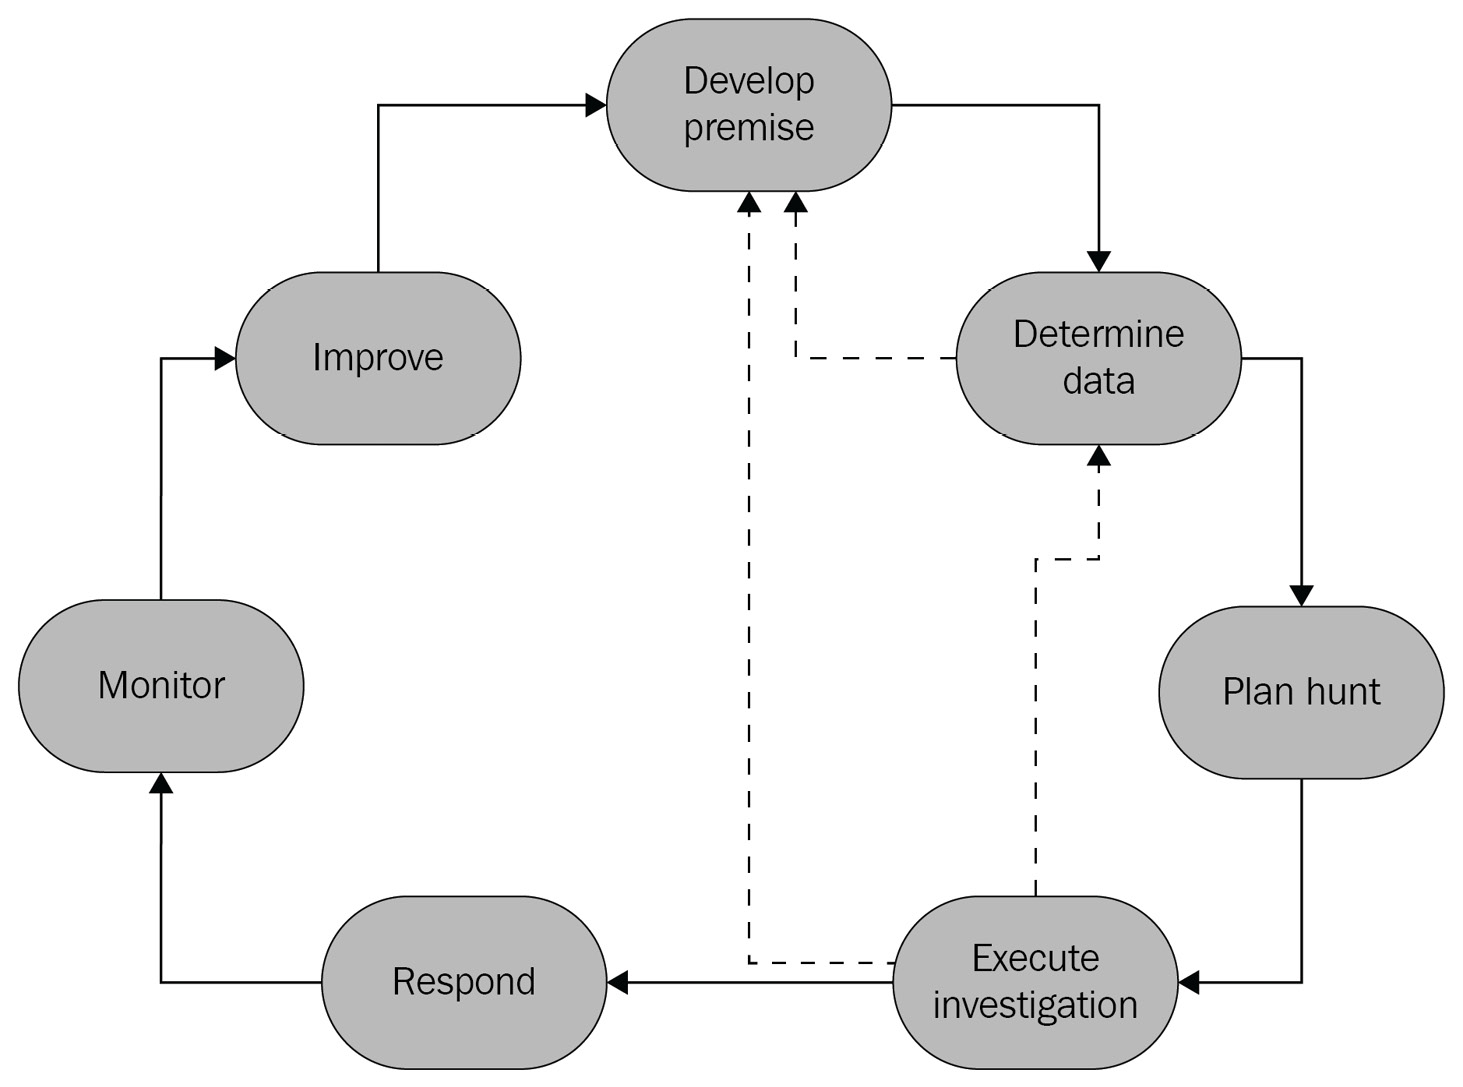
Figure 10.25 – Threat-hunting life cycle
As you can see from the preceding diagram, there are various steps to performing an investigation. Each step is described in further detail, next.
Develop premise
In this step, you need to determine what it is you are trying to find or prove. What is it you are trying to find out? Is it to determine whether a malicious IP address has been found in your environment? Did a new user account perform actions it should not have? Is someone from a foreign entity trying to gain access to your system?
When you develop a premise, you are specifying what it is you are trying to find. It may be that you are told what it is you are looking for, or it may be that you are looking for something that you think may have happened.
Determine data
In this step, you determine which data you need to start your investigation. Which data will you need to look at to work your hypotheses? Is it all in Log Analytics, or will it be found elsewhere? What do you already know about your environment and what do you need to learn?
It may be that during your investigation, you determine that there is additional information that you may need, so do not feel that you are locked into just the data you have acquired in this step.
You may also find that you do not have all the data needed to work on your premise. It may be that there is data you need that is not being logged, in which case you will need to see whether you can start gathering that information. In any event, if you cannot obtain the needed data, you may need to go back and revise your premise.
Once you start finding specific types of activities in the various logs you have, it will make sense to keep track of these to make it easier to find the data in the future. The following screenshot shows the beginning of one method to track information: using Microsoft Excel to keep track of the log name, the type of data being queried, and whether the data is found in the log. If the data is found, the name of the column holding the data is entered:
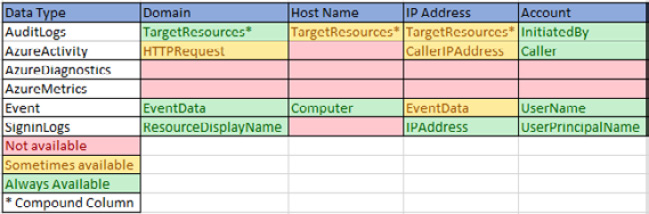
Figure 10.26 – Data field tracker
Notice that the TargetResources column is entered for multiple data types for the AuditLogs log type. This is due to this column being comprised of other fields, so the actual information will need to be extracted from it. This is designated by having an asterisk, *, at the end of the column name.
Another point to note is that your data diagram may be different from the one shown here, even for the same logs. This is due to the type of data coming in and what resources you have in your subscription. For instance, in the preceding Excel sheet data, the AzureMetrics row does not find any of the data types in question, but that may be due to not having any Azure resources saving their diagnostic information to this Log Analytics workspace.
Plan hunt
How will the hunt be performed? Can it all be done in Azure Sentinel or will you need a notebook?
In this step, you will look at the data you gathered from the previous step and determine how you need to access it. It may be that you can access all required data via Azure Sentinel queries; however, many times, you will need to look at additional information outside of Azure Sentinel, in which case you will need to use a notebook. You will also write the queries and additional code that may be needed, or use queries that were already written if those work.
Execute investigation
In this step, you will execute your queries that you obtained in the previous step, whether you wrote them or found ones that were already written that will work. You may be performing queries in Azure Sentinel as well as, or instead of, in a notebook. Wherever you run the queries, once you start looking at the results, you may find that you need to revise your premise or determine that you need more data, so you may need to go back to a previous step (refer to Figure 10.24).
Respond
Now that you have the information you need, you can respond to the results of the investigation. You may just have to plug the security gap you found, or you may need to escalate to another team and present what you found. This may be just your team or, in the event of a major breach, it could be the Chief Information Security Officer (CISO), Chief Information Officer (CIO), or even the board.
If the response is simple, such as blocking a port in a firewall or blocking an IP address range, most likely it is just a matter of notifying the appropriate people, updating the ticket, and moving on.
However, there will most likely be cases where you need to do a full presentation on your findings. This could be just to your team, but it could also be to a different audience. How you do the presentation is up to your company and its corporate culture; just keep thinking while you are doing your work Would this information be useful in a presentation? and think about how you would present it. A table of information may be enough when presenting to your team, but others who are not as familiar with the data may need graphs and charts.
At the very least, your findings and how you got to your results should be presented within your team if it is new information, so that everyone is kept up to date with the latest findings and can take the most appropriate actions.
Monitor
Develop new analytic queries if possible; otherwise, continue to periodically run the investigation to validate findings. Refer back to Chapter 7, Creating Analytic Rules, for a refresher on creating analytic queries.
In this step, you will determine how you can perform continuous monitoring to help safeguard against the situation you were investigating or improve the ability to investigate again next time. Can you add more information to the log? Is there a change in the operating procedures that can be performed to help avoid this situation in the future? Is there a change to your network that can be performed?
One of the best outcomes would be to create an analytics query so that this situation can be found automatically and perhaps handled via a playbook. Refer to Chapter 11, Creating Playbooks and Logic Apps, for more information on creating playbooks.
Improve
Based on any learnings that came from the investigation, improve the investigation code and techniques, if possible.
In this step, you— and most likely, others—will work to determine how to improve the queries used in this hunt, as well as how to avoid needing this hunt in the future. It may be that the queries you used could be rewritten to be more efficient; changes could be made to operating procedures to avoid the situation altogether; or other recommendations may be made based on the skills and experience of your team, partners, and domain-specific experts.
Those are the steps that can be taken to start your threat-hunting investigation. Again, none of these are set in stone, and the steps are only provided for guidance. You may find that your company has their own steps or that you want to add your own. The real take-away from this is that you should have a repeatable process that is always improving, enabling you to share your results at least with your co-workers and with the threat-hunting community at large, if allowed.
Summary
Now, you have learned about how to start doing threat hunting in Azure Sentinel. You learned about the Hunting page, the Notebooks page with its Jupyter notebooks, and got a brief introduction on how to perform a threat-hunting investigation.
We looked at the tools that Azure Sentinel provides to assist with threat hunting. This includes queries that only get run periodically, either due to factors such as needing to look for a specific piece of information, or the fact that they would return too many results to be useful on a scheduled basis.
Another tool that can be used is the hosted instances of Jupyter Notebooks. These notebooks allow you to combine text, code, and output into one location to make hunting easier and repeatable. In addition, notebooks can query not only Azure Sentinel logs but also third-party information through the use of programming languages, including F# and Python.
In the next chapter, we will look at using Azure Sentinel Playbooks to help automate reactions to incidents.
Questions
- How do I run a single hunting query?
- How do I run all the hunting queries at one time?
- How can I view the results of a single hunting query?
- How do I create a new bookmark?
- What are two ways in which I can associate a bookmark with an incident?
Further reading
You can refer to the following links for more information on topics covered in this chapter:
- Hunt for threats with Azure Sentinel ()
- Quickstart: Sign up and set a user ID for Azure Notebooks Preview (https://docs.microsoft.com/en-us/azure/notebooks/quickstart-sign-in-azure-notebooks)
- Security Investigation with Azure Sentinel and Jupyter Notebooks – Part 1 (https://techcommunity.microsoft.com/t5/azure-sentinel/security-investigation-with-azure-sentinel-and-jupyter-notebooks/ba-p/432921)
- Security Investigation with Azure Sentinel and Jupyter Notebooks – Part 2 (https://techcommunity.microsoft.com/t5/azure-sentinel/security-investigation-with-azure-sentinel-and-jupyter-notebooks/ba-p/483466)
- Security Investigation with Azure Sentinel and Jupyter Notebooks – Part 3 (https://techcommunity.microsoft.com/t5/azure-sentinel/security-investigation-with-azure-sentinel-and-jupyter-notebooks/ba-p/561413)