
Chapter 5
GENGHIS: an Environment for the Generation of Spatiotemporal Visualization Interfaces
5.1. Introduction
The integration of historical and temporal data in geographical information systems creates issues of methodological and technological natures. Creating spatiotemporal information systems (STIS) requires us to go through design, modeling, and implementation stages that require specific developments. These can be major and time-consuming developments, and even require the intervention of computer specialists. To this day, there are few IT platforms able to help a designer through the different stages of STIS development, from the modeling to the generation of the STIS, while taking into account the geovisualization interface specifications to be implemented.
The GENGHIS platform (Generator of Geographical and Historical Information Systems), developed by the STEAMER team of the Grenoble Computer Science Laboratory, aims to offer a solution to this issue. The goal is to offer a computer environment able to help the designer during the modeling and creation of an STIS which is adapted to his/her needs. GENGHIS is in line with an approach capitalizing on various research works that have been previously carried out by the STEAMER team on the design and creation of STIS devoted to the representation of spatiotemporal phenomena.
After describing the context in which GENGHIS has been developed (section 5.2), we will present its main functionalities (sections 5.3 and 5.4) as well as its architectural aspects (section 5.5) and then present its scope and specify the targeted user community (section 5.6).
5.2. Context
With the accumulation of data over time, the evolution of information collection processes, or the complexity of issues of social or environmental phenomena, spatial analysis increasingly requires the integration of the temporal or historical dimension in geographical information systems. GIS also cause us to wonder how to visually present and view the multidimensional data. This involves the development of information system applications devoted to spatiotemporal and historical information.
SPHERE and SIDIRA are projects supported by the European Union, the Rhône-Alpes region, the Grenoble center for natural risks (SIHREN) [DAV 06], and the Department for Environment, Energy, Sustainable Development, and the Sea (SIDIRA) and are in line with this line of reasoning. Both aim to design and develop an information system devoted to capitalizing and building on past catastrophic events as well as transmit them to different actors. These events, be they avalanches, landslides, floods, or earthquakes, can be broken down into a phenomenological description, a spatial description or location, a date, and a period or return cycle. Thus, the characteristics of the information manipulated in our projects linked to natural risk management led us to suggest tools able to take into account the different dimensions into which this information could be broken down. To be precise, two specialized applications were originally developed:
- – SPHERE: an information system devoted to using historical information on floods [DAV 04];
- – SIDIRA: an information system to disseminate avalanche risk information [DAV 03].
We will now present the specificities and appeal of the SPHERE and SIDIRA applications before showing the principles on which the GENGHIS tool is based.
5.2.1. The SPHERE and SIDIRA applications: two applications devoted to visualizing data linked to natural risks
The SPHERE [DAY 04] and SIDIRA [DAY 03] projects showed the necessity of having a tool for information system allowing us to easily cover all the data linked to past events through queries of a temporal (spontaneous data or data related to a specific period of time), spatial (data linked to a geographic entity), thematic (thematic attribute), or documentary (bibliographical, documents, photographies, etc.) nature.
The approach taken to design these tools relies on the principle of visualizing information through a multidimensional interface made of three interconnected frames. Figure 5.1 shows the interfaces developed for the SPHERE and SIDIRA projects.
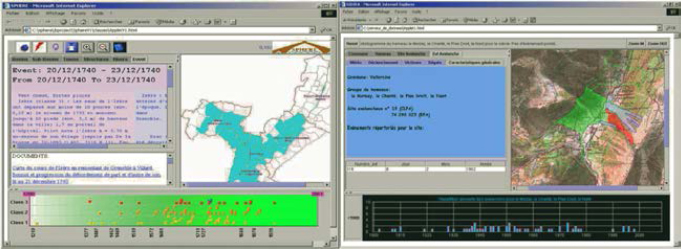
Figure 5.1. SPHERE and SIDIRA application interfaces
The interface offered is interactive, and allows the user to formulate visual queries with a mouse, for example, and see the result. Each action carried out by the user on one of the application frames then provokes two successive reactions from the system: (i) the query is interpreted and executed and (ii) the results are reflected on all the frames in a synchronized manner:
- – any spatial frame allowing us to visualize object spatial attributes (spatial extent, location, trajectory, etc.) through vectorial or raster maps and to carry out spatial queries;
- – any temporal frame allowing us to visualize object temporal attributes (dating, lifespan, etc.) through temporal diagrams and carry out temporal queries;
- – any attributary – or informational – frame allowing us to visualize object attributes through tables and charts, and carry out requests focusing on these elements. It also allows us to display available multimedia documents linked to the selected information as hyperlinks.
The multidimensional visualization concept offered through these experiments appeared as one of the strong characteristics of information systems since they must integrate data with spatial and temporal components. Indeed, this type of visualization to contextualize selected information by replacing it in spatial, temporal, or informational context, has to take its complexity into account. It thus appeared useful to generalize the principles on which the SPHERE and SIDIRA tools were built to other STIS-type applications. This led us to design a generic application allowing the user to design and develop his/her own geovisualization interface by means of models and specific tools.
5.2.2. GENGHIS: a generator of geovisualization applications devoted to multi-dimensional environmental data
We can define an STIS along two major characteristics:
- – the first linked to content management: the STIS design tools must offer support for spatiotemporal and attributary data modeling, management, and manipulation, without requiring programming efforts on the designers' part;
- – the second linked to presentation management: the STIS must allow for the display of spatial, temporal, or attributary data in a dynamic and interactive way, with multiscale and multidimensional navigation possibilities within the informational space of the STIS.
GENGHIS covers all the stages related to STIS development, i.e. modeling and integrating data into the STIS, as well as geovisualization interface modeling and generating. GENGHIS thus relies on two core principles:
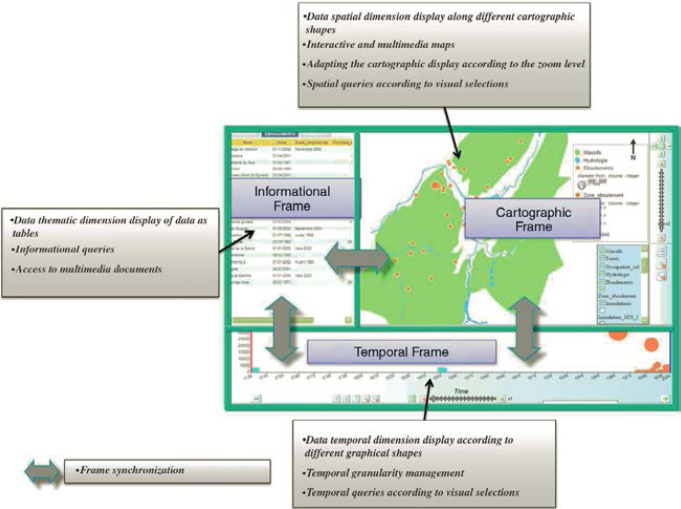
- – The first is linked to visualizing and viewing the data integrated into the application. GENGHIS has an interface generator, designed to automatically process, from a minimum configuration, the data integrated in the data model. The generated interfaces integrate the visualization and viewing principles developed in the specialized applications SPHERE and SIDIRA and mentioned again in Figure 5.2.
- – The second is linked to the selected modeling approach. It relies on the distinction between “data model” and “presentation model”, and on the use of AROM-ST, an object-oriented knowledge representation system, integrating spatiotemporal representation possibilities [MOI 07]. The presentation model and the data model are closely linked since each data model class is associated with a presentation model class (see section 5.3.3):
- - the data model describes, as classes and associations, the real-world objects belonging to the field of studies of the application to be generated, as well as the links between them. Each generated application relies on the definition of a model built from AROM-ST's spatiotemporal metamodel, described in Chapter 4.
- - we call “presentation” the way in which the spatiotemporal data are visually represented (graphically and cartographically). The presentation model describes, by means of classes and associations, the way spatiotemporal data of the application domain are to be displayed.
Thus GENGHIS allows us to generate a software application, enabling the user to, on the one hand, visualize multidimensional data contained in a knowledge base, and, on the other hand, query these data according to spatial, temporal, and thematic queries. To this end, two major functionalities are offered [GAY 09]:
- – those linked to the creation and generation of the specialized visualization application (section 5.3);
- – those linked to the specialized application use, that is the visualization and querying of spatiotemporal data (see section 5.4).
5.3. Functionalities linked to the generation of geovisualization applications
GENGHIS has an interface generator, designed to automatically process, from a minimum configuration, the data integrated in the data model.
5.3.1. Use cases for GENGHIS
Figure 5.3 describes use cases offered by GENGHIS when it comes to the generation process of a specialized visualization application. Three main stages make up the creation of a specialized application.
- – The first is instancing the data model on which the specialized application is based.
- – The second is instancing the presentation model by specifying the different elements that will structure the interface: defining the frames structuring the interface, the geographical and temporal layers matching the modeled entities, and the graphical styles linked to each layer.
- – The third stage is launching the application generation process.
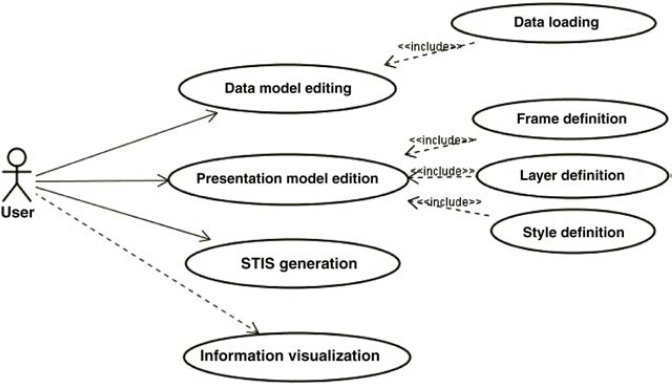
Figure 5.3. (Use cases) offered by GENGHIS
A wizard helps guide the user during the different stages of the application generation.
5.3.2. Instancing the data model and the knowledge base
This functionality allows us to instance the data model which must first be defined in AROM-ST, as well as to populate the knowledge base with objects (class instances) and tuples (association instances) describing the application field. These objects and tuples are created from external data files in XLS, MIF/MID, or shapefile format.
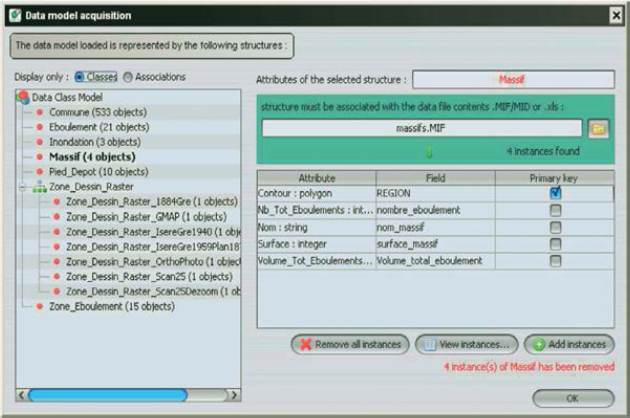
Figure 5.4. Graphical interface for the instantiation of the data model
The instantiation of the data model relies on a JAVA interface that works as a controller for an object-relational mapping (ORM). This ORM enables the conversion of stored data according to a relation paradigm – in which the identity of the entity is placed at the level of the attribute value (notion of “key”) – and an object paradigm – in which the identity of an entity is generated by the system (notion of object identifier). This prevents there being various entities with identical attribute values for the attributes making up the keys, for example. Figure 5.4 shows an example of mapping creation between the Massif class attributes and the field values placed in an MIF/MID file. We must specify the key for the MIF/MID files to avoid adding double entries in the knowledge base when going through multiple updates. We should also take into account the differences between the different STIS data models.
To update the knowledge base, we can add, delete, or modify the instances interactively.
5.3.3. Editing the presentation model
The goal is to allow the STIS designer to specify graphical elements representing each object of the data model (classes and instances), and to adapt the visualization interface organization to the issues in the application field.
Editing the presentation model means specifying, through a user interface, the different frames to be displayed (spatial, temporal, and attributary) as well as the graphical styles and semiology to be applied to the different geographical layers and temporal diagrams.
From a conceptual point of view, the presentation model is classified according to three types of elements organized in a relative hierarchy: styles, layers, and frames.
- – Styles are elementary graphical elements of final presentation that cannot be broken down into simpler elements. A style allows us to specify visual characteristics (color and line thickness, fill color, graphical stakeout, etc.) that the objects to be drawn must inherit. A style is tied to a layer.
- – A layer is tied to a data model class. A layer can be geographical or temporal. A layer is defined by the graphical elements and styles that match it.
- – Frames are higher level elements. A frame has one or more layers. It can be temporal, spatial, or attributary and has a set of specific functionalities related to its use (legend, layer management, zoom, etc.).
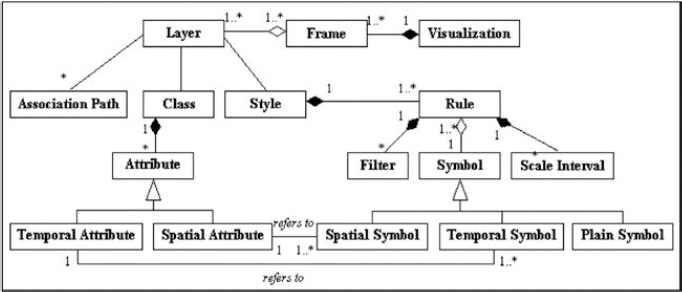
Figure 5.5. Simplified presentation model of GENGHIS [MOI 07]
The presentation model of GENGHIS takes up the styled layer descriptor (SLD; [OGC 02]) of the Open Geospatial Consortium (OGC) and expands it on various aspects. SLD is a presentation standard that allows us to describe style transformations (Style class in Figure 5.5) to be applied on data layers (Layer class). A data layer refers to a spatial object class (Class class in Figure 5.5, also called FeatureType in OGC terminology). A style is made up of a set of rules that allow us to describe the exact type of graphical symbols corresponding to each spatial object according to its attribute values (Filter class). For example, for a layer representing rivers whose graphical symbol is a blue line, a set of rules allows us to specify a different line thickness according to each river's flow. A rule can also specify the scale interval for which a set of objects contained on the map is visible.
The presentation model for GENGHIS expands the SLD standard on two aspects: (i) taking into account temporal and attributary presentation and not just spatial presentations; and (ii) taking into account dynamic elements of presentation to allow interactive presentations. GENGHIS allows us to define complex and multidimensional visualizations (Visualization class) containing various frames (Frame class) of a spatial, temporal, or attributary type, each frame displaying a certain number of layers (spatial, temporal, or attributary). New temporal (1D, Temporal Symbol class) and attributary (0D, Plain Symbol class) graphical symbol types were added to existing SLD types (2D, Spatial Symbol class).
To enable the dynamic and interactive presentation generation, GENGHIS's presentation model expands the notion of layer described in SLD by adding information concerning existing links between different object types (Association Path).
5.3.4. Generating the geovisualization interface
Generating the geovisualization interface does not require interaction and information exchange with the user. This stage happens automatically once the data and presentation models are instanced. This functionality operates as the following:
- – Generating SVG format files corresponding to the spatial and temporal frames specified during the presentation model edition; each file has a set of vector and/or raster layers and a legend describing the set of layers.
- – Generating XHTML format files corresponding to the informational frame and containing thematic data.
- – Generating specified layers; this generation happens by embedding the graphical elements, at the level of layers it creates the link between graphical elements and styles that they match.
- – Generating a generate folder containing all the files that make the application (see Figure 5.6).
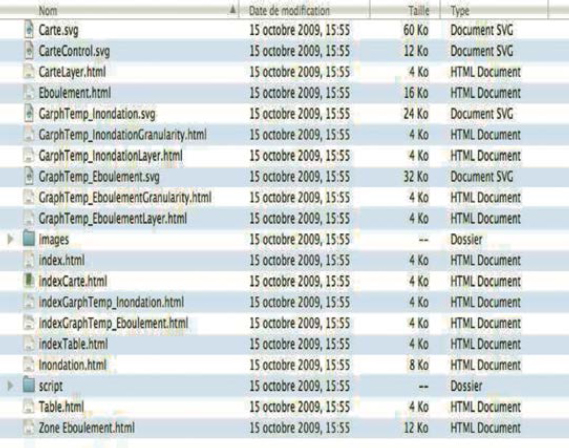
Figure 5.6. Set of HTML and SVG files generated and contained in the generate folder
The geovisualization interface is made operational by activating, due to an Internet navigator (Firefox, Internet Explorer, Opera, etc.), the index.html file contained in the generate folder of the application (see Figure 5.6).
5.4. Functionalities of the geovisualization application generated by GENGHIS
The application generated by GENGHIS is the software component which should allow us:
- – to display presentation files (SVG and XHTML files), and thus the visualization interface made of spatial, temporal, and informational frames, as well as of their content;
- – to carry out data querying and viewing functionalities;
- – to carry out navigation functionalities (zoom, pan, layer management);
- – to carry out synchronization functionalities between different frames.
Figure 5.7 shows an example of a generated geovisualization interface.
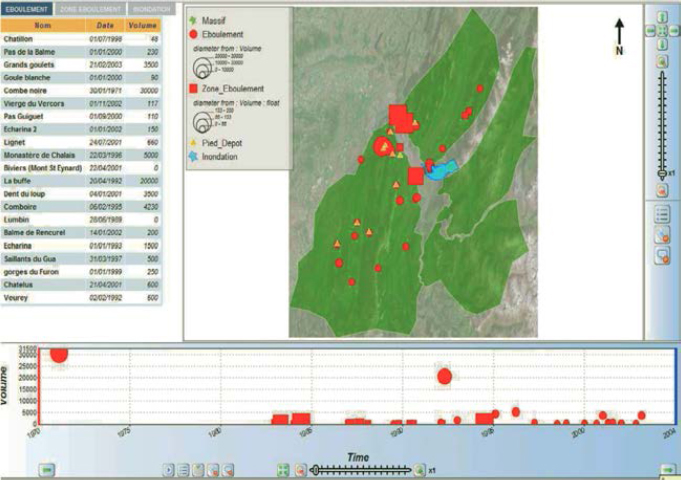
Figure 5.7. Example of a geovisualization interface generated in GENGHIS
The interfaces generated in GENGHIS integrate the visualization and viewing principles developed in the specialized applications SPHERE and SIDIRA. The data can be visualized through various synchronized frames, each representing a dimension of the manipulated information: a cartographic frame is devoted to the spatial dimension; a frame integrating the graphics represents the temporal dimension; and an informational frame visualizes the details of each entity contained in the information system as tables. These frames can also integrate a documentary module that allows us to access multimedia content about these entities (texts, images, and maps). Viewing is carried out as a visual request by clicking on the mouse. We will detail now the functionalities of the generated interface.
5.4.1. Spatial frame functionalities
The spatial frame (Figure 5.7) displays the interactive maps in an SVG format and offers different control components to ensure the following functionalities:
- – management and interactive and dynamic display of the different spatial layers;
- – interactive and dynamic management of the legend and tooltips;
- – zoom level and layer display management according to a zoom factor;
- – pan and relocation.
A visual selection on the map, carried out due to a click on the mouse, corresponds to queries of the following type:
- – What is the thematic information or data matching the selected spatial object?
- – In which period or at which date did the selected object happen?
The result of these queries is then simultaneously highlighted in the thematic and temporal frames.
5.4.2. Temporal frame functionalities
The temporal frame (Figure 5.8) is presented as a graph with a right-handed Cartesian coordinate system whose x-axis is a scale of time and y-axis is a qualitative or quantitative attribute defined by the designer during the data and presentation model creation. This frame offers different control components allowing us:
- – to display data on different levels of temporal granularity;
- – to select time intervals, thanks to sliders;
- – to dynamically and interactively manage the legend, time zoom, and tooltips;
- – to manage the temporal animations.
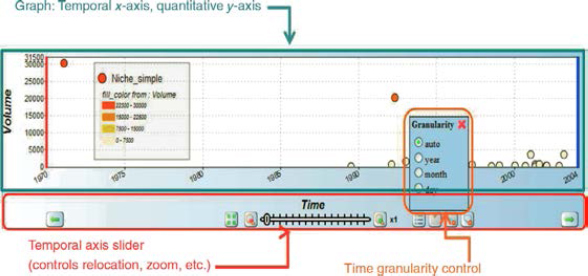
Figure 5.8. Temporal frame functionalities
A visual selection on the temporal diagram, carried out due to a click on the mouse, corresponds to queries of the following type:
- – What is the thematic information or data matching the objects (or phenomena), which happened at the selected date or during the selected period of time?
- – Where are the objects (or phenomena), which happened at the selected date or during the selected time lapse, situated?
The result of these queries is then simultaneously highlighted in the spatial and thematic frames.
5.4.3. Informational frame functionalities
The goal of the informational frame (Figure 5.9) is to display the thematic component of the manipulated information. It is displayed as a tab structure called tabs. Each tab matches a data model class and is presented as a data table representing class instances. The table columns correspond to the class attributes and instance lines themselves.
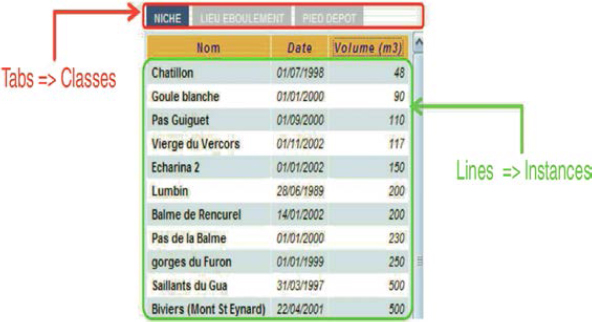
Figure 5.9. Informational frame
The attributary part is made of a master HTML document that realizes the tab structure. There is no HTML-specific tag to represent the tab component. An in-depth use of tags such as <li> (chip management), <div> (container management), <iFrame> (external file management), and css styles allows us to simulate tab behavior. Selecting a tab leads to the display of a different HTML document that describes the data table.
The visual selection, due to a click on the mouse on one of the table's lines, matches the following queries:
- – Where is the selected object?
- – When did the selected object happen?
The result of these queries then simultaneously highlights the matching objects in the spatial and temporal frames. We can display multimedia documents attached to the objects due to this frame. Figure 5.10 shows pictures characterizing a selected flood.
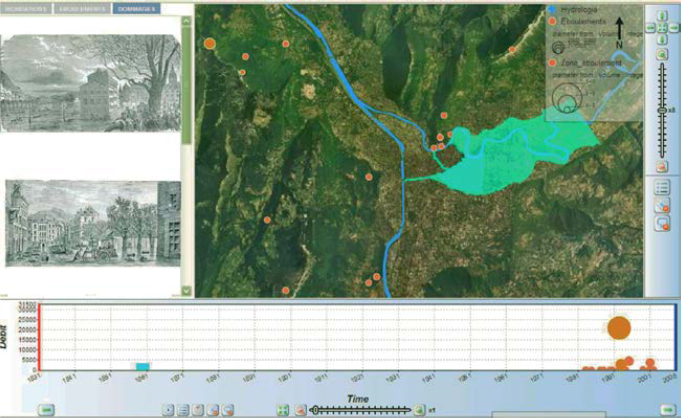
Figure 5.10. Informational frame functionalities
5.4.4. Interactivity and synchronization principles
The interaction manager is the component, on the one hand, managing the interaction with the user and, on the other hand, synchronizing the visual components. It interprets the user's actions and enables the navigation in the knowledge base informational space. Each user action is interpreted as a query on the knowledge base. The generic query is, in OQL [CLU 98], as follows:
Select O from C where SR and TR
- – O represents objects to be displayed in one of the frames of the application;
- – C represents the object class to be displayed;
- – SR and TR, respectively, represent spatial restrictions and temporal restrictions to be applied to the query.
Each action on the spatial frame modifies the spatial restriction applied to the query. The spatial restriction is defined by the spatial frame coordinates when nothing is selected or by the object's spatial extent when a spatial object has been selected.
Each action on the temporal frame modifies the temporal restriction applied to the query. The temporal restriction is defined by the temporal interval in the temporal frame when nothing is selected, or by the selected moment.
An action on one component determines an update for other components, as shown in Figure 5.11. For example, repositioning the spatial frame (panning) causes an update of the temporal frame, now displaying the events affecting the visible spatial entities. A zoom in on the time axis diminishes the number of events displayed in the informational and spatial frames.
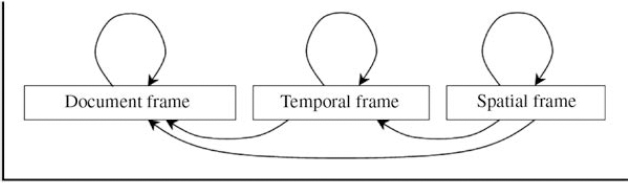
Figure 5.11. Component synchronization in GENGHIS
5.5. Architecture
On an architectural level, GENGHIS is made up of two distinct applications:
- – A “main” application, made of three modules, is in charge of the required different stages needed for the specialized STIS creation;
- – A light-client application, embedded in the STIS, to use the system created with an Internet navigator, and to view and visualize the data.
Figure 5.12 represents GENGHIS's architecture and the software building blocks used.
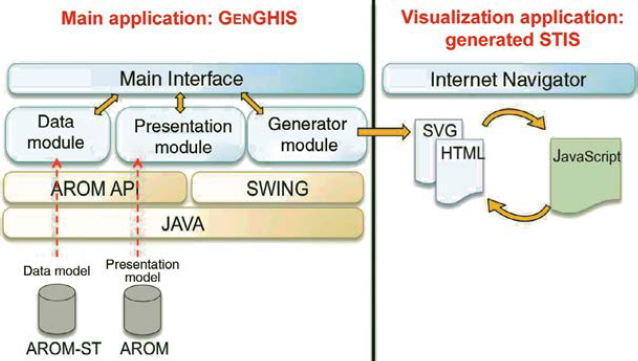
Figure 5.12. GENGHIS architecture
The main application is a thick-client application developed in JAVA with SWING-type graphical components. It is made of a main interface meant to guide the user through a succession of different stages, from the design to the generation of an STIS. To that end, three specific modules are offered, each covering the different stages of design:
- – one module is in charge of enriching the information in the data model;
- – one module enables the user to instance the presentation model consistently with the data model objects;
- – one module generates the STIS from the two previously created models. The generator module then builds a structure and classified set of files in HTML and SVG formats. The file data respect a precise tree structure so as to be used and modified by the second application.
The data are stored in the AROM-ST knowledge base. The Java interface ensures the editing and instantiation of the data and presentation models, and it is made of a JTREE graphical component allowing us to display as a tree structure, the different model elements (Figure 5.4).
The second application is made of a set of HTML/SVG files created by the first application, but also by JAVASCRIPT files. These script files are the applicative and dynamic part of the second application. We remind the reader here that SVG language was used to represent vector forms of graphical and cartographic components, while the HTML language was created for the informational frame display
5.6. Scope and user communities
5.6.1. Natural risks: a privileged scope
GENGHIS is an experimental platform that stems from research and is devoted to the management and viewing of spatially and temporally referenced data. Although it has not yet been released, it has however been involved in different projects focusing on natural risk assessment and management in Grenoble and its suburbs. These projects helped contribute to its development and improvement: SIHREN for the knowledge of past landslides and floods [ARN 09], SIRSEG for building on data linked to the assessment of earthquake risks [CAR 09], and MOVISS [BEC 09] for the spatiotemporal assessment of the social vulnerability versus earthquake risks. These projects are in line with a multidisciplinary approach and are based on the construction of a tool allowing us to gather, structure, organize, and visualize data linked to hazard and/or vulnerability characterization.
Each project required the conception of a data model based on AROM-ST's spatiotemporal meta-model, from which the designer could create his/her own knowledge base and geovisualization interface according to the data characteristics and goals that the final user had. We will now present two application examples.
5.6.1.1. The SIHREN application
The SIHREN project [DAV 06, ARN 09] is funded by the Rhône-Alpes region and the Grenoble center for natural risks. Its goal is to design and create an information system devoted to building on the characterization of data linked to flood and landslide phenomena that took place in the Grenoble region in the past. This project is carried out in partnership with the Lyon CEMAGREF, the LIRIGM (Grenoble), and the Acthys company. It is in line with the work started in SPHERE and SIDIRA and concerns similar data, which means it integrates a spatial, temporal, attributary, and documentary dimension.
The SIHREN application relies on the design of a “Natural Risk” data model (Figure 5.13) structured around the notion of an event (Event class). These events can be floods or landslides caused by the phenomena described in the Phenomenon class. These phenomena are considered to be natural manifestations (Manifestation class) and affect geographic entities (Geographic Entity). An event can damage different stakes (Stake class). Natural manifestation can be described through documentary content (Document class) for which the source has been identified (Source class).
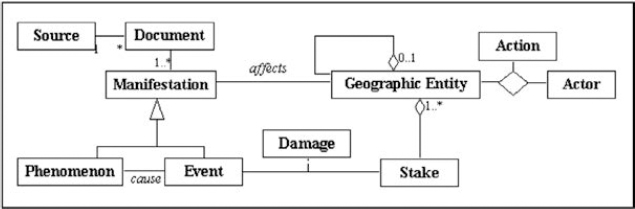
Figure 5.13. The “natural risk” model underpinning the SIHREN application
Once the data and presentation models are instanced and the knowledge bases specific to landslides and floods populated, the SIHREN application has been generated (see Figure 5.14).
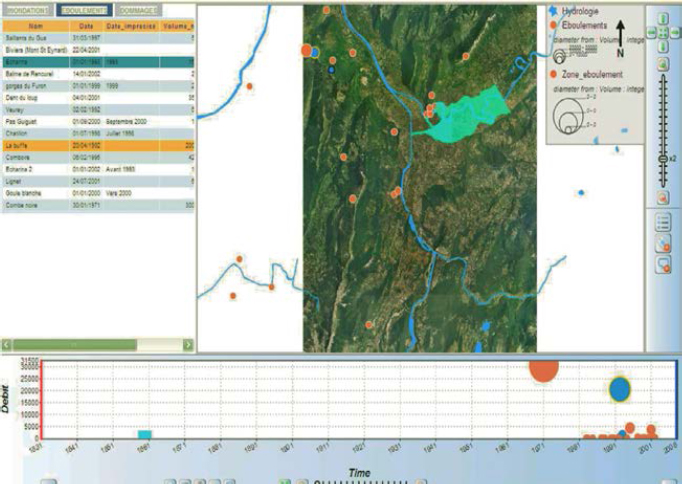
Figure 5.14. Geovisualization interface of the SIHREN application generated with GENGHIS
5.6.1.2. The MOVISS application
The MOVISS project [BEC 10] focuses on the implementation of methods and tools to assess a town's social vulnerability by taking into account the mobility of individuals during the daytime. The goal was to have a tool allowing us to build scenarios to diminish social vulnerability by causing the different variables that have an influence on the social vulnerability index (SVI) [BEC 09] to fluctuate.
In MOVISS [BEC 10], the data used are relatively homogeneous and structured: it is attributary data defined along a unique geographic grid (the neighborhood) and a temporal granularity corresponding to periods: morning, noon, and evening. For each geographic entity and each temporal period, a vulnerability index is calculated based on different indicators, such as knowledge, perception, and information levels. All these levels are weighted. The indicators are themselves defined through statistic processing carried out on data from sociological surveys. The variation in the value of these indicators, as well as the variation in weight, influences the SVI value and thus the spatiotemporal distribution of social vulnerability.
After defining the adequate data model, we have designed through GENGHIS an application allowing us to visualize SVI and its linked indicators spatiotemporally. The spatiotemporal analysis carried out in MOVISS requires us to have an interface allowing for the visualization of data depending on the three study periods (morning, noon, and evening) simultaneously, to identify spatial differentiations for each studied period as well as temporal differentiations for each geographic entity. This entails a double-entry cartographic reading relying on the principle of map collection. Thus the geovisualization application developed in GENGHIS is structured into four frames (see Figure 5.15):
- – an information frame displaying for each geographic entity, in a table, the value of the vulnerability indexes and the associated indicators depending on the three periods studied (morning, noon, and evening);
- – three spatial frames matching each of the temporal periods that display simultaneously as a choroplete maps, the spatial distribution of the Grenoble neighborhoods' SVI or associated indicators. These frames have the viewing functionalities offered by GENGHIS (zoom, pan, layer management, etc.); they are interconnected and synchronized among themselves, allowing for dynamic and interactive viewing of the data.
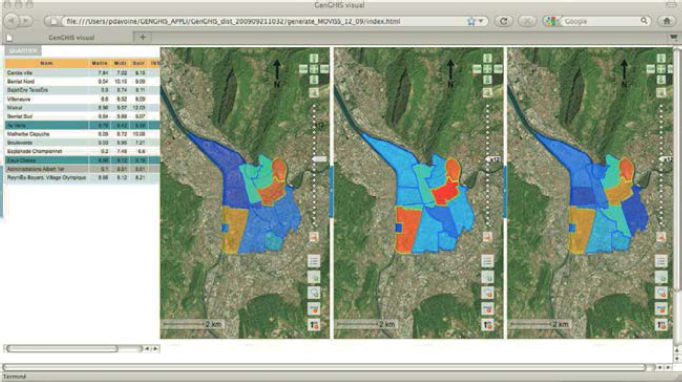
Figure 5.15. MOVISS application interface generated by GENGHIS
Given the type of temporality characterizing MOVISS's data, using the temporal frame as it is initially suggested by the GENGHIS environment is not necessary
As for building vulnerability diminishing scenarios, we have integrated a new functionality allowing the user to interactively modify the indicator values, whether they are the SVI itself or indicators influencing the SVI (see Figure 5.16). Owing to the MOVISS application, we have been able to generate a tool that genuinely helps decision making.
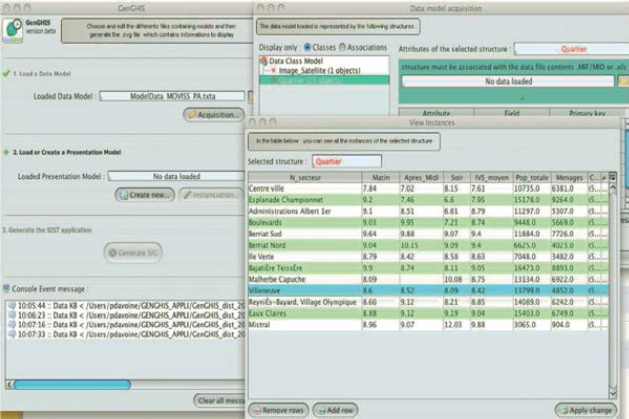
Figure 5.16. Typing interface allowing us to run vulnerability scenarios for the MOVISS application
5.6.2. User community
Originally stemming from issues in managing data linked to natural risks and more specifically data linked to past catastrophic event characterization, the GENGHIS platform appeals to users with a heterogeneous spatiotemporal or spatio-historical geographical information that also has a multimedia dimension. This is notably the case for geoscience communities (seismologists, geologists, hydrologists, etc.) that use a great amount of multidimensional environmental data as well as all the communities managing georeferenced historical information (geographers, historians, etc.).
GENGHIS is suited for the development of applications allowing us to take into account orthogonally spatial, temporal, documentary, and informational dimensions. It appears that this approach is useful to understand and analyze environmental phenomena which are often based on the use of heterogeneous spatiotemporal or spatiohistorical information integrating a multimedia dimension. GENGHIS can thus appeal to the geoscience community (seismologists, geologists, hydrologists, etc.) that uses a lot of multidimensional environmental data, as well as for geographers or historians managing georeferenced historical information.
GENGHIS is developed by computer specialists for non-computer specialists. The final users are currently mostly researchers, but in the long run this tool must also be aimed at managers. However, its use requires sound knowledge of the modeling tool and processes, especially in AROM-ST. Indeed, the design of the data model is not directly done by GENGHIS and knowledge of the modeling process in AROM and AROM-ST is required.
GENGHIS's development was mainly carried out by engineering students at the CNAM (French National Conservatory of Arts and Crafts) and by computer science students at master level. The approach chosen by the GENGHIS environment also raises graphical semiology and cartographic representation issues, so the duty of specifying these aspects, and notably spatiotemporally visualizing information, is given over to geographers.
5.7. Conclusion and perspectives
Recent technological breakthroughs have considerably increased the need for geovisualization tools that allow us to use heterogeneous and multimedia data referenced both in time and space. The development of a computing environment such as GENGHIS falls within the parameters of this need to help create geovisualization applications that are suited to users' needs and manipulated data characteristics. GENGHIS was presented in 2009 at the International Festival of Geography of Saint-Dié des Vosges [DAV 09]. Members of the geovisualization competition acknowledged that it was a very promising tool opening many application perspectives in the field of the environment as well as that of territory management. Simultaneous visualization of different dimensions of the manipulated information, interactivity and dynamic synchronization of the frames, as well as the modeling approach underpinning the GENGHIS application, enables us to build a geovisualization interface that responds to the needs of a user community for which classical GIS are too complex and not always well suited. However, this tool does have limits and still requires many functionalities to be developed. It is therefore the focus of many research and development perspectives, in the field of modeling and spatiotemporal knowledge representation as well as geovisualization. Among these we can mention a few: integrating the diversity of temporalities, the notion of quality, and even of uncertainty in geographical data; adapting graphical semiology and cartography to the user diversity; integrating rules for cartographic design; integrating modules to help design geovisualization interfaces.
Within the current ANR projects, other GENGHIS applications are considered (the URBASIS project of the RiskNat ANR or the Biblindex project studying spatiotemporal dissemination of biblical texts), opening up new opportunities to develop innovative functionalities that can be pooled.
5.8. Acknowledgments
The development of GENGHIS was carried out thanks to the funding of the regional council of Isère (through the Grenoble center for natural risks), the Rhône-Alpes region, the Joseph Fourier university, and the Department for Environment, Energy, Sustainable Development and the Sea. These development were carried out thanks to different projects funded by the ANR (Urbasis project of the RiskNat ANR, Biblindex project of the ANR Programme Blanc) and by the “Environment” cluster of the Rhône-Alpes region (PercuRisk project).
We would also like to thank researchers and partners of all these projects who took part in GENGHIS's specifications (PACTE-Territoires laboratory, LIRIGM, LGIT, LEPPI, CEMAGREF, PGRN, Acthys Diffusion, the city of Grenoble, and the urban community of Grenoble-Alpes Métropole), as well as the students, interns, and engineers who contributed to the development of the different versions of the software.
5.9. Bibliography
[ARN 09] ARNAUD A., Valorisation de l'information dédiée aux événements de territoires à risque. Une application sur la couronne grenobloise, PhD thesis, University Joseph Fourier, Grenoble, 2009.
[BEC 09] BECK E., ANDRÉ-POYAUD I., CHARDONNEL S., DAVOINE P.-A., LUTOFF C., “Spatio-temporal variations in the vulnerability to earthquakes in Grenoble (France)”, 16th European Colloquium on Quantitative and Theoretical Geography, Maynooth, Ireland, 2009.
[BEC 10] BECK E., ANDRÉ-POYAUD I., CHARDONNEL S., DAVOINE P.-A., LUTOFF C., MOVISS: Méthodes et Outils pour l'évaluation de la VulnérabIlité Sociale aux Séismes, final report, programme du pôle grenoblois des risques naturels, 2010.
[CAR 09] CARTIER S., BECK E., BOUDIS M., CORNOU C., DAVOINE P.-A., GUEGUEN P., SAILLARD Y., SIRSEG: Simulation du risque sismique et de ses enjeux à Grenoble, rapport final, programme de recherche “Risque – Décision – Territoire” du MEEDDM, 2009.
[CLU 98] CLUET S., “Designing OQL: allowing objects to be queried”, Information Systems, vol. 23, no. 5, pp. 279–305, 1998.
[DAV 03] DAVOINE P.-A., BRUNET R., “SIDIRA: un système d'information basé sur le Web dédié à la consultation des événements avalanches: application à la commune de Vallorcine”, SIRNAT 2003, Orléans, France, January 2003.
[DAV 04] DAVOINE P.-A., MARTIN H., CŒ-IUR D., “Historical flood data base linked to a web-based interface”, Sytematic, Palaeoflood and Historical Data for the Improvement of Flood Risk Estimation (SPHERE), Methodological Guidelines, CSIC Madrid, Spain, pp. 95–101, 2004.
[DAV 06] DAVOINE P.-A., MOISUC B., GENSEL J., MARTIN H., “SIHREN: conception de systèmes d'information spatio-temporelle dédiés aux risques naturels”, Revue Internationale de Géomatique, vol. 16, nos. 3–4, pp. 377–394, 2006.
[DAV 09] DAVOINE P.-A., MOISUC B., GENSEL J., ARNAUD A., “GenGHIS: environnement pour le développement d'applications de géovisualisation à données géo-référencées multidimensionnelles”, Festival International de Géographie de Saint-Dié des Vosges, Salon de la Géomatique, Concours de Géovisualisation, October 2009.
[GAY 09] GAYET L., Réingénierie d'un générateur d'applications de système d'information spatio-temporelle: GenGHIS, mémoire d'ingénieur, CNAM Grenoble, 2009.
[MOI 07] MOISUC B., Conception et mise en œuvre de systèmes d'informations spatio-temporels adaptatifs: le framework ACTIS, PhD thesis, University Joseph Fourier, Grenoble, 2007.
[OGC 02] Open Geospatial Consortium, Styled Layer Descriptor Implementation Specification, version 1.0.0, 2002.
Chapter written by Paule-Annick DAVOINE, Bogdan MOISUC and Jérôme GENSEL.