
 15.
15.
DOES GROWTH
DESTROY THE
ENVIRONMENT?
On 17 March 1722 three Dutch ships sailed out from the Juan Fernández Islands west of the Chilean coast. They were on a mission to find a large area of land called Davis’ Land after the English buccaneer Edward Davis, who had allegedly spotted this land in 1687. Over the subsequent 19 days, the three Dutch ships sailed almost due West toward the unknown.
On April 5, they saw a small island in the distance, and as they approached, a strange sight met them: the island was teeming with hundreds of virtually-identical sculptures, typically four metres high. The ships now dropped anchor, and the expedition’s leader, Admiral Jacob Roggeveen, named their discovery “Easter Island”. For precautionary reasons, no one went ashore.
The next morning, they saw smoke rising from different places on the island, but the Dutch opted to stay on their ships while they continued to observe the island.262
On the third day, the weather was mixed, with scattered thunderstorms, lightning and rain, and the sailors were still biding their time when they suddenly spotted a small kayak, containing a solitary man, rowing towards them. As this arrived, the sailors welcomed him and offered him something to eat and a glass of wine, which, to their amazement, he poured over his head. He progressed through the whole ship with great curiosity. Then he left.
On the fourth day, the same man returned with his kayak, and later that day, 134 heavily-armed Dutchmen boarded five smaller vessels and headed ashore. After a while, the locals appeared and soon gathered around them and as some of the locals wanted to touch the Dutch sailors and their weapons, a few of the latter panicked, and they shot 13 locals. Shortly after this event, the Dutch left the island and sailed on.
What a bizarre experience this must have been for the locals, especially because they apparently had thought, until the Dutchmen arrived, that they were the only people in the world. And it must have been stranger still that no-one else visited them for another 48 years after they had been discovered. But then came Spaniard Don Felipe González de Haedo with two ships, and he immediately drafted a document which stated that the island now belonged to the Spanish crown.263 After this visit, only four years passed until 1774, when another expedition passed by, this time led by the famous English explorer James Cook. As his men went ashore in search of fresh water and food, they found surprisingly little of either, and quickly left again.
So it continued. As time passed, more and more European expeditions passed by the small island, and they had this in common: they did not reflect very deeply on what they found there, other than making the observation that it seemed very poor and barren. In 1786 came a French expedition led by J F G de la Perouse, and since he had heard about the poverty beforehand, he brought the islanders sheep, goats, pigs and a variety of crops such as vegetables and citrus, so they could begin farming and have a better quality life. However, later expeditions did not find any traces of these; the natives had apparently just eaten everything brought to them.
No, this was a rather miserable place, and as James Cook had previously written in his logbook: “No Nation will ever contend for the honour of the discovery of Easter Island as there is hardly an Island in this sea which affords less refreshments, and conveniences for Shipping than it does.”264
It was only much later that scientists learned the tragic story that had played out on Easter Island - or Rapa Nui, as it is known locally. When settlers had originally arrived on the island, it had had a rich vegetation of trees, of which at least three species could grow to more than 15 metres in height. No fewer than 21 species had later become extinct, so the only remaining tree vegetation when Europeans first found the island were a few trees of about three metres high.
Because of the loss of large trees soil erosion had occurred. Excavations revealed how the natives had fought this by planting seeds in caves where there were openings in the ceiling, just as they had put stones on top of the soil after planting to prevent the seeds or plants from blowing away.
As the big trees had disappeared, it had also become more difficult to make sizeable boats, and the islanders’ diet had changed from predominantly fish to birds, which had led to yet another environmental disaster, because this led to the eradication of all land-based bird species, and the population of seabirds was decimated. In fact, the islanders had destroyed in the region of half of the original species. To complete the disaster, the deforestation had exposed the natives to water shortages.
The consequences were terrible, and islanders had begun to produce art showing people with distinct ribs and sunken stomachs, suggesting that they were starving. This had probably contributed to violent wars between the clans, in which most sculptures had been toppled. There were even signs of cannibalism.
For all these reasons, the population had fallen from some 15,000-30,000 a hundred years before the arrival of Europeans to the approximately 2,000- 3,000 when the island was discovered in the 1700s - a population that Europeans then reduced further by infecting the natives with new diseases and taking many of the survivors as slaves.
This is a horrible story and it is no wonder that Easter Island now is perhaps the strongest symbol of how human civilization can destroy the environment and thereby itself. Imagine if we did the same with the entire globe?
In his book Collapse, the aforementioned author Jared Diamond described this and other examples of how earlier cultures have destroyed their environment and then collapsed. These stand as a clear warning to modern civilizations, and Diamond described the Easter Island tragedy as follows:
“I have often asked myself ‘What did the Easter Islander who cut down the last palm tree say while he was doing it?’ Like modern loggers, did he shout ‘Jobs, not trees!’or: ‘Technology will solve our problems, never fear, we’ll find a substitute for wood?’ ”265
People destroyed the trees to use them to transport their giant sculptures to their destinations, explained Diamond, and it led to a chain reaction of problems culminating in the natives eating one another out of desperation. He explained the analogy to the rest of the world as follows:
“The parallels between Easter Island and the whole modern world are chillingly obvious. Thanks to globalisation, international trade, jet planes, and the internet, all countries on Earth today share resources and affect each other, just as did Easter’s dozen clans.”
He therefore concluded that the Easter Island’s downfall constituted a flashing warning light for the wider world:
“Those are the reasons why people see the collapse of Easter Island society as a metaphor, a worst-case scenario, for what may lie ahead of us in our own future.”
It is stories of these kind that contribute to a widespread fear that Western civilization will do irreparable damage to the planet if it keeps growing and developing its technologies. But, as we shall see, in the following section, there is something about this narrative that is a bit... odd.
Environmental concerns similar to those expressed by Diamond are not a new phenomenon. In her book Silent Spring, published in 1962, marine biologist Rachel Carson predicted that the use of pesticide DDT would cause an enormous increase in cancers:
“In the spring of 1961 an epidemic of liver cancer appeared among rainbow trout in many federal, state, and private hatcheries. Trout in both eastern and western parts of the US were affected; in some areas practically 100 per cent of the trout over three years of age developed cancer (...) Dr. Hueper has described this epidemic as a serious warning that greatly increased attention must be given to controlling the number and variety of environmental carcinogens. ‘If such preventive measures are not taken,’ says Dr. Hueper, ‘the stage will be set at a progressive rate for the future occurrence of a similar disaster to the human population.’ ”266
So the scene was apparently set for cancer to afflict close to 100% of the human population.
However, the human species was not the only one in danger. In 1970, the former senator and governor, Gaylord Nelson, founded the annual environmental event Earth Day, and in this connection, he gave an interview to Look Magazine, where he referred to the ornithologist Dillon Ripley as having predicted that between 75% and 85% of all species on Earth would be wiped out by 1995.
In 1979, ecologist Norman Myers published The Sinking Ark, in which he pointed out that if we lost some 2% of the world’s forest land each year - as he expected and feared - we would lose about 40,000 species annually, which meant that 50% of the world’s species would be gone by 2000.267
The following year, the biologist Thomas Lovejoy from Mason University submitted a report to the then US president, Jimmy Carter, containing the following scientific assessment:
“What then is a reasonable estimate of global extinctions by 2000? In the low deforestation case, approximately 15 per cent of the planet’s species can be expected to be lost. In the high deforestation case, perhaps as much as 20 per cent will be lost. This means that of 3-10 million species now present on the Earth, at least 500,000 – 600,000, will be extinguished during the next two decades.”268
The source of this estimate was Myers’ report from the year before, and in which you can read a complete description of his scientific approach:
“In 1974 a gathering of scientists concerned with the problem hazarded a guess that the overall extinction rate among all species, whether known to science or not, could now have reached 100 species per year. Let us suppose that, as a consequence of this man-handling of natural environments, the final one-quarter of this century witnesses the elimination of one million species - a far from unlikely prospect. This would work out, during the course of 25 years, at an average extinction rate of 40,000 species per year, or rather over 100 species per day.”269
This estimate of 40,000 extinct species annually is among the most-cited by environmentalists ever since, but as shown, it is just a wild guess with no evidence behind it whatsoever.
Lovejoy estimated a loss of 25,000-30,000 species per year, which was somewhat lower than Myers. Some years later, in 1988, botanist Peter Raven came forward with a third estimate, which claimed that 25 % of all species would become extinct between 1980 and 2015.270 Four years after that, biologist E.O. Wilson published his global bestseller The Diversity of Life, in which he estimated that we lost between 27,000 and 100,000 species a year. The following year, Paul Ehrlich joined the debate by making his own estimate, and he did not disappoint his enthuisiastic followers. He believed that, if, at that time we lost 250,000 species a year, half of all species would be gone by 2000. Moreover, he predicted, somewhat radically, even for him, that all species would be gone in 2015.
The typical estimate that we see cited on environmental organizations websites are that around 40,000-60,000 species are lost every year. Since this is such a large number, there are countless press references to the assumption that mankind is now conducting “the sixth mass extinction”, which sounds very scary. The most famous of the five extinctions happened some 65 million years ago and destroyed the dinosaurs, and probably half of all species’ in the sea.
Now, time passes, and it has been quite a few years since these predictions were made, so let us see what actually happened. We can start with Rachel Carson’s book Silent Spring. Her motive for writing the book was that she thought the pesticide DDT would kill off birds and decimate or destroy mankind by causing a cancer epidemic.
Both claims were speculative and not based on hard evidence. People had previously used DDT to eradicate malaria in the US for years, and many neighbourhoods had tankers driving down the street regularly to spray. As one person described it: “Every summer the DDT truck would drive throughout my neighbourhood spraying a fine fog of pesticide that us kids ran behind and played in for blocks at a time. You couldn’t even see the kid standing three feet next to you, and yet after all that, we didn’t drop dead like the flies it was killing.”271 Another wrote: “My mom would feed us early enough that we were done with dinner in time to run after the trucks as they sprayed our neighborhood several times per week, sometimes every night, with the thick and exciting bank of fog. Much like waiting for the ice cream truck, we couldn’t wait for the sound of the fogger motors as they rounded the corner to our street. Kids would ride bikes, skate, and run behind them.”272
In spite of this, no one has identified any clear consequences from that other than the disappearance of deadly malaria. Clinical trials were conducted by the US Public Health Service, in which human volunteers ate up to 35 milligrams of DDT every day for 18 months, approximately 1,000 times as much as people would normally be exposed to.273 No adverse effects could be observed during the test period or over the next 10 years where they were still checked. The workers in the DDT-producing Montrose Chemical Company operated without any protective clothing and had, for years, inhaled so much DDT dust that it amounted, in one case, to what a normal person would experience in 1,300 years, and yet, as a study of them by the American Medical Association concluded: “It is noteworthy that (after 10 to 20 years on the job) no cases of cancer developed among these workers, in some 1,300 man-years of exposure, a statistically improbable event.”274 So they actually contracted less cancer than average (none at all was recorded). In fact, other studies found that DTT seemed to be a quite powerful inhibitor of cancer, and one team of scientists even concluded that it should be used actively to combat human cancers: “The proposed mechanism for DDT’s protective effect in rats may also apply to man.”275 One of the world’s leading experts on the toxicity of DDT, Professor J Gordon Edwards of San Jose State University, used to start his lectures on DDT by eating a spoonful of it in front of his students, and he appeared in the media doing the same. In 2004, he died at the age of 84 of a heart attack while climbing a mountain.
What about the birds? Later studies have shown that DDT can lead to thinner eggshells in certain species of birds. But the striking fact was that the birds population in the US actually seemed to have increased significantly in the years before the publication of Carson’s book.The most prominent source of bird-counts in the US is the Audubon Society; an organization of bird-watchers which, every Christmas, launches its “Christmas Bird Counts”. This activity consists of sending thousands of members out into the countryside to count birds. In 1941 - just before the introduction of DDT – on average, each of these observers counted 1,480 birds. In 1960, the observers counted, on average, 5,860 birds. So the bird population seemed to have almost quadrupled, after the introduction of DDT.
In 1967, the Virginia Department of Agriculture made an analysis which concluded that the use of DDT had indeed increased bird populations, partly because mosquitoes also spread diseases among birds, and also because their food was less damaged by insects, and finally because DDT stimulated the birds’ natural defence against toxins.276 Others pointed out that it also seemed to facilitate the breakdown of aflatoxins, which are very strong carcinogens, which might explain why it inhibited cancer.277
However, all this was ignored by environmentalists, who had now shifted the focus from what could happen in the air to the potential effects of the substance when it reached the sea. This altered focus became widespread primarily in 1968 when Charles Wurster – who became co-founder of the Environmental Defence Fund – demonstrated that a resolution of 500 ppm (parts per million) DDT in seawater reduced plankton photosynthesis.278 That sounded very worrying until people pointed out that you actually cannot dissolve that much DDT in sea water – it saturates at 1.2 ppm. In addition, they also noted that the actual concentrations of DDT in the oceans were less than 0.1 % of the lowest concentration he had tested and that his tests had shown that concentrations below the 1.2 ppm saturation actually had been beneficial for photosynthesis. But how had he made a maximum concentration that was 400 times the saturation point? He had dissolved large amounts of alcohol in the saltwater, so that the concentration of DDT could be brought up to 400 times the natural saturation point.279 To replicate this in nature, one would have to turn the world’s oceans into alcoholic drinks and then mix in approximately 660 cubic kilometres of DDT. And then you would have to keep mixing more in rather frantically, because tests conducted at EPA’s Gulf Breeze Laboratory in Louisiana showed that 92% of the DDT disappeared from the seawater within 38 days.280
In 1970, the American Academy of Sciences published a report in which they argued that DDT used for malaria had probably already saved the lives of some 500 million people worldwide. Therefore, they pointed out, banning the use of this substance would lead to millions of deaths and disablings, and it would also induce people to fight malaria with other, more toxic, agents.
The following year the Environmental Protection Agency in the US staged a seven-month-long consultation during which 125 experts and 365 papers on the effects of DDT were presented to a judge. After this investigation and examination of witnesses, the judge concluded that DDT was beneficial, harmless and should remain legal.281
However, the environmentalists ignored all of this and kept up their political pressure, after which use of DDT was banned via a combination of laws and international political pressure tactics. By 2001, because of this campaign, there was just one DDT factory was left in the world, in Kochi in India. Environmental campaigning organisation Greenpeace now began an intense campaign to get this factory closed too and, on December 15 2003, issued a press release that stated: “Greenpeace calls on Indian Authorities to Phase Out and Substitute DDT Immediately. It is clear that the Indian government should phase-out and substitute DDT immediately as required by the POPs convention.”282
The consequence of the banning of DDT was that an unknown number of millions of people who could have been saved, through use of DDT, became ill or died of malaria. How many exactly is impossible to say, but if the previous estimate that DDT had saved 500 million people before the ban was realistic, the number of deaths caused by this ban has been the greatest man-made disaster ever.
On 15 September 2006 the nightmare finally ended, when the UN issued a press release stating: “Nearly 30 years after safety concerns led to the phasing out of indoor spraying with DDT and other insecticides to control malaria, the United Nations health agency said today it will start promoting this method again to fight the global scourge that kills more than one million people every year, including around 3,000 children every day.”283 Greenpeace and WWF, two of the main driving forces behind the ban, have since softened their language about DDT, but never apologized.
Let’s get back to the extinction of species. Have we killed 40,000 species per year, as Myers thought we would? Or 25,000-30,000, as Lovejoy guessed? Or is it nearer Ehrlich’s 250,000? Are we, in other words, doing as the natives did on Easter Island?
Overall, scientists have given estimates of the planet’s total number of plant and animal species that vary between (roughly) 2 and 80 million, where 1.6 million species have actually been catalogued. One prominent study in 2011 suggested 8.7 million species plus/minus 1.3 million (so 7.4-10 million)284, whereas many previous estimates had centred around 3.5 million. Such estimates do not include bacteria, the total number of which is totally unknown, but estimates typically range from 10,000 to more than 10 million species. Some experts are actually talking about billions of bacterial species, and argue that these come and go constantly.
It is estimated with some uncertainty that a given species typically survives between one and 10 million years (during which time it might have mutated beyond recognition). Encyclopædia Britannica indicates, with reference to a number of sources, - and a very long explanation - that the natural extinction rate probably varies from one species a year to a species per decade. If we, for example, study the period 1980 - 2000, as Lovejoy’s report to US president Jimmy Carter covered, one would therefore expect a natural loss of 2 to 20 species during this period, according to Britannica’s estimate.
All scientific reports of endangered and presumed-extinct species are meticulously recorded by two international organizations. One is International Union for Conservation of Nature (IUCN), whose members include a number of government institutions and international organizations. This produces the so-called “Red List”. The second organization is the Committee on Recently Extinct Organisms (CREO) under the American Museum of Natural History, which publishes the CREO List. The statements made by these two organizations are very similar and they refer to each other.
The former’s statement showed in 2012 that, globally, almost 800 known species had been eradicated between 1600 and 2012. Most scientific sources put the actual number of known extinct species over these 400 years a bit higher – at just around 1,000 – or equivalent to 0.066 % of known species. For instance, the standard textbook for genetic studies in conservation A Primer of Conservation Genetics and Introduction to Conservation Genetics from 2007 and 2010 list both 917 extinct species since the year 1600. The following is an estimate of how they are distributed, based on key categories and this time assuming 1,059 extinctions.

ESTIMATES OF THE PROPORTION OF SPECIES THAT HAVE BECOME EXTINCT IN THE PAST 400 YEARS. AS THE TABLE SHOWS, THE LARGER SPECIES ARE FAR MORE THREATENED THAN THE SMALLER ONES.285
The reason why estimates of actual extinction differ slightly is that, after you can no longer locate a species, you deliberately wait some years or decades before you declare it extinct, as quite a number have reappeared after having been declared extinct (for example, one study found that more than a third of mammals reappeared after having officially been declared extinct).286 In any event, the numbers in the table above indicate that approximately 0.0001625 % of the 1.6 million known species have been lost annually.
These numbers are completely out of line with the forecasts we mentioned previously; rather than all or half of all species becoming extinct between 1980 and 2000, we see that, in reality, less than 0.1 % were lost – and that was not over a period of 20 years, but over more than 400 years. While popular environmentalists who appeared regularly in the media spoke of 40,000 or more species lost annually, what scientists actually found was that approximately 2.6 species died out annually. This means the environmentalists’ number was 15,000 times too high, which is how they reached their “sixth mass extinction” prediction.
But what about species becoming extinct without us ever discovering that they existed? If, for example, there were 8.7 million species plus or minus 1.3 million, where would that get us? Here we should first note that large species are far more prone to extinction than small ones. As the table above shows, we have lost 2.4% of our known mammals over the past 400 years, but well below 0.4 % of reptiles, amphibians, fish, molluscs and crustaceans. Looking at the insects that are either small or extremely small, we have, over 400 years, lost only 0.008% of known species.
Obviously, it is also large species such as mammals that are easiest to observe, so if there are many uncatalogued species, these are probably, overwhelmingly, of the smaller kinds.
If we use the relatively common estimate that there are 3.5 million species in total, then there are 1.9 million of these that are not catalogued, and they must predominantly be insects, plankton, horn leaves, liverworts and mosses, green algae and charophytes. If we extrapolate known extermination data from these kinds of species, and if we use the aforementioned even greater numbers of 8.7 million species plus or minus 1.3 million, the number of unknown species rises to between 5.8 and 8.4 million, and an estimate of the number of extinctions rises to in the order of 1,500-1,750 species, or a total of approximately 0.02 % within 400 years or 0.00005 % annually. That is 3.8-4.4 species per year, which reduces the popular environmentalist overstatement factor from in the region of 15,000 to 3.400-3.900 times the real numbers.
Although it doesn’t move the dial much, we should mention that, while species disappear, they also evolve. How quickly something like this can happen is indicated by the assumption made by some scientists that 300-500 new cichlid species might have developed in Lake Victoria, East Africa, over the past 14,000 years, and that such a species can in fact develop over just 20 generations.287 A new species develops, it should be mentioned, when it can no longer breed with its ancestral species. Experiments with fruit flies have demonstrated that new speciation can develop within just 25 generations (which takes about half a year) just by giving two groups different growth conditions. Currently, biologists have observed how new species seem to be emerging naturally, including among finches, maggots, guppies, thale cress, goatee, ragweed, cabbage and the bird species monk. In addition, new species arise because of human activity. When Europeans arrived in Madeira, they brought mice which have since evolved into at least six new species.
Among the more absurd examples is England’s London Underground mosquito. This insect lives in London’s underground train network and is now completely separated, genetically, from its ancestor species, which lives above ground and feeds on birds rather than people. This speciation has happened over 150 years.
There is no doubt, however, that the loss of species in recent centuries has far exceeded the creation of new species, and the net loss is probably more than 1,000 species since 1600.
In Keeping Options Alive: The Scientific Basis for Conserving Biodiversity Walter Reid and Kenton Miller provide an estimate of the number of mammal and bird species to have become extinct in every 50-year period from 1600 to 1950. Between 1600 and 1850 it was 10-20 species per 50-year period, but it increased to 50-70 per species per 50-year period while peaking in around 1850. In the same book are estimates of the distribution of extinctions by 2000, and it appears that the number of extinctions among birds and mammals has fallen by three-quarters share from 1900-1950 to the period 1950-2000.
That was a lot of numbers, but we needed to consider them before we could discuss what happens with the environment, when we change from static to dynamic societies, as the West has done. Does the environmental impact grow ever worse, and are we about to repeat what happened on Easter Island? Or does it get worst initially, but then better? Or something else?
A common romantic view is that ancient people had much higher respect for the environment than modern man in Western society. For instance, former US vice president Al Gore wrote in his book Earth in the Balance that “native American religion, for instance, offers a rich tapestry of ideas about our relationship to the Earth. One of the most moving and frequently quoted explanations was attributed two Chief Seattle in 1855... “. He then quoted North American Indian Chief Seattle making the following in a speech in 1855:
“How can you buy or sell the sky, the warmth of the land? The idea is strange to us. If we do not own the freshness of the air and the sparkle of the water, how can you buy them from us? (...) Every part of this Earth is sacred to my people. Every shining pine needle, every sandy shore, every mist in the dark woods, every clearing, and humming insect is holy in the memory and experience of my people.”
This touching speech has also been referenced in numerous environmental activist websites, for it resembles a clear testimony of how we, in Western civilization, have lost the respect for nature that native people find natural. It has also been reported in such diverse publications as Northwest Airlines’ magazine Passages, the Canadian government’s Green Plan and NASA’s Mission to Earth. In 1991, an immensely popular children’s book about Chief Seattle and his beautiful message was published. Its title was Brother Eagle, Sister Sky: A Message from Chief Seattle and, in 1992, it reached number five on the New York Times bestseller list. It outlined Seattle’s messages of peace and harmony, and how he was “a respected and peaceful man”, who could teach us a lot about decent behaviour. No wonder they all admired this man, because his message was moving and lyrical, continuing like this:
“But if we sell our land, you must remember that the air is precious to us, that the air shares its spirit with all the life it supports. The wind that gave our grandfather his first breath also receives his last sigh. And the wind must also give our children the spirit of life. (...) This we know. The earth does not belong to man; man belongs to the earth. This we know. All things are connected like the blood which unites one family.”
However, there are several problems here. The first is the belief that primitive people typically had, or have, a particularly deep respect for nature. If one recalls our earlier observation about the enormous rates of violence among most tribal people, one can have one’s doubts. What we know about ancient environmental damage can only increase those concerns, so let’s take a brief look at that.
It isn’t pretty, because historically, ancient people have, relatively quickly, driven countless species to extinction, when arriving in a new area. The first human migration in Australia, for instance, happened 48,000-50,000 years ago, and the local mega fauna (defined as species with body weight above 44 kg) became extinct there about 46,000 years ago. Meanwhile, those same species survived on the island of Tasmania south of Australia, which had not yet been populated by man. But man arrived there 43,000 years ago as sea levels fell and enabled them to walk across. Et voilà: the mega fauna also disappeared there.288
That should probably tell us something, and we see the same story everywhere. When the first immigrants crossed over to North America approximately 11,500 years ago, three quarters of the area’s large mammals died out quickly. Some 7,000 years later, when people also populated South America, this continent quickly lost most of its largest mammals. That is one reason why Engels’ and Diamonds’ aforementioned narrative about the differences in natural fauna explaining the differences in human development isn’t very compelling; but it also tells us how Stone Age folk treated nature. If we take North and South America together, after human emigration, the Americas lost such wild animals as wild horses (which were later replaced by European species) mastodons, (elephant-like animals with trunks), mammoths, lions, sabre-toothed cats and various species of musk, llama, bison, bear and wolf, giant condors, wild pigs, giant armadillos, camels, giant beavers and 2.7 metre-long salmon with sabre teeth plus anteaters the size of horses. So, for all we know, the early Indians killed off all these species fairly soon after they arrived.
Shortly after the immigration in the Americas, the first people showed up in Hawaii, and studies of fossils showed what happened there next: 50 of the island’s original 98 species were wiped out by the local tribes - long before Europeans arrived in 1778. In fact, a typical pattern was, as Charles Darwin discovered, that a multitude of new species would easily have developed through inbreeding on islands, but also, as archeological records and more recent experiences show, that island species are far more sensitive to eradication threats than those living on main lands.
So it continues. Shortly after people first appeared on Madagascar off the African coast around 2,500 years ago, 17 species of lemur died out. And 600 years ago, when people arrived to New Zealand, they swiftly managed to eliminate 29 species of bird - including all flightless birds – again, long before Europeans arrived.289
From an archaeological discovery near Otago, scientists found the remains of approximately 30,000 Moa birds that had been slaughtered within a relatively short time. On average, about a third of the meat from the birds was left uneaten, and there were ovens full of roasted birds that had not even been touched. What a great parties there must have been, but no wonder the Moa became extinct.
If we look at North and South America and Australia combined, we see a total decimation of between 74% and 86% of the local megafauna since the Stone Age people arrived in these areas (but again; before Europeans arrived in the Age of Discovery).290 This is signficant, and biologist and ornithologist Storrs Olson from the Smithsonian Institution has estimated that a quarter of all bird species on sea islands were wiped out by tribesmen before Western civilization was established.291 In other words: very small populations of tribal people destroyed far more species than the much larger group of civilized nations later did. So perhaps that is where we have our “sixth extinction”.
Contemporary non-civilized tribes often behave the same way, and studies of isolated tribes in Brazil today revealed that these people frequently hunted in areas where the game was already under pressure, and they fished a single species of fish by pouring poison into ponds, whereby they killed everything else.292 They also consciously sought out pregnant monkeys or apes with infants, because these were easier to kill. Furthermore, they would gladly fell a whole tree to get a few fruits from the top; and they regularly exhibited indifference or cruelty to wounded animals.
Past burning of forests has probably contributed a lot. After humans arrived in Australia, there seems to have been a change in the vegetation, where species that were particularly resistant to burning became more widespread.293 In America, the Indians also burned forests periodically, and the prairies that the Europeans found on arrival had previously largely been forested areas, which the Indians had destroyed. In Africa, the Masais systematically burned forests to create grazing land for their cattle and to combat the tsetse fly. When they were forced to move out the Kruger National Park, bush quickly began to spread. Another indication of the extent of people’s natural burning of forests was seen after Spaniards murdered countless Indians of Panama. After these Indians were gone, rainforests began to grow in what had previously been savannah.294
So the basic pattern is this: when Stone Age people arrived for the first time to a new area, they would typically quickly eradicate most, or all, of the mega fauna there, plus any wingless bird species. If they were on islands, they would also wipe out a substantial proportion of flying bird species. And they regularly torched the forests and created savannah or prairie instead.
So the common perception of primitive tribes as being peace-loving environmentalists is, to put it mildly, very questionable, and it is therefore not surprising that Chief Seattle, on closer examination, never really made the touching speech that Al Gore and others like to quote. Instead, it was written in the winter of 1971/72 by a media man named Ted Perry, who was hired as text writer for an environmentalist movie called Home, where he was asked to weave-in an Indian who defended environment.295
To Perry’s consternation, the finished movie never attributed the text to him, and this is why so many thought it was authentic. It could not, in any case, have been authentic; because it included the sentence “I have seen a thousand rotting buffalo on the prairie, left by the White Man who shot them from a passing train.” These events took place more than 1,500 kilometres from where the chief lived, and they began 20 years after his death. Whether the chief ever made any speech on the subject Ted Perry addressed, we do not know, because the first mention of this appeared in a newspaper column written by an amateur poet 33 years after the speech allegedly occurred.296 That sounds unlikely, partly because they didn’t understand each other’s languages, and partly because the Indians never used a form of poetic speech which sounded even remotely like that used in Perry’s narrative.297 And finally we should not forget the aforementioned fact (in chapter eight) that it was the very same Chief Seattle who, in 1847, organized a notorious ambush attack on his neighbouring tribe, where some 150 men were mown down in a hail of bullets, after which he took all the surviving women and children as slaves.298 In general, primitive tribal people have hardly been particularly respectful of nature nor stranger, but their ability to destroy the environment was, of course, somewhat limited by their very small numbers. This restriction disappeared when the world’s population began to grow, and when the West began to industrialize there was major damage to the environment such as we see, for instance, in China today as they go through the same process.
As an example of how it was in the West, we can take England. Its first settlers had begun the destruction by burning wood to start farming, but when industrialization and largescale urbanization began, it grew really rough. Kitchen waste and the contents of latrines was now regularly emptied out of upper windows (it was advisable to look up), and faeces piled up in city streets, alleys and backyards together with layer-upon-layer of horse manure creating an unbearable stench, to the delight of flys and rats. Furthermore, as people began to burn coal and coke, black smoke soon poured from tens of thousands, perhaps eventually millions, of chimneys, creating the notorious “pea soup fog”.299
It was truly dreadful. For example, in 1257, Queen Eleanor visited the northern English city of Nottingham, but found the smoke from its many ovens so overwhelming that she feared for the live and health and left the place immediately.300 Around this time, London was popularly called “The Big Smoke” (a nickname that still exists today), and in 1272 it had become so problematic that King Edward I introduced a not very effective law to reduce air pollution.
Later, in the 1700s, we can read this contemporary complaint about the English capital’s air quality: “By reason likewise of this smoak, that the air of the city, especially in the winter time, is rendered very unwholesome: for in case there be no wind, and especially in frosty weather, the city is cover’d with a thick brovillard or cloud, which the force of the winter sun is not able to scatter, so that the inhabitants thereby suffer under a dead benumbing cold...”301 So the air was so polluted that the sun couldn’t shine through and people were freezing in the permanent shadow.
The water wasn’t any cleaner. Sewage was discharged untreated directly into the River Thames, which in the early 1800’s went by the nickname “The Great Stink”. Soon the fish disappeared, and the permanent stench from the waters grew so bad that, in parliament, it became necessary to soak the curtains with calcium chloride to counter it.302 On 7 July 1855, the famous physicist Michael Faraday wrote an indignant letter to the editor of The Times, where he described his observation after having sailed on the Thames:
“The appearance and the smell of the water forced themselves at once on my attention. The whole of the river was an opaque pale brown fluid. In order to test the degree of opacity, I tore up some white cards into pieces, moistened them so as to make them sink easily below the surface, and then dropped some of these pieces into the water at every pier the boat came to; before they had sunk an inch below the surface they were indistinguishable, though the sun shone brightly at the time; and when the pieces fell edgeways the lower part was hidden from sight before the upper part was under water.”303
In addition to stench, flys and rats, the filthy water gave rise to thousands of cholera deaths. When a steamer capsized in the River Thames in 1878, 600 people died - most of them due to effects of acute infections caught from the fermenting soup.
As cars and trains were later invented, these brought with them new sources of pollution. Air pollution in the 20th century was sometimes so bad that the occupants in the streets of London could not spot the curb, and pedestrians sometimes had to use flashlights to detect where the pavement ended and the road began. In a particularly glaring incident in 1952, where visibility decreased to about 10 cm, about 3,900 people died within a few days due to this air pollution, especially because the burning of coal and coke gave a very high concentration of sulphuric acid content in the air.
But then the trend turned. We cannot say exactly when air and water pollution in the UK peaked, but it was probably somewhere between 50 and 200 years ago, and especially since the 1960s, the improvements have been very swift. A modern car on UK roads spews forth less than 5% of the pollution it used to in the 1960s, which was again far less than the pollution caused by cars in the 1940s, which was less than that of the 1920s.
As a consequence of this and other clean-up efforts, particle pollution in British air has dropped to a tiny fraction of what it was before, and this should continue. According to the EU’s “Euro 6”, the 2014 standard cars emission of NO and NO2 should be 84% lower than in 2000, and the emission of soot should be 96% lower. Similarly, CO2 emissions, per kilometre, have fallen dramatically and are expected to drop by half again between 2013 and 2025.304
The reality is that there have been amazing improvements in air quality, and London water quality has also improved massively. If we turn again to the Thames, the London Evening Standard newspaper reported the following in 2009:
“The Thames is packed full of fish and cleaner than it has been for 200 years, fishing experts say. More than 125 species, including wild salmon, trout, Dover sole, plaice, haddock and bass, now live in the 215-mile waterway which was declared biologically dead in 1957. The stocks are attracting predators including porpoise, seals and dolphins which have been spotted as far upstream as London Bridge.”305
So the sea- and water pollution in the UK got worse at first, but then it got better - and then a lot better.
Similar trends have been seen anywhere in the West, as its civilization modernized itself. For example, the number of species in the Rhine sediments rose from 27 in 1971 to 97 in 1997.306 Between 1970 and 2010, the number of cars and trucks in the US more than doubled, but at the same time their total emissions of carbon monoxide and sulphur dioxide dropped by more than half, and their combined emissions of particulate emissions fell by 80% and of lead by 98% while the release per car of these substances fell by approximately 75, 90 and 99%, respectively.307
However, people worried about more than the effects of air particle pollution on our health. In January1970, US magazine Newsweek reported that a new Ice Age was coming because of air pollution. On 19 April the same year, ecologist Kenneth Watt predicted, in a speech at Swarthmore College, Pennsylvania, that the world’s average temperature would drop 11 degrees by the year 2000, which is twice as much as is needed to trigger a new Ice Age. This threat of a man-made ice-age was so alarming in the eyes of Professor Arnold Reize from Case Western Reserve University, that he stated in a newspaper interview that “We will be forced to sacrifice democracy by the laws that will protect us from further pollution.”308
The following year (1971), climate scientist Stephen Schneider wrote a widely-quoted study that contained the following conclusion: “Our calculations suggest a decrease in global temperature by as much as 3.5 °C. Such a large decrease in the average temperature of Earth, sustained over a period of few years, is believed to be sufficient to trigger an Ice Age.”309
In1972, a number of climate scientists held a climate conference about the upcoming cooling, which resulted in a letter sent to President Nixon dated 3 December in which they warned that this future global cooling would lead to “increased frequency and amplitude of extreme weather anomalies such as those bringing floods, snowstorms, killing frosts, etc.”310 The government subsequently set up the “Working Group Ad Hoc Panel on the Present Interglacial”, which predicted annual temperature drops of 0.15 degrees up until 2015, equivalent to an aggregate temperature drop of almost 4 degrees.
One of the consequences of this anthropogenic (man-made) cooling about which many scientists warned was a catastrophic decline in crop yields. And on 29 December 1974, the New York Times commented:
“A number of climatologists, whose job it is to keep an eye on long-term weather changes, have lately been predicting deterioration of the benign climate to which we have grown accustomed….Various climatologists issued a statement that ‘the facts of the present climate change are such that the most optimistic experts would assign near certainty to major crop failure in a decade.’ If policy makers do not account for this oncoming doom, ‘mass deaths by starvation and probably in anarchy and violence’ will result.”
Increased weather extremes was another concern, and an article in Newsweek from 1975 gave examples: “Last April in the most devastating outbreak of tornadoes ever recorded, 148 twisters killed more than 300 people and caused a half billion dollars worth of damage in 13 states.” On 5 January the same year the New York Times reported that “an international team of specialists has concluded from eight indexes of climate that there is no end in sight to the cooling trend of the last 30 years, at least in the Northern Hemisphere.”
The cooling trend was clearly a killer, and the year after the reporter Lowell Ponte explained in his scary book The Cooling:
“This cooling has already killed hundreds of thousands of people. If it continues and no strong action is taken, it will cause world famine, world chaos and world war, and this could all come about before the year 2000.”311
Schneider, who was one of the people who had started the panic, was particularly concerned about the increased number of extreme weather events that would follow as the world cooled. In his book The Genesis Strategy from 1976 he consequently dedicated an entire chapter to explaining how and why the climate would become evermore unstable as it grew colder. Here he wrote, for example: “Now, where we appear to have entered a cooler period in high latitudes, there have been suggestions that we will suffer more droughts, floods, temperature extremes, or other manifestations of climate variability.” This and a possible man-made ice age could, he explained, be counteracted if you were to detonate “clean” thermonuclear devices in the Arctic Ocean or spreading black soot particles by aircraft in order to reduce the reflexion of sun light.
As the signs of an impending Ice Age started to vanish in the 1980s, the focus shifted to the so-called “acid rain”, and in 1982, Canada’s Environment Minister, John Roberts described this problem as follows: “Acid rain is one of the most devastating forms of pollution imaginable, an insidious malaria of the biosphere.”
In 1984, the well-known German magazine Stern reported that a third of German forests was already dead or dying because of acid rain. At the same time, the German Interior Ministry expressed the expectation that all German forests would be gone in 2002, and the biologist Bernd Ulrich from Göttingen University caused a furore by stating in 1981 that large forests would be “dead within five years. They cannot be saved.”312 In November 1981, leading magazine Der Spiegel brought a headline screaming “Acid Rain over Germany. The Forests Die.”313 Other media brought similar sensational stories about the disaster.
However, an extremely large study in the US involving approx. 700 scientists with a budget of more than half a billion dollars concluded in 1990 that, actually, only between 1 and 4% of lakes in different regions of the nation had excessively low pH levels and that this did not cause significant problems.314 A follow-up study by the same organisation (called NAPAP) published in 2011 noted that emissions of SO2 had fallen by 64 % from 1990 to 2009 while NOx emissions fell by 67% and SO2 emissions by 59%.315
In Europe, it turned out, on closer examination, that only 0.5% of the forests were affected by this problem at any one time, and the forests didn’t die as expected.316 In fact, it turned out later that, even as the acid rain debate had been raging, the biomass of the European forests had grown rapidly. As ecology professor Han van Dobben wrote: “During the last few decades, forest growth has strongly increased over large parts of Europe.” He added that “survey studies on tree ring analysis indicate a 20-50 % increase of forest production since c. 1950.”317 Furthermore, it was determined, through experiments, that if you irrigated trees with different concentrations of acid, they actually grew faster than usual when acid concentrations were slightly above the actual measured.318
After acid rain came the ozone crises, which was actually a genuine threat. As it turned out, some substances from refrigerators and spray bottles degraded the vital ozone layer in the high atmosphere, so a global ban of these was soon implemented. Meanwhile, the fear of a new Ice Age was replaced by a fear of global warming.
Before we delve a little into this new panic, we can start by looking at the factors scientists think affect our climate. Among the most long-term is movement in the tectonic plates that creates mountain ranges affecting wind and water currents. In addition, there is a cycle of approximately 143 million years, driven by the solar system through the Milky Way’s spiral arms, which leads to varying exposure to “cosmic rays” from stars. These rays are actually “storms” of atoms and subatomic particles emitted from stars that create cascades of tiny nuclear reactions when they enter the atmosphere at incredible speeds. These reactions create charged particles that can stimulate the formation of water drops (H2O are like small magnets that get attracted to charged particles). This may stimulate cloud formation and cooling. (More about that in a minute.)
Moving to the somewhat shorter-term, the climate is affected by what are known as geomagnetic reversals, whereby the Earth’s magnetic field reverses its polarity at irregular and, so far unpredictable, intervals but, on average, every 450,000 years. It actually happened about 41,000 years ago and then flipped back within just 440 years. As the reversal takes place, the magnetic field drops towards zero for a time, which means the Earth becomes more exposed to cosmic rays and thus probably more cloud cover and perhaps lower temperatures.
Another variable is Milankovitch climate cycles, which relate to 1) changes in the Earth’s rotational axis relative to the sun; 2) the fact that this axis also wobbles; and 3) the fact that the Earth’s orbit around the sun fluctuates between being more or less elliptical. These cycles interact in a complicated pattern, but seen in isolation, they create quite powerful cycles of approximately 21,000 - 41,000 years’ duration. Collectively, they seem to play major roles in creation of ice ages, which over the past 2.5 million years have started every 40,000-100,000 years.
In periods such as now, where we are not in an Ice Age, we say that we are in an “interglacial period”. The previous four of these lasted 23,000, 12,000, 4,000 and 16,000 years, respectively, and the current has now lasted approximately 12.300 years.
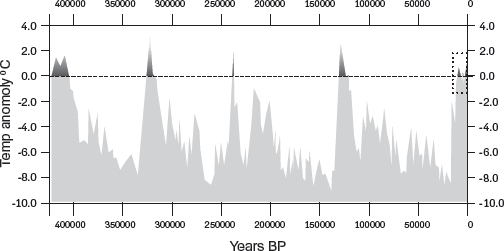
RECONSTRUCTION OF GLOBAL TEMPERATURES OVER THE PAST 420,000 YEARS BASED ON DRILLING OF THE VOSTOK ICE CORE FROM THE ANTARCTICA (IT’S CALLED VOSTOC BECAUSE IT THE RESEARCH STATION IS RUSSIAN).319
If we zoom into what has happened within our recent 12,300 interglacial years, it appears that the natural warming contribution of Milankovitch cycles culminated between 7000 BC and 500 BC, and that actual temperatures had a culmination around 7000 BC to 5000 BC. We call this the Holocene Climatic Optimum. During this optimum almost all the ice in the Alps melted and the North African territories became rainy and lush (on average it rains more when it gets warmer, due to increased evaporation). In fact, all this rain accumulated in vast underground pools of water, which today are pumped up and used for irrigation and drinking water in Northern Africa.
As for the Milankovitch cycles, we now seem to be in a slow slide towards more cooling. However, in the shorter-term scientists assume there are other natural variables called the Schwabe, Hale, Gleissberg, Suess/de Vries, Eddy and Hallstatt cycles, respectively.
Assuming these are real, what drives them? The proposed explanations include rotation of the sun’s magnetic field (Schwabe cycle) and cyclical fluctuations in how planets pull in the sun (the other cycles). For instance, the Hallstatt cycle correlates with periods during which four large planets are aligned and therefore exhibit increased gravity pull in the sun, which displaces it away from its average position. Apart from displacing it, it is also speculated that gravitational pull can change the inner dynamics within the sun.320
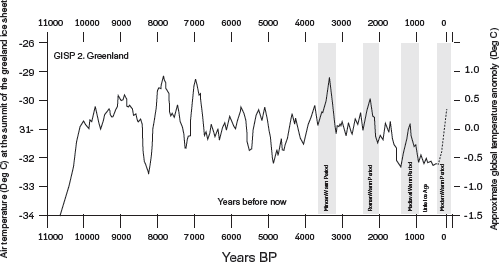
RECONSTRUCTION OF THE CLIMATE OVER THE LAST APPROX. 11,000 YEARS; STARTING WITH THE END OF LAST ICE AGE. THE DATA SERIES IS BASED ON GREENLAND ICE SHEET DRILLINGS AND END AROUND YEAR 1865. THE DOTTED LINE SHOWS HAS BEEN ADDED TO THE GRAPH TO SHOW THE SUBSEQUENT TEMPERATURE RISE OF APPROXIMATELY 0.8 CENTIGRADE.321
The sun is evidently important for our climate, and total solar radiation fluctuates approximately plus or minus 0.1 %, but for certain ultraviolet spectrums, the fluctuation can be as much as plus or minus 70 %. However, what may have a bigger effect is the fact that fluctuations in solar activity involve sunspots and solar flares, which influence the sun’s magnetic field. This seems to cause fluctuations in the Earth’s exposure to cosmic radiation of about 10-15%.
Is cosmic radiation important? It may very well be. The Danish climate scientist Henning Svensmark and others have, for years, worked with a theory that long-term fluctuations in cosmic rays due to sun spot cycles constituted the main driver of the smaller historical climate fluctuations, including the recent Little Ice Age. He and others have in CERN in Switzerland successfully simulated how increased cosmic radiation can stimulate formation of water droplets in the atmosphere. This is an interesting theory because the sunspot activity almost stopped during the Little Ice Age, but during the warming period 1975-2000, it was about as strong as it had ever been over the last 11,000 years.322
So far, so complicated, but we aren’t through yet. For instance, we also have a lunar cycle of 18.6 years plus cyclical shifts in ocean currents called Pacific Decadal Oscillation and Pacific Decadal Oscillation, which both oscillate every 20 to 30 years. And we have the sea currents called El Niño and its counter phase La Niña. El Niño is the warming phase, which comes every two to seven years, and persists for nine months to two years. Like the other sea oscillations, these alternate between bringing hot and cold water to the surface.
And there is more, because climate is also affected by random disasters such as meteor impacts, volcanic eruptions above and below the water or natural methane release episodes such as one that seem to have happened around 55 million years where a sudden release of a trillion tons ago methane lead raised temperatures by eight degrees for a while.
And then there is CO2 and other greenhouse gases, which allow entry of ultraviolet sunlight, but limit outgoing radiation of infrared light from the Earth to space. Since we started industrialization in the West, the atmospheric concentration of CO2 has increased from approximately 0028% to 0.04%, and if we do not make a big transition to nuclear power and/or other non-fossil technologies, it can increase to about 0.05%-0.1% by 2100. The marginal direct effect of more CO2 is, in itself, exponentially decreasing, but indirect effects, such as results of increased evaporation and therefore greater cloud cover, are very difficult to calculate and may either enhance or inhibit the greenhouse effect.
So just think about it; this was a very simplified summary of some of the likely natural drivers of our climate, and yet it included the following 20 variables:
1.Continental drift, changing mountain ranges and so on
2.Milky Way Spiral Arm Passages (every 143 million years)
3.Geomagnetic reversals (random, but on average every 450,000 years)
4.Milankovitch Axial tilt (41,000 years)
5.Milankovitch Axial precession (26,000 years)
6.Milankovitch Apsidal precession (22,000 – 26,000 years)
7.Hallstatt cycle (2,300 years)
8.Eddy cycle (1,000 years)
9.Suess / de Vries cycle (210 years)
10.Gleissberg cycle (87 years)
11.Hale cycle (22 years)
12.Pacific Decadal Oscillation (20-30 years)
13.Pacific Decadal Oszillation (20-30 years)
14.Moon cycle (18.6 years)
15.El Niño/ La Niña (2-7 years)
16.Vulcanic eruptions above water
17.Vulcanic eruptions below water
18.Meteor impacts
19.Natural methane releases
20.Greenhouse gases
As mentioned, we are now probably in the declining stage of the natural interglacial period as driven by the natural Milankovitch-temperature. On top of this comes natural cycles created by solar activity and ocean currents.
The most prominent is the aforementioned Eddy cycle of approximately 1,000 years (or rather 800-1,100 years), so where are we in that? If we look back, one of its peaks was the Minoan Warm Period 3,300-3,450 years ago. This was followed by a significant cooling, and then we had a new temperature rise, which created the Roman Warm Period approximately 2,100 to 2,250 years ago. This was fairly warm, as olive trees grew further north than today, and we know that many of the current glaciers in the Alps at the time were completely gone.323 New archaeological finds, for example, have shown that, in Roman times, people often crossed over the pass at Schnidejoch in Switzerland, which today is covered by glaciers.324
The next Eddy-warming was the Medieval Warm Period approximately 1,000-1,200 years ago, when we know from the aforementioned Domesday Book, written in 1086, that there were wine farms in the UK. The distance between each peak in this cycle has thus been around 1,000 years, and each warming plateau has lasted 150-200 years.
If we believe this pattern is no coincidence, then we should once again be in a culmination phase of this cycle, which could last until the middle of this century. At the same time, the shorter Gleissberg and Suess/de Vries cycles may have contributed to warming in the last decades of the last century, but could exhibit the opposite effect in the coming decades, as may the Pacific Decadal Oscillation.
The Little Ice Age ended in 1830, and a dedicated heating can be said to have begun around 1860. If we expect the Eddy Cycle to keep us on a plateau for 50-200 years, then it would start cooling somewhere around the middle of the century.
That was a lot of “may” and “could”, but that is how it is. However, one thing that we know is that, since the current warming started after 1830, we have seen three longer warming periods: 1860-1880, 1910-1940 and 1975-2000, in which the latter two were almost identical in intensity. In the first of these two periods, CO2 emissions were minimal; why they seem to be completely natural. The third heating phase may be due to a combination of greenhouse gas emissions, a rather strong solar activity in this particular period, cyclical changes in ocean currents and the phases of the Eddy, Gleissberg and Suess/ de Vries cycles.
During this warming period we have seen a reduction in sea ice around the North Pole of around 20 %, although it varies significantly from year-to-year. In contrast, the intensity of ice on Greenland’s mainland as well as ice cover at the South Pole have been relatively stable, with the latter even increasing. Particularly at the South Pole, it follows that higher sea temperatures lead to a melting of the edges of the ice, but at the same time to an increase in snowfall of the land-based ice cream, which roughly balances out.
Furthermore, there has been a very linear sea level rise of about three millimetres per year (equivalent to 30 cm in 100 years) from approximately 1880 until today, of which it is estimated that 13-25% came from pumping up and discharging of groundwater, and the rest from the melting of land ice and volume expansion due to heating.325 The Intergovernmental Panel on Climate Change (the IPCC) expect in their 2013 report expected increases in sea levels of approx. 26-97 cm over 100 years.
It is obvious that our civilization, through the burning of fossil fuels, contributes to global warming. However, a recurring criticism of the IPCC assessments is that they downplay natural climate variations such as those mentioned above. At one point, they even almost eliminated the Little Ice Age and the Medieval Warm Period through a so-called “hockey stick graph”- we will revisit that episode in section five.
Overall, it is clearly possible that natural phenomena such as variations in solar activity, the Eddy cycle and other cyclic currents have contributed significantly to the observed process from 1970 to 2000 as the events before and after this episode are not consistent with the prevailing climate models’ projections. As NASA climatologist Roy Spencer noted in 2013, 87 out of 90 leading climate models from 1983 projected higher temperature increases than have actually occurred, and these over-estimations were significant.326
While science may underestimate natural and cyclical climate phenomena, much of the media tends to deliver sensationalist horror scenarios without scientific basis. Some examples:
![]() It is true that summer ice in Greenland has dwindled in recent decades, but the same thing happened in the 1930s where it actually occurred faster.327
It is true that summer ice in Greenland has dwindled in recent decades, but the same thing happened in the 1930s where it actually occurred faster.327
![]() Coral reefs will not necessarily disappear if sea levels continue to rise, as the coral can grow up to a centimetre a year – actually, coral formations can be over a kilometre high.328 If this was it not the case, all coral reefs would now be far below the surface, as the sea has already risen about 130 meters since the last Ice Age.
Coral reefs will not necessarily disappear if sea levels continue to rise, as the coral can grow up to a centimetre a year – actually, coral formations can be over a kilometre high.328 If this was it not the case, all coral reefs would now be far below the surface, as the sea has already risen about 130 meters since the last Ice Age.
![]() It is not new that boats have occasionally, in recent years, been able to sail through the Northwest Passage north of Canada or through the Northeast Passage north of Siberia, because the ice has opened. The former was done, in part, by Sebastian Cabot in 1508 and completed by Roald Amundsen in his ship Gjoa in 1903-1906. It was also done repeatedly during World War II. The Northeast Passage north of Siberia was used by Vitus Bering in 1733 to 1743.
It is not new that boats have occasionally, in recent years, been able to sail through the Northwest Passage north of Canada or through the Northeast Passage north of Siberia, because the ice has opened. The former was done, in part, by Sebastian Cabot in 1508 and completed by Roald Amundsen in his ship Gjoa in 1903-1906. It was also done repeatedly during World War II. The Northeast Passage north of Siberia was used by Vitus Bering in 1733 to 1743.
![]() There is no statistical evidence that we are getting more extreme storm episodes in a warmer climate. Historically, it has actually been the opposite.329
There is no statistical evidence that we are getting more extreme storm episodes in a warmer climate. Historically, it has actually been the opposite.329
![]() It is not true that malaria will spread to the north because of global warming. During the Little Ice Age, there was widespread malaria in northern Europe, Russia and the US, and the reason it is now gone is not down to climate fluctuation, but because, today, these countries can afford to prevent it. On average, malaria has tended to disappear when a country’s GDP capita has exceeded $3,100.330
It is not true that malaria will spread to the north because of global warming. During the Little Ice Age, there was widespread malaria in northern Europe, Russia and the US, and the reason it is now gone is not down to climate fluctuation, but because, today, these countries can afford to prevent it. On average, malaria has tended to disappear when a country’s GDP capita has exceeded $3,100.330
![]() Polar bears are not dying out because of global warming. First, it is a variant of the brown bear, with which it therefore can breed. Second, the polar bear population was, in 2013, at around 20,000-25,000; the population was significantly less around 1970, and Canada has been selling about 700 annual hunting licenses annually for polar bears. Finally, polar bears survived the last interglacial period when temperatures were much higher than today.331
Polar bears are not dying out because of global warming. First, it is a variant of the brown bear, with which it therefore can breed. Second, the polar bear population was, in 2013, at around 20,000-25,000; the population was significantly less around 1970, and Canada has been selling about 700 annual hunting licenses annually for polar bears. Finally, polar bears survived the last interglacial period when temperatures were much higher than today.331
![]() When the world’s media writes that temperatures are the highest “on record”, it does not, as many readers probably assume, mean that they are the highest ever or since the last Ice Age. The term refers to temperatures measured by satellite or thermometer where previous warm periods per definition are not “on record”.
When the world’s media writes that temperatures are the highest “on record”, it does not, as many readers probably assume, mean that they are the highest ever or since the last Ice Age. The term refers to temperatures measured by satellite or thermometer where previous warm periods per definition are not “on record”.
Not everything we have heard about environmental problems is true, whether it concerned DDT, extinctions, global cooling, acid rain, sea-, air- and river pollution, global warming or many other subjects, and some of the alleged threats we hear have virtually no basis at all. But in spite of this, it is still fair to question whether Western civilization, with its growth and technological innovation, is dangerous. What is the truth?
The truth is that intense creativity, advanced technology and increased prosperity are the most effective elements in the creation of a better environment. Conversely, romanticising the past, rejecting new technologies, embracing zero growth, falling for undocumented fads and refusing to weigh costs and benefits of different scenarios against one another will make the challenges unsolvable.
To see who is best at protecting their environment, one can check the so-called Environmental Performance Index (EPI), which is based on 25 different environmental indicators measured in each of a number of countries. This was first developed in 1999 by two of the world’s leading universities, Yale and Cornell, both in the US, along with the World Economic Forum and the European Commission. The results show a clear, positive correlation between income levels and a healthy environment. As stated in an EPI report from 2008: “Not surprisingly, per capita GDP is correlated with higher performance on the EPI. In particular, overall EPI scores are higher in countries that have a per capita GDP of $10,000 or higher.”332
So, the richest countries are the cleanest, and these are predominantly Western. The highest scoring countries for cleanliness in 2014 were Switzerland, Luxembourg, Australia and Singapore, in that order, while the most polluted were impoverished Somalia, Mali, Haiti and Lesotho. Poor North Korea has developed into an ecological disaster and has lost much of its forest cover, while wealthy South Korea’s forests are stable.333 The island of Hispaniola consists of the poverty-stricken Haiti on the one hand and the (close to 10 times) richer Dominican Republic on the other. Haiti has destroyed nearly all its forests, while the Dominicans have maintained theirs effectively.334 If we also bear in mind all our previous examination of environmental history, including UK’s, the picture gets pretty clear: economic growth begins with a deterioration in the environment, but is subsequently better than if the country had remained poor. Seen over a longer perspective, the sequence is roughly this:
![]() Phase one: Mass extinction. The earliest tribesmen are hunters and perpetrate mass extinction, primarily of big animals and island birds, combined with regular torching of forests which creates prairie, savannas and heathers.
Phase one: Mass extinction. The earliest tribesmen are hunters and perpetrate mass extinction, primarily of big animals and island birds, combined with regular torching of forests which creates prairie, savannas and heathers.
![]() Phase two: Further deforestation. Early farmers undertake permanent clearing of forests for conversion to farmland.
Phase two: Further deforestation. Early farmers undertake permanent clearing of forests for conversion to farmland.
![]() Phase three: Big smoke; big stink. During early industrialization, air and water initially suffers massive pollution.
Phase three: Big smoke; big stink. During early industrialization, air and water initially suffers massive pollution.
![]() Phase four: Clean-up. As societies grow rich, they introduce modern environmental technology combined with growth in natural parks and so on. The environment improves incrementally.
Phase four: Clean-up. As societies grow rich, they introduce modern environmental technology combined with growth in natural parks and so on. The environment improves incrementally.
The key observation is that the West has, for a long time, been at stage four above. Yes, the environment grew worse in the past, but the trend turned a long, long time ago. Economists sometimes describe this phenomenon as “the environmental Kuznets curve”. The turning point is typically reached when GDP per capita rises to somewhere between $2,000 and $8,000 dollars a year; some studies indicate that the average is $4,000 dollars, and specifically for loss of forest, the average turning point has been in the region of $4,600. When a country later exceeds GDP per capita of approximately $10,000, there will typically be a significant improvement in the environment. In Denmark, for example, forest cover in the early 1800s was only 2-3%, but it has since increased to approximately 11%, even as the country has become a massive exporter of farming products.335 Development in forest cover is actually rather symptomatic of what is happening to our environment. An inventory of the global forest cover for the period 2000-2010 revealed that 13 million hectares had either been reclassified or had disappeared entirely, compared with16 million hectares having been reclassified or lost over the previous decade (reclassification typically means that the forest remains, but it has been converted to intensive forestry or other human activity). However, at the same time, 95 million hectares were converted to national parks.336
The main issue with forest cover concerns jungle (because of its immense biodiversity), and according to an analysis by the United Nations in 2007, around 154,000 km2 jungle was destroyed every year. However, at the same time, no less than 8.5 million km2 of jungle was growing back after having previously been farmland.337 Now, of course, “destroyed” and “growing back” are not directly comparable units at all, but it is somehow interesting that the latter figure was 55 times larger than the former and that the area where jungle was coming back was equal to the size of US. The reason that this was happening was urbanization and greater use of technology-intensive farming, which required much less land.338
Here, we will also get help from an unexpected side, namely the so-called aerial fertilization effect, i.e. fertilization by increasing atmospheric CO2 content.339 The dry matter in plants consist mainly of carbon, which they extract from the CO2. As natural CO2 concentrations are low, greenhouse owners often double or quadruple the CO2 artificially, since plants typically grow 25-65% faster at a CO2 concentration of approximately 1,500 ppm (parts per million), which is optimal for many plants. Conversely, plants often die, if the concentration falls below 150-200 ppm. Similarly, an increase in atmospheric CO2 to 500 – 1,000 ppm, which we may see at some point in this century, will enable many plants to grow much faster.
On average, forest coverage has been increasing in most wealthy nations for a long time. In fact, the growth of forest land in rich countries continued to be so swift that it has almost compensated for forest loss in poorer nations. According to statistics from the Food and Agricultural Organization of the United Nations (FAO), which is the only organization that has closely-measured global forests over the long term, global forest cover today is much the same as it was when it began to calculate it in 1949.
All this does not mean that there hasn’t been forest loss over the long term, because there has. It is estimated that approximately 37% of the globe was covered with forests before humans existed, and this figure has been reduced to 30% today. But most of the destruction was carried out in, or before, the Middle Ages, and over recent years, forest cover has actually increased in Asia, Europe and the US.340
UN official forecast of 2013 for world population predicts the global population will increase from approximately 7 billion people today to more than 9 billion by 2050 and up to 10 billion in 2100 (it also has scenarios in which world population drops after 2050). The high estimate, however, is based partly on the expectation that rich countries have increasing, rather than decreasing, populations, and partly on a number of African countries not reaching their demographic turning points.
These assumptions look increasingly unrealistic. When a country’s GDP reaches about $5,000 per capita, birth rates (fertility) typically begin to decline, and at around $10,000, the typical pattern is that fertility drops below equilibrium level - often even far below.
This decline will often happen very quickly. Birth rates can even fall by up to 40% within 15 years, if incomes grow fast enough.341 Among the more extreme examples is Iran, which from the end of World War II to 1990 had birth rates of 6-7 children per woman. However, within a single generation, it dropped to 1.88 – far below replacement level.342
In 2011, Sanjeev Sanyal from Deutsche Bank published an analysis which included calculations based on the same statistics, the UN used, but with very different conclusions.343 His argument was based on the total birth rate. For various reasons, this has to be a little over two children per woman to ensure a stable population, but in the 1950s, for example, it was 6.1 in China and 5.9 in India. This figure, however, had, in 2012, decreased to 1.8 in China and 2.6 in India. Furthermore, there were around 119 boys born for every 100 girls in China, and in India the ratio was 110:100. If you adjust for this, Sanyal pointed out, effective birth rates were just 1.5 in China and 2.4 in India. This meant China faced a rapid population decline and India had already come very close to a level that would provide stabilization.
Around the middle of this century, China stands to lose 20-30% of its population per generation, and other countries will lose up to 50% per generation. The effect of all this will be a world that is very different to what many envisage. In 2009, ecologist Stewart Brand made this assessment, based on the corrected data:
“The UN’s median estimate in 2008 was that the world population would reach little over 9 billion, but that figure is based on the assumption that birth rates in emerging markets will start rising again for some reason. Because that seems unlikely, I think a more probable peak is 8 billion followed by a descent so rapid that many will consider it a crisis.”344
There’s more: global GDP per capita has just reached the critical $10,000, which usually heralds demographic peak, and there is currently not a single country in the world which has a higher birth rate than it had in 1960. In fact, as already mentioned, the global population growth rate peaked in 1963, and it has since declined steadily.
From 1970 to 2010, the global birth rate dropped by 33% for the world as a whole, by 34% in developing countries and 41% in Islamic nations. It is overwhelmingly likely that birth rates will continue to decline significantly from year-to-year, and then population growth will halt completely. If you adjust for imbalances between girls and boys born in Asia, the indication is that, between 2020 and 2025, the human race will reach the magic tipping point where the global sex-adjusted birth rate falls below the equilibrium level. Approximately one generation after that, the globe will begin to depopulate, perhaps even rapidly. It should here be noted that Japan, China, Russia, Brazil, the US, South Korea and most of Europe are now below replacement birth rates.
However, here is an obvious question: what if China drops its one-child policy, which has already been liberalized slightly? A clue to the answer can be seen from the Chinese populations in Hong Kong and Taiwan, which are much richer, but have no one-child policies. In both territories, the estimated birth rate in 2013 was only 1.11, so significantly lower than China’s. In even richer - and 74% Chinese – Singapore, the birth rate is as low as 0.79%. Given Hong Kong’s birth rate, the eighth generation, totalling one million people, will only have 11,527 children, and with Singapore’s birth rate it would only be 1,066 children.
Why is the average birth rate so extremely low in Hong Kong, Taiwan and Singapore? Because when people grow richer, life offers them better opportunities for pleasure, which reduces their willingness to be limited by children. In addition, far more women get tertiary (high) educations and seek career, which again comes into conflict with having children - especially having many children. This is an important aspect, because over the past few decades we have seen a dramatic transformation, so that now, globally, more women than men participate in higher education.
There is another important factor driving down birth rates almost everywhere: urbanization. As farming becomes more technology-driven and compact, farmland is turned into national parks and former farmers move to the cities. Actually, one of the main reasons the birth rate is so low in Hong Kong and Singapore is simply that they are city-states, and city-dwellers have fewer children than people in the countryside. In developing countries, this difference is indeed extreme - in poor countries, an abundance of children equates to cheap labour for a farmer, but in cities children are an economic burden to their parents. This urbanization factor is important, because the world is undergoing a huge urbanization transformation. The global rural population has already peaked and is predicted (also by the UN) to start declining in a few decades. Especially in China, the government plans to move hundreds of millions of people to cities over the coming decades. So a huge demographic transition is underway.
Here is the conclusion: In order to reverse population growth, we have to focus on creative technology, urbanization and rising prosperity - not on zero growth, back-to-nature romanticism and forced abortion.
We must remember that the world’s population doubled during the 40 years from 1970 to 2010, but even according to the pessimistic UN estimates, numbers will only increase by approximately a third over the next 40 years, and according to Sanyals and Brand’s forecasts, they will even grow by much less than that – perhaps only by 15%. In either scenario, the most intense period of population growth is well behind us.
This can actually been summed up in a very simple way: there has always been a race between population growth and innovation, and since 1450, innovation has evolved fastest.
But how can we keep this up? Obviously, we cannot now know which environmental technologies will be invented over the coming decades, but we can gain a hint by studying examples of new environmental technologies that either seem imminent or have been introduced recently.
We have already looked at possibilities such as thorium reactors, travelling wave technology, nuclear fusion and transmutation of nuclear waste. In Belgium, scientists work with a technology called Myrrha (Multi-purpose Hybrid Research Reactor for High- tech Applications), which converts nuclear waste into substances that degrade themselves within about 200 years.345 In 2006, France amended its laws on the storage of nuclear waste so that, henceforth, it should remain available for 100 years; this meant that opportunities to transmute it or to extract the rest of its energy potential (which is approximately 98-99%), through new technologies, would not be missed.
Another interesting field is the treatment of conventional waste in landfills. This can be done with a new waste-to-energy technology called plasma arc waste disposal, whereby mixed waste is heated to between 3,700 and 14,000 degrees centigrade without access to atmospheric oxygen. This rips apart molecules and the result is a stream of gas and slag, the latter akin to the lava spewing out of volcanoes. This process reduces the contents of landfills by about 99%, and the gas it generates is so plentiful that, in addition to operating the incinerator, it provides an energy surplus. As for the slag, this comes out in liquid form, which makes it imminently suitable for casting stones like building materials, just as one can extract recyclable metals from it. And if there is excess slag after metals have been extracted, well, when it cools down, it is simply stones. The US and Japan have started to remove and partially recycle the waste in old landfills with these technologies.
Similarly, new technologies to eliminate toxins from past pollution in nature have been developed. For example, scientists have created a genetically-modified poplar tree, which collects mercury from the soil. Once the poplar is felled, the mercury can be extracted and sold commercially. Another example is the aforementioned genetically modified bacteria that can break down oil spills in the oceans.
More problematic, however, is halting the extinction of species. But we are getting far better at tackling this. The vast majority of the losses of species occur on small islands (60%, 81% and 91% of extinct mammals, birds and reptiles, respectively lived only on islands.346), and, to a lesser extent, in tropical rainforests.
To prevent future extinction in affected areas, there is now a strong focus on restoring original streams and planting trees that capture nitrogen to improve soil fertility. There is also implementation of fishing quotas combined with fish farms and modified agricultural practices such as protecting small areas containing wild species in between patches of farmland. Perhaps most important is a huge effort to enhance natural parks, and the world’s natural parks actually increased ten-fold between 1970 and 2010.347
In addition, there are now more than 1,000 gene banks (or seed banks), where the seeds of an increasing number of plant species are kept safe and regularly planted for renewal. An international collaboration between aquariums and botanical and zoological gardens has also helped bring back many species from the brink of extinction.
While we are on this subject, it is worth noting that people say “extinction is forever”, but is it really? Not if you believe what you saw in the 1993 film Jurassic Park, which was about the recreation of dinosaurs. The method (in the movie) was to drill into ancient amber pieces that contained mosquitos and extract dinosaur blood from the stomachs of these insects. Scientists could then take this dinosaur DNA and insert it into birds’ eggs, possibly by first-sequencing a lot of samples and recreating full DNA strings. The idea was that the eggs cells would hatch and dinosaurs emerge.
That was a cool plan, but there were several problems with it, including the fact that the dinosaurs ate the scientists. This was admittedly what made the story excellent movie material, but as well as that, scientists watching it generally found it too far-fetched. “I laughed when Steven Spielberg said that cloning extinct animals was inevitable,” said Hendrik Poinar of McMaster University in an interview with National Geographic in 2009. Poinar was an expert in ancient DNA and scientific advisor for the film. However, he has since changed his mind: “I’m not laughing anymore, at least about mammoths. This is going to happen. It’s just a matter of working out the details.”348
When the film was made, no one had ever deciphered DNA. Now, this is routine, and the same goes for synthesizing new DNA. Furthermore, scientists have found relatively well-preserved DNA strands of hair from frozen mammoths in Siberia. By decoding and comparing many of these, they have reconstructed the entire code, and they now believe they can produce artificial mammoth DNA and implant it into eggs, which would then be inserted into elephants.
Such a process is now called “de-extinction”, and there is already a technical precedent. In 2003, a company called Advanced Cell Technology cloned a banteng, which is an endangered ox from Java. The clone was made from frozen tissue taken from an animal that had died 23 years earlier. The scientists achieved this by putting the dead animal’s genome into several cow’s egg cells, and one of the cows gave birth to a healthy banteng. If you can do it with an animal that died-out 23 years previously, you can, in principle, do it with one that became extinct 10,000 years previously - if you can sequence its DNA, and if there is a reasonably close-living relative that can breed it. You don’t even need to extract an intact DNA string, as long as you can identify its sequence by comparing numerous damaged DNA samples. Once you know the code, you can synthesise a new DNA string using standard machinery.
Here it should be noted that some of the species scientists hope to recreate lived in cold climates. These include megafauna such as the Tasmanian tiger, mammoths, sabre-toothed cats and woolly rhinos, which lived in the recent ice age. So if we end up developing a real-life Jurassic Park, it might have to be in Greenland, Siberia, Canada, Chile o Argentina, all of which today have areas with suitable climates (and it will not be Jurassic, but Mesolithic).
All this brings us back to the story of the environmental disaster on Easter Island. After Jared Diamond had published his bestseller Collapse, where he described how the people on this island felled all their big trees and subsequently ate each other in desperation, several later books were published that painted a very different picture; two such examples were Questioning Collapse and The Statues that Walked.349
These argued, convincingly, that it was actually the rats that arrived with the Polynesian immigrants, which had caused the island’s deforestation, since that kind of thing is normal on islands and because approximately 99% of old nuts found on the island had traces of rat bites. To illustrate how swiftly such things can happen, laboratory experiments have shown that a single rat couple can multiply to 17 million individuals in just over three years. Terry Hunt and Carl Lipio concluded in Questioning Collapse:
“The ecological catastrophe of Rapa Nui had a complex history that cannot be reduced to psychological motivations of people who cut down the last tree. Indeed, the “last tree” may simply have died, and rats may have simply eaten the last seeds. What were the rats thinking?”
A more fundamental comment on the same matter comes from aforementioned nuclear physicist David Deutsch:
“It would be astonishing if the details of a static society’s collapse had any relevance to hidden dangers that may face our open, dynamic and scientifically-based society, let alone what we should do about them.”350
The problem on Easter Island was precisely that the locals had a static society without an innovative culture, so when they encountered problems, they didn’t come up with solutions. They did not know how to develop traps or make rats into chicken feed. Nor did they manage to make nets and other fishing gear that could have made them effective fishermen. When, in 1786, J F G de la Perouse brought them sheep, goats, pigs and crops for breeding-purposes, they just ate them. They were not creative.
But others were, and we should not forget that while Homo sapiens has destroyed a lot of things, it is also the only species on the planet that deliberately tries to preserve and protect other species; so, if a 100 or 500 years from now, a giant comet rushes towards Earth with the potential to eradicate half of all living species, there will be, perhaps for the first time in its multibillion-year history, one species, among the millions of species, that is capable of preventing disaster for all the others: we humans, because we are creative.
Let’s bring this chapter to a close by summarizing the environmental challenge in as simple a way as Paul Ehrlich would have done. As mentioned earlier, he launched the IPAT equation, which read as follows:
Environmental Impact = Population × Affluence × Technology
So, in his opinion, the richer we become and the more new technology we introduce, the worse things become. This is wrong, because as we have seen, the more advanced the technology a society has, the less damage it does to the environment.
But Ehrlich’s equation is even worse than that, because he describes wealth as being part of the problem even though the richest nations, statistically, are the cleanest and have stable or declining populations on top, which means that affluence should also appear as a divisor. So here is a better version:
Environmental Impact = Population / (Affluence × Technology)
The solution to our challenges is not to stand still or to reverse, as they did on Eastern Island, but to move forward. The key to our future environmental solutions is not to curb technology and economic growth, but to incourage creativity, prosperity, technology and growth.