11
EVALUATING RETURNS ON MARKETING INVESTMENTS
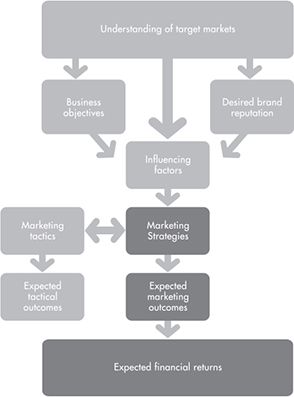
Figure 11-1: Marketing Alignment Map
Does your company measure anticipated returns on marketing investments in financial terms? Do you do so before you approve the plan?
If you do, congratulations! You are at the forefront of a trend in marketing management.
If you don’t, then why not? There are several reasons companies don’t measure returns. The most common one is that they don’t believe it is possible. As one CEO once told me, ‘marketing is a black art that eludes measurement.’
He was wrong.
DEBUNKING THE MEASUREMENT MYTH
I call this belief that marketing, and particularly promotions, cannot be evaluated in financial terms the Measurement Myth. Not only is it untrue, but failing to measure marketing is one of the leading reasons companies fail to maximise returns on their market-facing investments.
Marketing can, and should, be measured in financial terms.
Most executives can figure out how to monetise new product innovation. They simply assume that the units will sell. Pricing, too, is easy. After all, a dollar of change need simply be multiplied out by volume. Of course, the estimator must also assume a change in demand. Distribution channels are also relatively easy to monetise. The expected volume, multiplied by the price point, less costs gives the company an idea of how a channel approach might affect the company’s bottom line. Executives must, of course, assume their companies’ products will sell. They must also make assumptions about how the channel is likely to affect other existing channels and how likely the market is to purchase the product at the price point at which it will be offered.
‘Failing to measure marketing is one of the leading reasons companies fail to maximise returns on their market-facing investments.’
Although executives are generally comfortable with these types of models, they remain uncomfortable with models projecting financial returns on promotions. Yet, for many, the promotions-related marketing personnel costs and expenses were sizeable portions of their overall marketing budget.
Several common concerns are expressed when I ask executives of both market-leading companies and average performers why they do not measure financial returns on marketing, and particularly, promotional investments.
First, building such a model would require assumptions. After all, just about every financial model does. One of the first lines repeated over and over in business schools when doing financial analysis is to ‘assume interest is X%, and inflation is Y%.’ These must be assumptions because they are out of our control. We can base them on historical averages, adjusted for our own lending environment and economic conditions. Regardless, they are assumptions.
The models for pricing, products and placement all require assumptions, as well. After all, a company that is investing in the production a new widget assumes that the widget will sell. The company bases this assumption on a series of other assumptions: that the product is correctly based on market needs, a competitor won’t arrive on the scene with a better product just before the new widget is launched and the company will succeed in selling the widgets. Because sales are assumed, and promotions are often used to provide leverage to sales, some level of promotional expense is likely assumed in any new product calculation. Similarly, pricing and placement calculations also rely on assumptions about demand, which in turn, assumes a level of promotional investment.
Examining the models from this perspective, and given the role promotions play in providing leverage to the sales force, one might argue that the present value of the stream of promotional investments over the life of the product should be added into expense calculations when estimating potential financial impact. Of course, this is rarely done. Promotions often benefit multiple products or services and can be used for other reasons. The amount of money invested in promotions is also variable and may be difficult to estimate over the life of the product.
Assumptions are both normal and acceptable in financial planning. As the company builds systems and collects data for analysis, the organisation will have more historical performance data and will require fewer assumptions. As long as the assumptions are made consistently, the data should be comparable. When new information validates or disproves historical assumptions, the outcomes of those calculations should be adjusted to reflect the new facts. This is the same approach managers take in any type of financial planning.
The second reason executives say they do not measure outcomes in financial terms is because they already evaluate performance using non-financial metrics. They, or their marketing team, track hits on their website, followers in social media, column inches of news coverage or use one of the industry-wide surveys of brand awareness to track how well the market at large knows their name.
Non-financial metrics may be easier to track, but they can be misleading. First, most of these metrics provide no indication about whether the organisation is reaching the right market. The company may, for example, be receiving excellent news coverage but not in a location that customers would see the articles. No amount of news coverage is likely to move the wrong market to make a purchase decision. Second, the metrics may be appropriate for the tactic, but if someone does not understand how the clicks, inches or awareness translate to revenue for the company, the numbers can lead the company to misinterpret results.
For example, if I told you that a company had 100,000 followers on Facebook, you might think that number was outstanding. After all, that is a large number relative to most small and mid-sized companies’ social media. However, if I then told you that only .002% of followers were likely to make a purchase based on what they saw or heard based on the site, meaning that just two of those followers were likely to be customers, the savvy executive might wonder whether his or her social media initiative was paying off. At the very least, it might cause managers and executives to ask why the company generates such a small number of customers and whether the message or approach is effective.
To be useful in assessing potential returns, non-financial metrics must be connected to financial metrics. The company must have some idea of how the followers, hits, column inches or awareness will affect revenues, either alone or in conjunction with other elements of the marketing mix.
This leads to the third common concern driving the Measurement Myth. Many executives and marketing professionals alike will argue that they don’t know what the impact of the investments will be. This is generally because they did not think carefully enough through the impacts they expected before they invested in their marketing activities. This is the purpose of the Marketing Alignment Map described in chapter 5, ‘Understanding What Influences Market Behaviour.’
A company that focuses on using the Marketing Alignment Map, beginning with a solid understanding of the influencers that affect the purchasing decision process as described in chapter 6, ‘Aligning Marketing Tactics With Influencing Factors,’ and how changes in influencers will affect sales, can make fact-based assumptions about how its marketing investments will affect customer decisions and company revenues. This is particularly true in larger organisations when more sophisticated analyses can pinpoint with more precision the expected output of an additional investment in a given aspect of the marketing mix. Larger companies should understand the impact of their investments within a few percentage points of actual outcomes. For example, with my company’s Fortune 500 clients, our predictive analytics based on historical performance can help optimise marketing expenditures across a range of market-facing investments. We can tell our clients not only how they should allocate funds across activities to achieve the maximum possible return on investment, but also what the financial returns will be.
Small and mid-sized organisations often have a more limited data set, making these sorts of analyses more difficult and/or impractical. However, this does not mean that the outcomes should not be measured. In fact, it makes careful study of marketing returns even more important because historical data will eventually become the strongest guide of future investment decisions.
For example, a small non-profit that does an annual end-of-year appeal can estimate the likely outcome of a similar appeal based on past performance. It can begin by isolating continuing activities from new ones and estimate the expected revenue from sustained activities. Then, it can estimate expected returns based on incremental additions to their marketing plan to estimate the impact those new investments will have. Because this seems like a trial and error approach, and because many marketers are reluctant to be held accountable for financial outcomes, many small and mid-sized organisations fail to estimate or measure the potential outcomes, leaving them no benchmarks for future performance.
The fourth and final common driver of the Measurement Myth is that the executive team and/or its marketing team simply don’t believe marketing can be measured. As a result, they don’t try. This is, perhaps, the most common reason that the Measurement Myth persists. That old executive joke about being unable to understand which half of their marketing investments are being wasted has established itself, at some level, as truth with a large percentage of non-marketing managers. It is also supported by many marketers who, often for good reasons, are reluctant to be held accountable for financial outcomes.
The reasons for marketers’ resistance to debunking the Measurement Myth are described in the next section, which addresses how the marketing function should be managed. The remainder of this chapter describes why and how marketing should be measured as a part of the evaluation of investments in marketing.
THE BENEFITS OF MEASUREMENT
When companies do try to measure marketing, it commonly happens after the marketing investments have been made. They look at the number of column inches of media coverage and try to determine whether that resulted in any new customers, or they look at sales through a new distribution channel, like a catalogue or web partner, and try to determine whether the channel is delivering a solid return.
Although these types of measurements can be helpful, they are often imprecise and not helpful when evaluating a plan before approval. The best approach to understanding the financial impact of marketing is to measure it at least twice: before the plan is funded and after the programmes are complete. In fact, measuring before implementing a marketing plan is often more important than measuring after it has been completed.
MEASURING RESULTS IN ANTICIPATION OF FUNDING
There are several reasons why measuring in anticipation of a marketing activity is arguably more important than specific measurements after execution:
Measuring in anticipation facilitates monitoring. This is because the sum of all marketing activities, if measured in financial terms, should provide two simple metrics that are easy to monitor: revenues and expenses. If the organisation carefully anticipates expected revenues and expenses, it should be easy to monitor outcomes with a quick look at the company’s financial statements. If the company is not hitting the revenue goals anticipated in conjunction with marketing expenditures or if the marketing expenses have exceeded their budget, this flags the need for more thorough investigation.
Measuring in anticipation facilitates comparison. When non-marketing management team members are asked to review a marketing plan and budget that include numerous tactics with whose returns they are less familiar, such as social media or public relations activities, it can be difficult to understand the expected impact each component will make. After all, it is difficult to compare eyeballs (or hits on a website) to inches. Asking the team to translate these activities into revenues allows the non-marketing executive to ask more informed questions.
For example, consider a marketing department for a CPA firm that suggests the firm have a presence at a trade show, engage in social media directed at a particular audience and pursue media relations. Even if the three activities are aggregated, if a dollar outcome is attached, when the non-marketing management team asks about the impact of eliminating one aspect of the plan, the impact can be measured in terms that allow objective evaluation. When financial numbers are not attached, discussions about outcomes can quickly become mired in metrics that are not easily comparable and don’t translate to sales.
Measuring in anticipation minimises poor investment decisions. Companies make poor investments in marketing when
the marketing activities are not aligned with marketing strategies that are designed to affect the market;
the plans are based too heavily on assumptions; and
there are other aspects of the company’s operations that will affect success but are not identified in the planning process.
Turning anticipated marketing outcomes into financial figures tends to prompt questions that surface these challenges.
When a management team reviews the marketing plan in the context of the Marketing Alignment Map, beginning with the market and the company’s business objectives, and ending with anticipated financial outcomes, it can more quickly spot marketing activities that simply aren’t aligned. It can also help nonmarketing executives identify aspects of the plan that have been based on assumptions, rather than facts. Although assumptions are normal, they represent risk in the planning process, and many can easily be tested or replaced with facts, either from research or from historical performance.
Finally, the discussion of anticipated returns prompts the marketing and executive teams to take a careful look at what other conditions must be satisfied in order to execute effectively. Many times, a marketing plan is created, but some other aspect of company operations becomes a barrier to success. For example, I worked with one manufacturing client whose objective was to grow sales aggressively. We worked together to build a plan, and as we assessed potential returns, I asked whether their manufacturing facilities could accommodate the anticipated expansion. The CEO laughed and told me he would like to have that problem.
However, the issue wasn’t a laughing matter. Their capacity constraints were real, and it quickly became evident that if the company’s revenue stream grew at the projected rates, demand would exceed the company’s ability to supply customers with products, and the company’s reputation would suffer as a result. Much to the executive team’s disappointment, I recommended scaling back on their market-facing investments and growing at rates that would permit reasonable expansion of manufacturing capacity.
Measuring in anticipation improves the accuracy of intermediate and retrospective measurement. Measuring in anticipation makes it easier to develop intermediate metrics and measurement tools. For example, consider a company that anticipates a 20% increase in business due to a combination of more proactive and structured sales activities (a channel tactic) and leverage from specific promotional activities. A discussion of anticipated returns over the longer term allows the executive team to ask about progress points along the way. For example, the executive team might want to track the number of proactive, rather than responsive, sales calls its sales team makes as an intermediate measurement of success.
In the process of this discussion, the company may discover it has a tracking need it has not had in the past. For example, it may not have tracked the number of proactive versus reactive sales calls made by its sales team. The conversations associated with anticipated returns allow the executive and marketing teams to identify these intermediate tracking systems that will help ensure that the programme is delivering on results. In this example, if the number of proactive sales calls was not increasing by a specific date, the marketing and executive teams could reconvene to troubleshoot the problem, helping to ensure that the marketing plan remains on track.
This process also makes it easy to identify tracking systems and reports that are no longer useful. Many companies produce endless numbers of reports to try to track behaviours and activities within a company. By reviewing the anticipated returns in advance, along with the intermediate metrics along the way, it may become clear that some reports provide no meaningful value to managers, allowing the company to reinvest internal resources on more relevant tracking systems.
Measuring Returns During and After Execution
Measuring returns in anticipation of marketing plan approval is the final step in assessing its effectiveness, which is why it is the last chapter in this book’s section, ‘Evaluating Proposed Investments in the Marketing Function.’ It is critical to success. However, measuring returns during and after execution is also important.
Measuring returns during and after execution allows you to improve performance. A professional runner times every run and tracks the food, beverages and training that produced that time result in order to understand how to maximise performance. In the same way, the company that measures the intermediate metrics associated with marketing outcomes, as well as the ultimate financial results on a systematic basis, can improve its ability to compete.
In addition to generating a better understanding of what worked and what didn’t, using systematic measurement approaches helps improve accountability by keeping the entire company focused on the metrics that matter and the results the team is trying to achieve.
The planning phase is the perfect time to consider both the metrics you will use to track marketing and financial outcomes and the systems you will use to track actual results. Careful forethought about the information that might be helpful when assessing returns, combined with consistent tracking and analysis, will produce information that will turn assumptions in future planning processes into facts. Because financial models are only as accurate as the underlying assumptions, adhering to this discipline of measurement and analysis will reduce risk and increase the accuracy of future projections.
Best practices related to measurement during the management process are the topic of chapter 14, ‘Managing Measurement.’ However, many of the approaches used to measure marketing returns after the plan is complete are most effective if anticipated before work begins.
DETERMINING THE APPROPRIATE LEVEL OF ACCURACY
Marketing can, and should, be measured. However, the degree of accuracy with which it is measured will vary from organisation to organisation, and even within an organisation, based on the degree of risk and the cost of estimating or measuring returns of any given tactic. Whereas some situations will merit significant accuracy, in other cases, simple estimates will be sufficient.
To illustrate, consider a few examples. One of our clients is a Fortune 500 manufacturing company that sells its products to businesses and individual consumers through retailers. Because of its size and the ubiquitous nature of its products, its selection of retailers is easy. They sell through virtually every major retailer that sells similar product lines. The company has expected sales based on historical data that is well vetted. If a new retailer emerges, the company can easily, and with relative accuracy, estimate the general level of sales that will result. In this case, the risk of investing resources in the wrong channel is relatively small, so estimates based on historical outcomes are sufficient.
The company also engages in a variety of point-of-purchase promotions. Experience has indicated that these programmes are more effective in some environments than in others. Although the cost of the programmes is relatively small compared to the results when invested in a market in which they are successful, investing in the wrong environment would be a significant waste of funds. For this company, the size of the investment and the risk inherent in misapplying promotional dollars make it worthwhile to develop more accurate, fact-based estimates of the potential financial returns the investment might have.
Complex models that accurately forecast outcomes and optimise expenditures dramatically reduce the risk of the company’s investment by reducing the money that is invested ineffectively. Of course, these models are not inexpensive. Several hundred thousand dollars can easily be invested in predictive modelling and postinvestment assessment. However, for this company, the significant sum that the organisation saves by improving investment decisions through rigorous analysis of anticipated returns is far greater than the incremental cost of the analytics services involved.
However, for a small business, the benefits might not exceed the cost. For example, consider a boutique food distributor that sells specially-blended cheese products through retailers across a region. It, too, uses a retail distribution network and point-of-purchase promotions. However, its sales volume and revenues are small relative to Fortune 500 companies. The complex analytical tool used to deliver information to the larger organisation might provide useful information, but the cost would be disproportionately large when compared to the potential improvement in revenue results. For these organisations, informed estimates based on customer and retailer feedback, along with historical sales data, will probably provide sufficient accuracy in predictive modelling relative to the potential improvements it can make. If the company continues to track investment allocations and outcomes, it will be able to build a simple predictive model for its own point-of-purchase investments over time.
In many cases, companies have operated for years with limited or no tracking of marketing efforts, investments and results. Although they may have historical revenue and profit numbers, marketing expense line items and some recollection of what they have done, reconstructing numbers would be arduous and costly at best and, sometimes, infeasible for all practical purposes. I recently worked with a client whose marketing budget had been divided and merged into a variety of other categories and whose labour costs had been lumped under a general administrative category. Separating these figures to determine what the company had actually spent on marketing and what the impact had been would have been unreasonably costly. The benefits would have been marginal relative to the accuracy the analysis generated. In these cases, it is often best to start anew, assessing what has been done recently and beginning the process of anticipating returns and measuring results in order to improve results.
However, even if a company is completely new to anticipating and measuring marketing returns, it would be foolish to postpone starting this practice. Although establishing metrics, tracking systems and processes might be time consuming, it will become easier with time, and the company’s ability to allocate funds effectively—as well as its executives’ confidence in the results—will increase.
MEASUREMENT MODELS: SIMPLE TO COMPLEX
Ways of building models to anticipate and measure financial results of marketing activities range from very simple to extremely complex.
The simplest models are designed to ensure plans have been thoroughly vetted before implementation, keep the marketing plan and those who are executing it on track and provide a baseline for future years. These types of models are best for smaller organisations and professional service organisations, companies with simple marketing structures and programmes in which the risk associated with a misstep is minimal.
The most complex models are used to guide resource allocation, provide more accurate financial data for planning purposes, measure outcomes and reward performance. These types of models are best for middle-market and larger organisations, particularly those who serve broad consumer and/or business markets and have extensive marketing data at their disposal. These models are particularly important when the financial investment is substantial, and multiple programmes are running simultaneously.
The best way to illustrate some of the common methods of measurement within the range of options is to use examples. Some are drawn from client experiences, or, as with the other examples in this book, they are fictional, designed to illustrate the case but not intended to be representative of any particular client. They have also been reframed to demonstrate the role a non-marketing manager might play in helping the company effectively assess potential marketing returns.
Case Study #1: Evaluating the Potential Impact of a Website Overhaul
Nick Delacruz, the CEO of Sociedad Española de Fabricación Industrial (SEFI), an industrial equipment manufacturer, meets routinely with his sales team to discuss the status of various customer accounts and how they can improve sales. SEFI is already a leader in its niche field, which serves customers around the world. Most of the customers who have significant need for its products are aware of the equipment it manufactures, and it always makes the short list of manufacturers under consideration.
However, Delacruz wants to tap a broad market of smaller accounts, many of which would purchase only the occasional piece of equipment. Within this category of prospective purchasers, there are a few industries with large groups of potential purchasers, and many purchasers who do not easily fit into a specific product category. At one meeting, the sales team and Delacruz had a lively discussion about barriers to sales, and the sales team was quick to provide input.
‘The challenge,’ said Juan Perez, the vice president of sales, ‘is that customers really doesn’t know their options. They know they have a problem, so they do a bit of Internet searching. Sometimes they find our site, sometimes they don’t. But even if they do, they may not think we are a good fit.’ Perez went on to explain that he, and the other sales people, heard that once a small business prospect landed on the SEFI’s site, the company’s deep expertise with some of the world’s largest manufacturing customers was readily apparent, but it wasn’t easy to tell that the manufacturer also served small businesses. As a result, small business customers would leave the site and continue their search.
‘It’s just not practical to call on them one at a time,’ Perez continued. ‘Half the time, we get them on the phone and they tell us they saw our site, figured we wouldn’t be able to help them and ended up buying something somewhere else. And there are lots of potential customers. They’d be great to have, but calling them one at a time would be very time consuming.’
By the end of the meeting, the sales team and Delacruz had decided that they needed to update their website. The website provided significant leverage to the sales team, both in terms of providing potential examples and identifying prospects before they made a purchase. To be effective, the website had to become more appealing to the small business owner while retaining its appeal to larger customers.
A few weeks later, Delacruz sat at his desk reviewing website design estimates in a state of shock. For the design, development, writing and launch, web design companies were quoting prices that seemed outrageously high. Although it was tempting to revert to easy fixes with their in-house technology team, Carla Rodriguez, the vice president of operations, reminded Delacruz that their current site was the product of that team and the team was busy with other technology priorities. To address Delacruz’s concerns, Rodriguez suggested they review the potential returns professional assistance might generate.
In this case, a simple approach was most appropriate. Rodriguez began by reviewing historical performance and forecasting future sales based on the existing marketing mix. Because SEFI had experienced very consistent growth over the past several years, it was easy to predict what the growth was likely to be in the next few years.
Next, Rodriguez reviewed the number of hits received on the current site, looking at where they originated and how they used the site. As it turned out, some of the companies the manufacturer was targeting as customers had looked at the site, but most turned away on the first page. Those who continued looked at just a few pages.
She talked to the sales team and asked them how much time they spent calling on new prospects in these industries in order to estimate the potential time savings. She also asked them to begin asking customers who had already searched for a solution what criteria they had used in their web browser.
Finally, Rodriguez considered the financial impact of an incremental sale on SEFI’s profitability. As it turned out, SEFI’s margin on the equipment it manufactured was substantial. Most of its expense was in its sales and operational infrastructure not in the incremental cost of another unit. The sale of one additional piece of equipment would easily pay for the website costs.
To help the CEO understand what she now saw, Rodriguez constructed a financial model demonstrating that if the revised website facilitated the sale of just one additional unit per year, the return on the investment would be in the hundreds of per cents by the end of the three-year measurement period. The sales team, who was even more optimistic about results, believed the returns would be much higher.
Although Rodriguez expected the website to deliver results relatively quickly, she also established intermediate metrics to help monitor the website for potential issues. Rodriguez established tracking and reporting on web hits and the other websites, such as industry organisations, that referred them. She also tracked conversion rates, which is the percentage of customers who looked at the website and subsequently requested a call from a sales person. The discussions with her sales and marketing teams led to the identification of several companion promotional efforts that added some cost, but even more dramatically, improved return.
When mapped out in this way, it was clear to Delacruz, the CEO, that investing in a professionally designed website would generate significant financial returns. As you read this case study, it may have been obvious at the very beginning. Why didn’t Delacruz immediately make the same leap you did when reading the facts about the market?
There are two reasons he hesitated. First, Delacruz was sceptical about the value of websites and other promotions in general. Other than developing collateral materials, such as specification sheets for the sales team, SEFI had traditionally relied heavily on its sales force to sell its products. This approach was new and, like many CEOs, Delacruz had a nagging fear that the money would be wasted. When Rodriguez demonstrated the potential returns, Delacruz felt more at ease about the solution.
Second, Delacruz was in sticker shock. In his mind, the value of a website redesign was a few thousand dollars. Because web design isn’t his business, he didn’t understand the complexity of the design, development and writing process and the number of hours that would be required to complete the process. Demonstrating the potential returns helped address this issue.
Delacruz approved the website overhaul, and three months later, the company launched its new site, complete with images of smaller business applications of its equipment, language addressed to the less technical audience and sections dedicated to the industries within which it found the most customers.
Case Study #2: Evaluating the Impact of Changes in Products, Channels and Promotions
In the previous example, the manufacturer was only changing one tactic within one aspect of its marketing mix. However, more often, a company is making a number of changes at once. This is particularly true when the marketing strategy emerges from a time of crisis or change within a company, as it does in this next example.
Several partners from Greeley & Associates, a regional law firm, were talking over lunch at their favourite restaurant. For a while, they reminisced about the firm’s glory days. Then, their discussion took a more serious turn. When the firm was founded, 20 years earlier, the first partners were well known in their field, natural rainmakers who brought in all of the firm’s business. Now, they were close to retirement, and the company had no clear succession plan in terms of business development. In a professional services environment, this is a placement, or distribution, issue. The partner group, the firm’s primary sales channel, wasn’t performing as well as required.
‘And I don’t know what we’ll do about the employment law group,’ Tony Burns, one of the partners, commented, shaking his head. Greeley & Associates had long been known for its deep expertise in several key areas. Most of their business was generated through referrals from law firms without the required specialty expertise or whose attorneys had conflict issues within their existing client base and were unable to assume responsibility. The service line with poor performance was a generalist practice. Unlike the subject matter experts, this group competed for routine work directly with other firms. This had become quite apparent to attorneys both inside the firm and at the law firms that served as key referral sources to the firm’s other practice groups. The result was strained relations, internally and externally, and poor performance due to the lack of available leverage.
‘I think we need some marketing help,’ Velma Boyle, another partner, finally said. The others agreed. But what kind of marketing? Perhaps a new website? Or an updated logo?
‘Whatever we do, it’s going to be a hard sell,’ Burns warned. The group agreed. The firm’s founding rainmakers (partners with extensive connections within the legal and business communities), had scoffed at the idea of promoting Greeley & Associates’ name and reputation among decision-makers. Because they had a strong reputation and extensive network when they started the firm and were known as subject matter experts among the primary influencers in their business (their peers), they did not see a need for marketing promotions.
Unfortunately, the partners who had been living in the shadows of the rainmakers’ success did not have the reputations or relationships their senior partners did. Because Greeley & Associates had always emphasised the success of its founders and made no proactive effort to promote the success of its extremely talented younger partners, the market was less familiar with their capabilities. Younger partners reported uneasily that some clients had been inquiring about the senior partners’ retirement dates and asking about their future plans, suggesting that they might be considering their options. This is, of course, a valid concern. Research indicates that when a partner retires, his or her clients are quite likely to consider changing firms, particularly if the more junior attorneys have not been positioned as equally capable of handling their legal needs.
After much discussion, Burns and Boyle asked their marketing department to help them determine what steps to take. The marketing team worked with the partners over the next several months, interviewing partners and clients, reviewing data and facilitating a planning retreat to help them refine the organisation’s financial goals. Unlike SEFI, Greeley’s marketing efforts had been scattered. They had added and dropped services, launched promotional campaigns and then discontinued them and made efforts to provide business development training and coaching to partners. It took considerable analysis, working hand in hand with the firm’s CFO, Anna Hiuuka, to generate forecasts based on previous behaviours.
In the process, the marketing team and partners observed a fourth marketing challenge. Despite the fact that the partners were known for deep subject matter expertise, their billing rates were lower than the market overall. The partners took great pride in their low cost services, but client feedback suggested that this may have contributed to the perception by prospective clients that less senior attorneys were inexperienced. To the market, lower rates didn’t mean great value. It meant cheap services, and cheap is rarely associated with exceptional expertise.
The proposed marketing plan developed by the partners and the marketing team contained some very significant changes:
Spinning off or selling the part of the firm that did not match the company’s core value proposition or its existing relationships
Creating proactive transition plans for clients that would position more junior team members as experts, leaders and primary contacts prior to the retirement of senior partners
Gradually increasing prices to reflect the value the firm delivered
Changing the compensation structure to more effectively incentivise and reward new business development
Supporting partners with a variety of proactive promotional efforts.
Before the plan reached the executive committee, the partners asked the company’s CFO, Hiuuka, to take a look at the associated budget and help sell the plan to the leadership team.
Because the recommendations could be taken independently, Hiuuka grouped marketing activities that were related and assessed their potential financial impact as a group.
The service line and pricing changes were the easiest ones to assess. By eliminating the practice group with poor performance, Greeley & Associates would save the costs associated with the salaries of partners and support staff. On the other hand, it would lose the revenue stream associated with the practice. Because the practice had lost more money than it had made, the financial impact of eliminating part of the firm was a net positive.
However, in some cases, such an obvious change can affect other areas of the business. In particular, discontinuing a practice line can affect a firm’s perceived stability, making it more difficult to attract and retain top talent, causing clients to question whether the firm is having financial difficulties and prompting referring attorneys to alter their recommendations. After considerable discussion, Hiuuka estimated the negative impact the move might make and developed an anticipated net financial impact.
Because the partners expressed less confidence about the results of these estimates, Hiuuka reduced expectations of the positive impacts of the move to the point that the partners were confident in the likelihood of the outcomes. The net financial impact was still measurable but relatively small. The partners decided to postpone this aspect of the plan until other elements, such as the promotions, could mitigate the risk that the market would react negatively to the change.
The pricing discussion was similar in nature. The proposed increases were gradual and grandfathered in some existing clients. A simple multiplication of the increase in rates over the number of billable hours suggested that the net impact on profitability would be significant. However, Hiuuka knew that many of Greeley & Associates’ attorneys had become known for their low cost, rather than their exceptional performance. As a result, clients for whom price was more important than expertise would be likely to leave the firm. Hiuuka reviewed the firm’s major clients one by one, assessing the likely impact on their behaviour, and created a model that the partners were confident reflected reality. Although the increase was not as great as it would be if all clients were to remain with the firm, the net impact was still very positive.
Hiuuka assessed the final two aspects of the plan in tandem because they were closely linked. When she asked the partners collectively about the importance of their efforts in developing business, they agreed that most business was generated because of partner efforts. Sidebar 11-3: Case Study #2: Step by Step, continued However, independently, many partners seemed to believe that those efforts should or would be made by someone else in the firm.
Culturally, the firm had tolerated poor business development performance among some partners because the senior partners managed to keep the company’s pipeline filled with new work. However, those pipelines would undoubtedly dry up when the partners retired, and the culture of tolerance meant little had been done to build business development skills among partners.
In addition, the more junior partners faced a significant image issue. They had spent so long in the shadows of their firm’s rainmakers that they were not widely known on their own merits. Fortunately, they had been quite successful independent of the senior partners. This meant that there was much they could say to prospective and existing clients about how their experience would benefit them as clients of the firm. Unfortunately, talking to clients and prospective clients one at a time is costly, especially because the price paid is often in the form of forfeited revenues from other bill opportunities.
To improve their primary sales channel’s financial performance, the plan proposed two strategies: improve the way the team was managed relative to business development and provide leverage through increased visibility of individual partners and their success in the marketplace.
Improving channel management efforts involved structuring incentive-based compensation, adding group training, formalising business development processes and providing individual coaching to partners. The budget for these changes, including the time for partners and staff involved in the process and external consultants, was $340,000 in the first year of the plan and $120,000 for each year thereafter.
To gain leverage, the firm planned to invest in aggressive media relations, small seminars, blogs and a variety of other public relations activities. The estimated cost for this effort, including partner and staff time, costs for materials and costs for external consultants was $185,000 per year for each year of the marketing plan.
Whereas the expenses could be evaluated independently, the outcomes could not. Because the goal of the promotional efforts was to provide leverage to the partners in their business development efforts, the potential returns were dependent on the partners’ execution on their business development plans. Similarly, the impact of the partners’ business development efforts would be dramatically affected by the promotional efforts involved.
Estimating potential returns took careful consideration. Each partner looked at his or her own record of success, his or her network and the volume of work available and estimated, with the help of the executive team and our firm, what impact an increased focus could have on their revenue streams. On average, the partners estimated that, with focus, each partner could add an additional $20,000 in revenues in the first year, $30,000 in the second and $45,000 in the third year, to their existing performance. Hiuuka compared these estimates with those of similar firms in other geographies and concluded that these estimates were realistic.
Table 11-1 summarizes the financial outcomes expected in conjunction with Greeley & Associates’ marketing plan, as calculated by their CFO, Anna Hiukka.
Table 11-1: Anticipated Revenue and Expenses Associated with Greeley & Associates’ 3-Year Marketing Plan
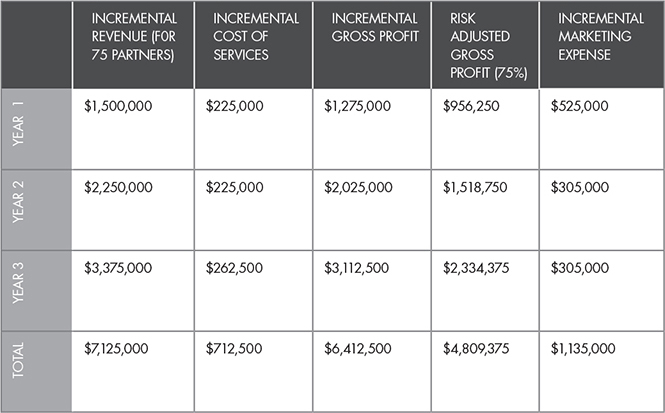
However, when Hiuuka calculated the net potential impact, she was concerned that the programme might be over-optimistic. Even with focused efforts, altered compensation structures, training and promotional support, she felt that some partners would be likely to fail. For purposes of evaluation, Hiuuka proposed adjusting the calculated outcomes to accommodate the risk of non-compliance. The net anticipated return on investment for these programmes, even after adjustments, was solid at 324%, and she recommended that the partnership approve the plan.
Case Study #3: Increasing Precision Through Analytics
In many respects, small companies and professional service organisations have a significant advantage over larger companies. Because decision-makers are closer to their customers, it is easier to see and understand the impact of specific marketing activities and make decisions as a result.
Middle-market and larger clients tend to be farther from those decision points, with a much larger and more diverse team coordinating a broad range of activities targeted at markets around the world. On the other hand, they typically have the data advantage, particularly if they sell to consumer markets. Middle market and large business- to- consumer companies that sell products either directly or through retail channels often have access to deep stores of sales data that can provide exceptional insight into the outcomes of their marketing activities. The volume of data makes it difficult for a single individual to glance at the numbers and easily spot trends, but more complex analytical models enable companies, or even individual divisions, to make informed marketing allocation decisions and improve the precision with which they measure results. The process is complex, but it yields significant pay off, particularly when investments in channel promotions and selling motion programmes are heavy.
To illustrate, consider the case of the largest global manufacturer of technology components, ABC Technology. This organisation has numerous divisions. One of the largest divisions manufactures products sold to both businesses and independent consumers through brick-and-mortar retailers. To improve sales, the company invests significantly in a variety of point-of-purchase programmes designed to improve the outcomes of specific steps in the purchasing decision process.
The executives at ABC Technology knew that the programmes delivered different returns in different stores, and they suspected there was an optimal investment amount, which probably varied depending on the geography and other factors. Based on experience, they knew that when they invested less than this amount, they would likely forfeit sales to competitors. If they invested more than this amount, the incremental investment would yield less in returns than it would cost to deliver.
Although they had millions of data points about sales and promotional efforts in various retail environments, they had not been successful at determining what the optimal investment level was. In addition, they knew that sales were affected by external factors, such as seasonality in sales, the size and demographics of the geography the store served, as well as other marketing investments, and they were unsure how to isolate those factors from the returns the investments generated so that they were comparing investments on equal terms. Finally, because they were running from one to several programmes in stores, they were also unsure which of the programmes were most effective and how to optimise returns.
Unlike the previous two case studies, the investments ABC Technology was making were very large. How could the company’s management team make sure the investments are at the optimal level?
By building complex analytical models.
Working with marketing, finance and IT professionals, the division’s management team developed a model that was able to isolate the outcomes of investments from other external factors and determine how to optimise the returns that could be generated.
Once the tool was developed, they found it had other useful applications. Not only did it help ensure ABC Technology was generating the best possible return on its marketing activities, the management team used it to monitor and compensate vendors on performance. When ABC Technology was ready to introduce new, experimental promotional programmes, the model provided a baseline to analyse impact and helped determine whether the new programmes should be added to the mainline mix of marketing programmes in the future.
Although there is a cost for the development of these types of analytical tools, the benefits are substantial. By optimising investments prior to budget approval, the company avoids poor marketing investments and ensures the optimal results.
This type of approach works best with middlemarket and large companies that have significant data regarding sales. Generally, these will be manufacturers whose products have large markets, such as consumer products. However, large consumer service-based organisations, such as restaurant chains or hair salons, might also be able to use sophisticated modelling to improve returns on marketing investments.
RISK ADJUSTMENT
The measurement approach a company selects will depend on the market’s decision criteria, the purchasing process, the availability or lack of data, the size of the investment and risk associated with mistakes. In many cases, different models will be used for different aspects of the marketing mix. Whatever the model, there will be some assumptions made, and with those assumptions, varying levels of risk.
There are two ways to mitigate risk associated with assumptions other than building complex analytical models, as in case study # 3. The first is to adjust expected outcomes. To do so, the executive team should ask the team who built the plan and associated financial models about the critical assumptions and their confidence level relative to success. The team can then decide to reduce the expected returns until the team is confident the outcomes are realistic.
Although this, too, entails making assumptions, the process of identifying risk and discussing exposure can both improve planning and cause the financial modelling to become more conservative. With practice, over time, the organisation will become more adept at understanding outcomes, and the financial models will become more accurate.
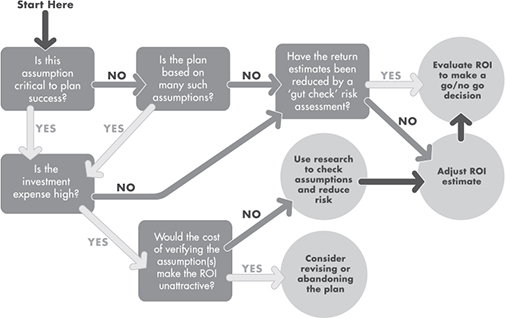
The second way to mitigate risk is to turn assumptions into facts, or at least stronger assumptions, through formal or informal research or historical performance data. Of course, not all assumptions are risky enough to consider modifying anticipated returns. On the other hand, too many assumptions may indicate that a plan has not been thoroughly evaluated. To determine which assumptions are acceptable and which ones are too risky, use the simple decision tree outlined in figure 11-2.
Figure 11-2: Risk Assessment Decision Tree
To illustrate, consider a non-profit organisation that is discussing the addition of another development officer for major gifts. A major gifts officer is a person who encourages donors to make significant financial gifts to an organisation. These gifts may range from $10,000 to millions of dollars or more, depending on the size and nature of the organisation. In the non-profit world, development officers are part of the placement ‘P’ of marketing. They are the organisation’s sales force.
Let’s also assume that the organisation already has two major gift officers. Both were able to develop a certain contribution revenue level within a given time frame. The organisation has a long list of potential donors that they can’t nurture because they are too busy. The organisation assumes that an experienced new hire with the right qualifications can bring in at least 80% of that same amount within three years.
Let’s say you are evaluating the risk based on the risk assessment decision tree in figure 11-2. Starting at the top left of the decision tree, is that assumption critical? Yes. Is the investment expense high? Let’s assume that, relative to other investments in marketing this organisation is making, this investment is small. No, the investment expense isn’t high.
Have you ‘gut-checked’ the returns? Yes—it’s reasonable to assume they could do the same, but to account for some doubt, or risk, you’ve downgraded the estimated returns to 80%. In this case, the executive team can simply evaluate the expected return on investment (ROI) and make its funding decision. However, if the results had not been adjusted based on confidence, this process may have prompted an evaluation of confidence, resulting in an adjusted ROI.
Now, let’s assume that this is a material investment for this particular non-profit. In this case, the organisation may want to try to reduce its risk. There are several ways it could do this. It could conduct research about what makes a major gift officer successful in their organisation, and perhaps, increase the pre-employment testing or evaluation process for candidates to make sure it hired a person with the right skills and experience. It could also do some market research to understand how big the market of major donors is, whether the organisation appeals to their interests and what might influence donor decisions. If the cost of mitigating significant risks changes the investment portion of the equation enough that the ROI is no longer attractive, then the organisation might consider abandoning the plan.
If the executive team is so confident in its assumptions that it doesn’t consider any single assumption to be critical, it should consider whether the number of assumptions overall is too large. If so, they may want to consider the potential risk of the assumptions overall, rather than individually.
RETURN ON MARKETING INVESTMENT
Many non-marketing managers object to the term ROI as it applies to investments in marketing, largely because marketing expenditures are less frequently associated with fixed or tangible assets. ROI, they argue, can only be associated with a long-term investment, such as the purchase of a building or piece of equipment. However, this argument fails in two ways.
First, in many ways, marketing is a long-term investment. From product development timelines, to the amount of time it takes to generate returns on marketing investments, marketing is often a long-term investment with an even longer-term payoff.
Second, marketing is the hidden assumption in almost every other financial model. When a company estimates the potential revenue associated with a new facility, it assumes that the products produced there will sell, an idea driven by marketing.
Unfortunately, this resistance to measuring marketing outcomes in financial terms is often welcomed by marketers, who often have less experience creating the financial models required to assess impact.
At the same time, marketers have been under greater pressure to demonstrate the impact of their activities on a company’s financial performance. As a result, they created a new term, return on marketing investments (ROMI), which is an effort to acknowledge the difference between investing in a tangible asset and investing in marketing activities while still providing financial measurement of value.
The calculation is the same as it is for ROI. ROMI is defined as a percentage and is generally considered to be the net revenues attributable to marketing efforts divided by the marketing expenditures required to generate those returns. It is expressed as a number of times the investment is made, or a 1 is subtracted from the results in order to translate it into a percentage format. Written as a formula, ROMI is expressed as follows:

In this format, the number would be expressed as the number of times the investment is returned. For example, if a company expects to sell $100,000 in widgets, from which it generates incremental revenue of 20%, and will spend $10,000 to do so, the ROI is expressed as follows:

More frequently, ROMI is expressed as a percentage. To accomplish this, the marketer either subtracts the dollar amount of the marketing investment from the numerator or subtracts 1 from the outcome. For example:
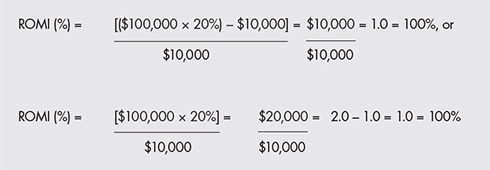
These are the same formulas used to express ROI.
Some marketing professionals argue that ROMI underestimates the long-term impact on the company because it is more difficult to measure the long-term impact of brand awareness or other benefits of marketing. Although brand awareness is an important outcome of many marketing initiatives, it is an intermediate metric. Awareness only has value to the extent that it contributes to financial outcomes. If a company is no longer in business, it does not matter how many people recognise its name. Those marketing dollars have not produced an impact. In addition, brand awareness fades if not sustained over time with additional marketing investments.
Greater levels of brand awareness can increase the anticipated return rates on marketing investments because the products or services they promote will be more readily accepted by the market. However, because the manager calculating incremental revenue is doing so based on his or her understanding of his or her company’s market and the potential impact given their existing brand awareness and market penetration, the impact of brand is already accounted for in the calculations.
Whether a company uses ROMI or ROI as its favoured term is irrelevant. In either case, understanding the anticipated return on marketing-related investments can help an organisation make informed investment decisions, both relative to specific marketing activities and to investments in other aspects of its operations.
QUESTIONS FOR NON-MARKETING MANAGERS TO ASK ABOUT MEASUREMENT AND RETURNS
What return do you expect on this investment? Over what time period?
How confident are you that we will achieve these returns? What are the greatest risks associated with the plan? What would cause the plan to fail to achieve the anticipated outcome?
What assumptions are built into the financial modelling of returns? How significant are they relative to the plan’s success?
How will the outcomes be affected if we have a serious economic downturn or other unforeseen event?
If we have another dollar to allocate to marketing expenditures, where would you invest it in order to generate the maximum return?
What alternative investments were considered?
What would happen if we removed a tactic in which we’ve invested historically? What would we anticipate the impact to be, and over what timeline?
How will you track progress against the plan to ensure we are on track?
How does this investment compare with other marketing investments we have made and are making? Does this investment contribute to or enhance other programmes? When adding this investment into the basket of marketing investments we are making, does our overall return go up or down?
CHAPTER 11 SUMMARY
Many executives consider marketing to be more art than science, eluding measurement as a result. I call this the Measurement Myth, and it is both untrue and a sign of poor marketing management. Carefully anticipating financial returns on proposed marketing plans and ensuring that the company has the required systems in place to track outcomes is the final step in the process of evaluating proposed investments in the marketing function.
Financial returns on marketing investments can, and should, be measured at least twice in the marketing process: in anticipation of expenditures (prior to approving the budget) and after the outcomes have been achieved. Many companies measure ROI, or ROMI, more frequently.
Although many companies measure marketing after the investment has been made, or at least try to do so, measuring in anticipation of the investment is even more important. Anticipating returns
facilitates monitoring;
facilitates comparison;
minimises poor investment decisions;
improves the effectiveness of using intermediate metrics to track progress against plan objectives;
improves the accuracy of intermediate and retrospective measurements; and
encourages communication among internal groups about organisational objectives.
A variety of models can be used to anticipate outcomes for all types of marketing efforts. The selection of the model will be made based on the type of business, the size of the market, the availability of historical data, the risk associated with the investment decisions and a variety of other factors. Although all models contain assumptions, assumptions represent risk, and the quantity and significance of those assumptions should be considered when assessing potential financial returns. Because the time frame for experiencing results will vary from one marketing activity to another, the non-marketing manager should work closely with the marketing team to establish a realistic timeline for the returns and the investment.
The most common financial ratio used to assess returns on investments is ROI. Marketers often use a variation on this metric, ROMI, or return on marketing investment. However, the math is the same. In either case, ROI and ROMI are calculated as follows: