
Chapter 8 - Collect Statistics
“The non permanent appearance of happiness and distress, and their disappearance in due course, are like the appearance and disappearance of summer and winter seasons.”
The Teradata Parsing Engine (Optimizer) is Cost Based
The Parsing Engine (PE) is often referred to as the Teradata Optimizer and it will actually generate several plans to choose from and ultimately choose the one with the lowest cost of resources. This is critical to performance in supporting mixed workloads ranging from OLTP to large joins and Decision Support (DS). All cost based optimizers require statistical information about the data and the machine resources (CPU, disk, memory, processors, etc.).
The other type of optimizer is a rules based optimizer which is designed for transactional On-Line Transaction Processing (OLTP) workloads where queries are well known and the data has been logically and physically structured to support OLTP workloads.
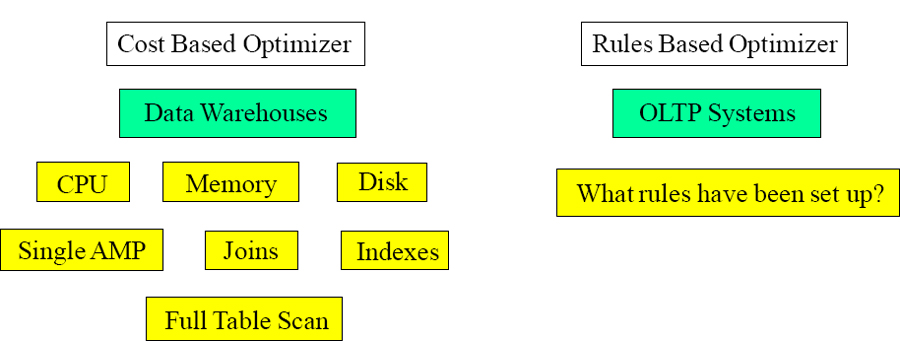
A cost based optimizer is much better than a rules based optimizer for data warehouses.
The Purpose of Collect Statistics
The Teradata Parsing Engine (PE) is in charge of creating the PLAN for the AMPs to follow. The PE works best when Statistics have been collected on a table. Then it knows:
- The number of rows in the table
- The average row size
- Information on all Indexes in which statistics were collected
- The range of values for the column(s) in which statistics were collected
- The number of rows per value for the column(s) in which statistics were collected
- The number of NULLs for the column(s) in which statistics were collected
The purpose of the COLLECT STATISTICS command is to gather and store demographic data for one or more columns or indices of a table or join index. This process computes a statistical profile of the collected data, and stores the synopsis in the Data Dictionary (DD) inside USER DBC for use during the PE's optimizing phase of SQL statement parsing. The optimizer uses this synopsis data to generate efficient table access and join plans. Do NOT COLLECT Statistics on all columns in the table.
When Teradata Collects Statistics it Creates a Histogram

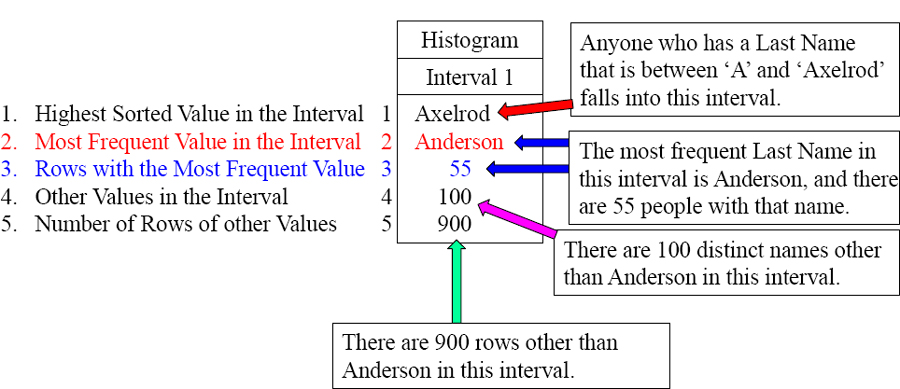
When statistics are collected, Teradata does a full table scan, sorts the column or index, places them into a default of 250 intervals, and then provides the above Histogram.
1. Highest Sorted Value in the Interval
2. Most Frequent Value in the Interval
3. Rows with the Most Frequent Value
4. Other Values in the Interval
5. Number of Rows of other Values
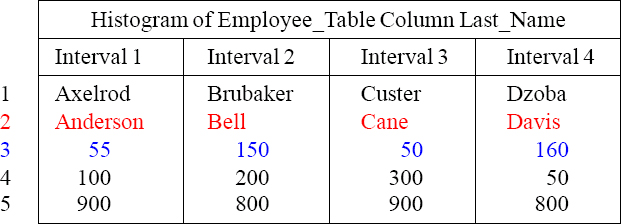
This is what is stored in statistics. This is tricky to understand at first, but recognize first that there are 55 people with a Last_Name of Anderson, 150 Bells, 50 Canes, and 160 with the name Davis. Each interval shows the most popular value and row count.
The Interval of the Collect Statistics Histogram
The PE now knows there are 55 Andersons in the table, and it assumes for any other name falling between ‘A’ and ‘Axelrod’, that there are 9 values for each (900 / 100 = 9)
When statistics are collected, Teradata does a full table scan, sorts the column or index, places them into a default of 250 intervals, and then provides the above Histogram. This is what the PE uses to build a plan. Above you see only interval one of 250.
Histogram Quiz
1. Highest Sorted Value in the Interval
2. Most Frequent Value in the Interval
3. Rows with the Most Frequent Value
4. Other Values in the Interval
5. Number of Rows of other Values
- Which Interval would the PE look to find the Last_Name of ‘Apple’? _______
- How many people are in the Employee_Table with a Last_Name of ‘Davis’? _____
- In Interval 2, how many other names are there other than ‘Bell’? __________
- How many people named ‘Baker’ would Teradata estimate? ____________
- How many people name ‘Donaldson’ would Teradata estimate? ___________
- How many people named ‘Cooper’ would Teradata estimate? ___________
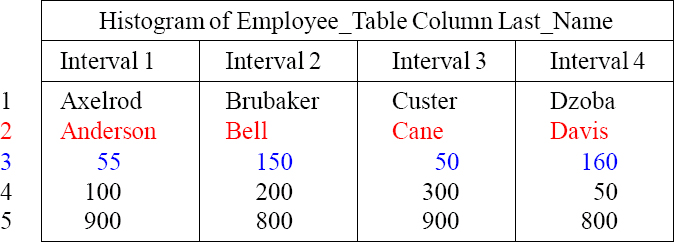
Answers to Histogram Quiz
1. Highest Sorted Value in the Interval
2. Most Frequent Value in the Interval
3. Rows with the Most Frequent Value
4. Other Values in the Interval
5. Number of Rows of other Values
- Which Interval would the PE look to find the Last_Name of ‘Apple’? Interval 1
- How many people are in the Employee_Table with a Last_Name of ‘Davis’? 160
- In Interval 2, how many other names are there other than ‘Bell’? 200 other names
- How many people named ‘Baker’ would Teradata estimate? 4 (800 / 200)
- How many people name ‘Donaldson’ would Teradata estimate? 16 (800 / 50)
- How many people named ‘Cooper’ would Teradata estimate? 6 (900 / 300)
What to COLLECT STATISTICS On?
You don't COLLECT STATISTICS on all columns and indexes because it takes up too much space for unnecessary reasons, but you do collect on:
- All Non-Unique Primary Indexes and All Non-Unique Secondary Indexes
- Non-indexed columns used in joins
- The Unique Primary Index of small tables (less than 1,000 rows per AMP)
- Columns that frequently appear in WHERE search conditions or in the WHERE clause of joins
- Primary Index of a Join Index
- Secondary Indexes defined on any join index
- Join index columns that frequently appear on any additional join index columns that frequently appear in WHERE search conditions
The first time you collect statistics you collect them at the index or column level. After that, you just collect statistics at the table level and all previous columns collected previously are collected again. It is a mistake to collect statistics only once and then never do it again. COLLECT STATISTICS each time a table's data changes by 10%.
Why Collect Statistics?
What does collect statistics do to help the PE come up with a better plan?
- Access Path – The PE will easily choose and use any Primary Index access (UPI or NUPI), and it will also easily choose a Unique Secondary Index (USI). But statistics really help the PE decide whether or not to do a Full Table Scan, or use a Non-Unique Secondary Index (NUSI), or if it can use multiple NUSI's ANDed together to perform a NUSI bitmap.
- Join Method – When you collect statistics, it gives Teradata a better idea whether or not to do a merge join, product join, hash join or nested join.
- Join Geography – When two rows are joined together, they must physically be located on the same AMP. The only way that this happens naturally is if the join column (PK/FK) is the Primary Index of both tables. Most of the time, this is not the case and Teradata must decide the Join Geography of how it will relocate the rows to co-locate them on the same AMP. Will it redistribute (rehash by the join column) one or both of the tables, or will it duplicate the smaller table across all AMPs? A redistribution or duplication are the paths to co-location.
- Join Order – All joins are performed two tables at a time. What will be the best order to join the tables together? When two or more tables are involved, this becomes very important.
It is the access path, the join method, the join geography, and the order that makes statistics collection so vital to all Teradata systems.
How do you know if Statistics were Collected on a Table?
Syntax: HELP Statistics <Table Name>
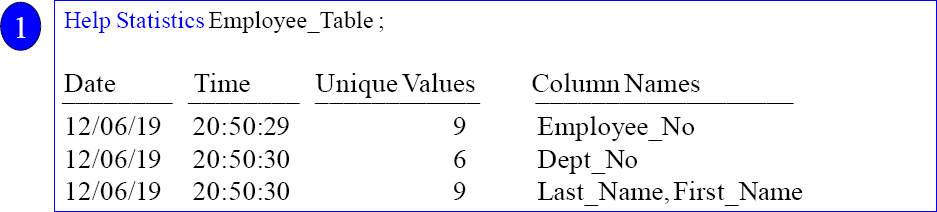
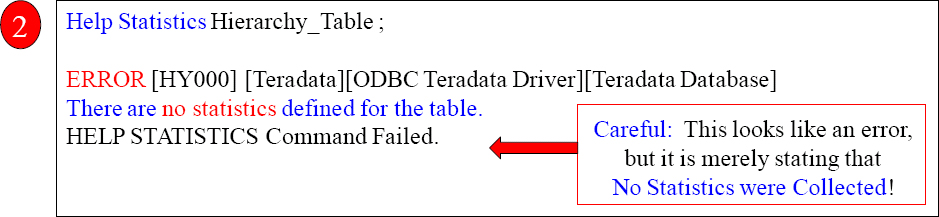
The HELP Statistics command will show you what statistics have been collected or specifically tell you that no statistics were collected on the table.
A Huge Hint that No Statistics Have Been Collected
EXPLAIN SELECT * FROM New_Employee_Table ;
3) We do an all-AMPs RETRIEVE step from SQL_CLASS. New_Employee_Table by way of an all-rows scan with no residual conditions into Spool1 (group_amps), which is built locally on the AMPs. The size of Spool 1 is estimated with low confidence to be 12 rows (684 bytes). The estimated time for this step is 0.03 seconds.
COLLECT STATISTICS ON New_Employee_Table
Column Employee_No ;
EXPLAIN SELECT * FROM New_Employee_Table ;
3) We do an all-AMPs RETRIEVE step from SQL_CLASS.New_Employee_Table by way of an all-rows scan with no residual conditions into Spool1 (group_amps), which is built locally on the AMPs. The size of Spool 1 is estimated with high confidence to be 9 rows (513 bytes). The estimated time for this step is 0.03 seconds.
If you run an Explain on a query, and the row estimate has No Confidence or Low Confidence, then that is a sign that no statistics were collected. Notice how the Explain above changed to High Confidence after we collected statistics on the table.
The Basic Syntax for COLLECT STATISTICS
Here is the syntax for collecting on columns and indexes.
| COLLECT STATISTICS on <Tablename> COLUMN <Column Name > ; |
|
| COLLECT STATISTICS on <Tablename> INDEX (<Column Name(s)>); |
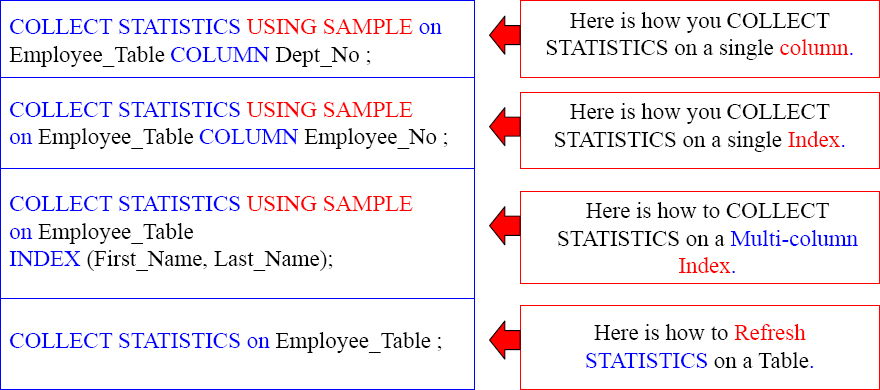
Here are three actual examples
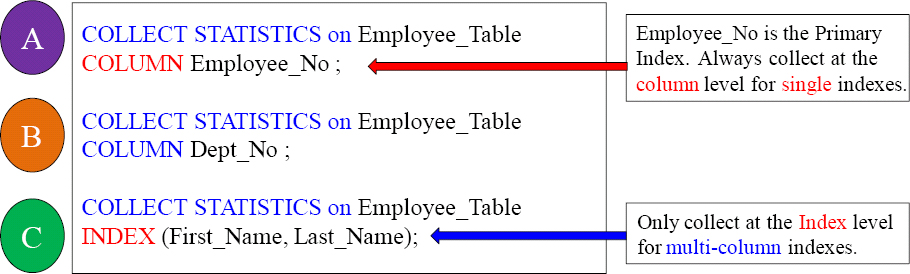
The example commands above provide good fundamentals and concepts to follow.
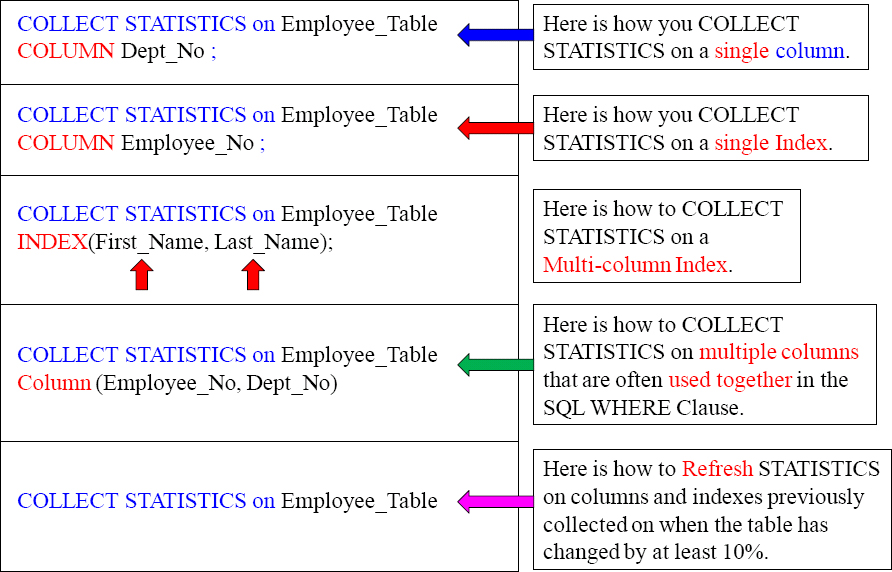
COLLECT STATISTICS Examples for a better Understanding
The New Teradata V14 Way to Collect Statistics
In previous versions, Teradata required that you had to Collect Statistics for each column separately, thus always performing a full table scan each time. Those days are over!
| Old Way | New Teradata V14 Way |
| COLLECT STATISTICS COLUMN (First_Name, Last_Name) ON Employee_Table ; COLLECT STATISTICS COLUMN (First_Name) ON Employee_Table; COLLECT STATISTICS COLUMN (Dept_No) ON Employee_Table; |
COLLECT STATISTICS COLUMN(First_Name, Last_Name) , COLUMN(First_Name) , COLUMN(Dept_No) ON Employee_Table; |
The new way to collect statistics in Teradata V14 is to do it all at the same time. This is a much better strategy. Only a single table scan is required, instead of 3 table scans using the old approach. This is an incredible improvement.
The Official Syntax for COLLECT STATISTICS
| Syntax 1 |
COLLECT STATISTICS [ USING SAMPLE ]
ON [ TEMPORARY ] { <table-name> | <join-index-name> | <hash-index-name> }
[ COLUMN { <column-name> | (<column-list>) }
| [ UNIQUE ] INDEX { <index-name> [ ALL ] | (<column-list>) }
[ ORDER BY { HASH | VALUES } [ <column-name> ] ] ] ;
| Syntax 2 |
COLLECT STATISTICS [ USING SAMPLE ]
[ COLUMN { <column-name> | (<column-list>) }
| [ UNIQUE ] INDEX { <index-name> [ ALL ] | (<column-list>) }
[ ORDER BY { HASH | VALUES } [ <column-name> ] ] ]
ON [ TEMPORARY ] { <table-name> | <join-index-name> | <hash-index-name> } ;
How to Re-COLLECT STATISTICS on a Table
Here is the syntax for re-collecting statistics on a table.
COLLECT STATISTICS ON <Tablename> ;
Below is an actual example
COLLECT STATISTICS ON Employee_Table;
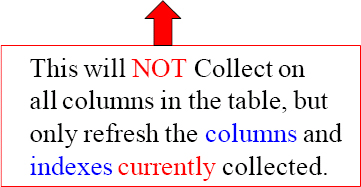
The first time you collect statistics you do it for each individual column or index that you want to collect on. When a table changes its data by 10% due to Inserts, Updates, or Deletes you merely use the command above and it recollects on the same columns and indexes previously collected on.
How to Copy a Table with Data and the Statistics?
This next example is pretty amazing. Assume that the original Employee_Table had COLLECT STATISTICS on the columns Employee_No and Dept_No. The new table we have called Employee_Table_New will have DDL exactly like the Employee_Table plus data plus the statistics. Yes, the exact same statistics will be copied to the new table. Below is the actual example!
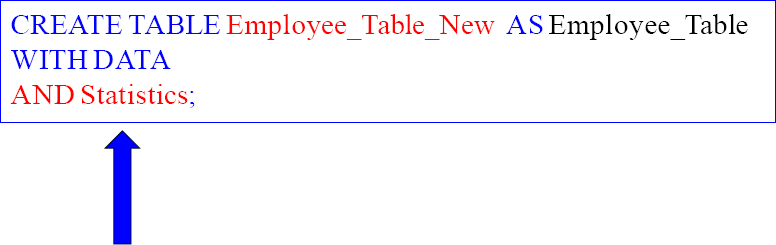
The example above will CREATE a new table called Employee_Table_New, and it will have the exact same DDL as the Employee_Table, the exact same data, and the exact same statistics.
How to Copy a Table with NO Data and the Statistics?
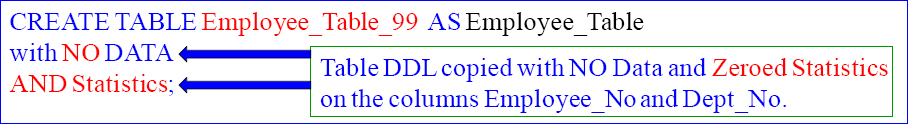
This next example is clever. Assume that the original Employee_Table had COLLECT STATISTICS on the columns Employee_No and Dept_No. The new table we have called Employee_Table_99 will have DDL exactly like the Employee_Table but NO data. It will have the Statistics, but they will be Zeroed Statistics.
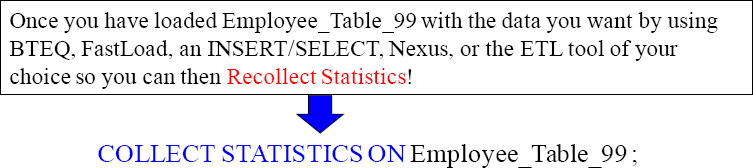
You have just Re-Collected Statistics on Employee_Table_99 for the columns Employee_No and Dept_No. The easy re-collection on the columns previously collected on (after the data is loaded) was the entire purpose of getting the Zeroed Statistics in the first place. Make sure you recollect after your data is loaded though!
When to COLLECT STATISTICS Using only a SAMPLE
You might consider Collecting Statistics with SAMPLE if:
| You are collecting statistics on a very large table. | |
| When collecting statistics becomes a problem with system performance or cost because the system is so busy. |
Don't consider Collecting Statistics with SAMPLE if:
| The tables are small. | |
| To replace all existing full scan Collect Statistics. | |
| If the column's data is skewed badly. |
COLLECT STATISTICS can be very time consuming because it performs a full table scan and then performs a lot of statistical calculations. Because Collect Statistics runs infrequently and benefits query optimization, it is considered a necessary task. Without statistics, query performance will suffer. The bad news about sampled statistics is that they may not be as accurate, which could negatively affect the PE's plans. In most cases, sampled statistics are better than no statistics. Don't use Sample unless necessary!
Examples of COLLECT STATISTICS Using only a SAMPLE
If you recollect statistics on a sample, it recollects with the same sample amount!
Sampled statistics are generally more accurate for data that is not skewed. For example, columns or indexes that are unique or nearly unique are not skewed. Because the PE needs to be aware of skewed data, you should not collect with sample on skewed data. That is why sampling is generally more appropriate for indexes than non-indexed column(s). If you recollect statistics on a Sample, it Recollects with the same Sample!
Examples of COLLECT STATISTICS For V14
To collect sample statistics using the system default sample:
COLLECT STATISTICS USING SYSTEM SAMPLE COLUMN (Product_ID) ON Sales_Table;
To collect sample statistics by scanning 15 percent of the rows and use 100 intervals:
COLLECT STATISTICS USING SAMPLE 15 PERCENT AND MAXINTERVALS 100
COLUMN (Product_ID) AS Product_Stats ON Sales_Table;
To change sample statistics to 20 percent (for Product_ID) and use 250 intervals:
COLLECT STATISTICS USING SAMPLE 20 PERCENT AND MAXINTERVALS 250
COLUMN (Product_ID) AS Prod_Stats ON Sales_Table;
To display the COLLECT STATISTICS statements for a table:
SHOW STATISTICS ON Sales_Table;
To display statistics details – summary section, high bias values, and intervals:
SHOW STATISTICS VALUES COLUMN Product_ID ON Sales_Table;
How to Collect Statistics on a PPI Table on the Partition
Here is the syntax for collecting statistics on a PPI table:
COLLECT STATISTICS on <Tablename> COLUMN PARTITION;
Here is an actual example:
COLLECT STATISTICS on Order_Table_PPI COLUMN PARTITION;
Three reasons to Collect on the Partition:
| The Parsing Engine will have a better plan for PPI Tables. | |
| This helps the most with Partition Elimination on Range Queries. | |
| This is especially helpful when a table has a lot of empty partitions. |
The Parsing Engine can use this information to better estimate the query cost when there are a significant number of empty partitions. If PARTITION statistics are not collected, empty partitions may cause the Parsing Engine to underestimate the number of rows in a partition. You shouldn't use WITH SAMPLE to collect on Partitions.