KPIs Applied: The Case of the Contradictory KPIs
Business Environment
The Metropolitan Convention Center (The Metro) has been in operation for five years. Before opening, they made a decision to pursue a business model focused on the facility; its functionality, appearance, marketing and promotion, and space sales. They resolved to be discriminating about sales, with the objective of finding reliable high-quality retained events, which could be flexible about event dates. They would pursue events from economic sectors that fit or complemented the city and region’s economic development plans. Lastly, they would fill weekends and holiday seasons with entertainment and consumer shows appealing to hobbyists, sports, and culture (no flea markets).
Metro management felt confident in their decision to use exclusive contractors for services. They were highly selective and saw little risk in awarding longer terms in exchange for a better commission structure, bonus commissions for exceeding revenue goals, generous investment in certain infrastructure, equipment, and contributions to Metro’s marketing and promotion budget. All the contractors had a strong regional presence and a good “bench” for management and key employees. Metro was glad to have the reduced HR responsibilities of running large temporary work forces and the many administrative tasks associated with order taking and fulfillment.
They were off to a good start. Service complaints were much less than expected and event organizers, exhibitors, and attendees were generally pleased. Metro operated at a deficit as was expected, but in 2018, the company experienced its first year of positive cash flow. All believed this was as a direct result of more events and improving occupancy and GSF Rented. Improved event attendance also contributed.
There was genuine surprise when the problem surfaced. The expectation was that 2019 would follow the same positive trends. However, some managers had noticed that monthly revenues for utility services, cleaning, and communications were all behind plan. Now, in the quarterly review of KPIs, the productivity metric of Profit and Commissions /GSF Rented clearly showed a decline (Figure 5.1). Table 5.1 in Metro’s Core KPI Review for the 2nd quarter, 2019 showed more detail.
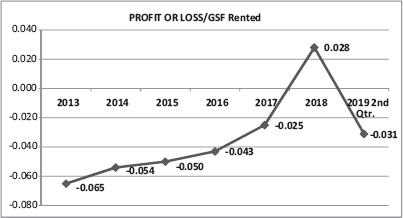
Figure 5.1 Profit or loss per GSF Rented
METRO CONVENTION CENTER - CORE KPI REVIEW - 2019 2nd Qtr. |
|||||
Year |
GSF Rented |
Occ. Rate |
Earned Revenue |
Profit or (Loss) |
P or L /GSF Rented |
2013 |
3,918,000 |
39% |
3,275,500 |
-252,945 |
-0.065 |
2014 |
4,195,000 |
41% |
3,565,500 |
-227,858 |
-0.054 |
2015 |
4,332,000 |
44% |
3,875,400 |
-215,027 |
-0.050 |
2016 |
4,560,500 |
44% |
3,675,500 |
-194,671 |
-0.043 |
2017 |
5,280,500 |
45% |
4,075,500 |
-133,750 |
-0.025 |
2018 |
5,482,000 |
48% |
4,875,500 |
150,762 |
0.028 |
2019 2nd Qtr. |
2,759,500 |
50% |
2,685,350 |
-86,614 |
-0.031 |
Table 5.1 - Metro Convention Center- core KPI review - 2nd qtr. 2019
Senior management, board members, and stakeholders were generally pleased but there was concern about the $86.614 loss and how it would affect the objective of remaining cash flow positive for 2019. How was this possible with the number of events, GSF Rented, and Occupancy Rate better than 2018 YTD? At first management believed there must be an accounting error somewhere. An investigative team was formed to explain what happened. Their investigation then followed this progression:
1. The team found expenses for the first two quarters of 2019 on plan.
2. The team interviewed contractor managers and learned that service orders for utilities, cleaning, and communications were less for four of the retained events the previous year. F & B orders for exhibit booth catering were also low. Several comments were passed that the events did not fill the exhibit hall space to the back of the halls and that there was wider aisles and many large seating lounges not seen before. Statistics and a graphic of the KPI for Profit & Commissions per GSF were again reviewed. It was agreed that the problem would have been revealed sooner if this KPI was reported monthly.
3. Item 2’s findings prompted the team to examine NSF for the events. The KPI for NSF/GSF Ratio was one of the KPIs Metro management decided not to incorporate into their program (Figure 5.2).
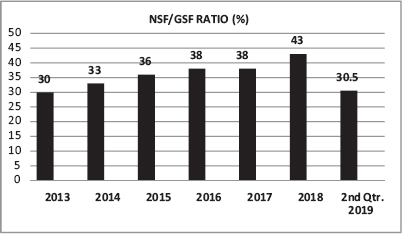
Figure 5.2 NSF/GSF rented ratio
4. The cause of the problem became clear. The steep drop in NSF/GSF ratio spoke loudly. The principal variable that changed and moved profit into loss was the drop in NSF.
The Cause
How did the drop in NSF and profit happen? There was more than one cause.
1. Bad Luck—Three things happened, which affected five events in the first half of the year:
• A retained IT event, which occupied the whole building, experienced a major drop in exhibitors who decided to exhibit at an up and coming competitive event in another regional city. The number of “anchor” exhibitors dropped considerably and when this was made known, it caused other exhibitors to do so too. Some forfeited their deposit, but the opportunity to exhibit at a better event where the anchors had signed as exhibitors made it immaterial. An individual examination comparing profit/NSF, which compared 2019 to 2018 was done. The finding showed a substantial drop from $.064/NSF to −$.103/NSF. Too many “anchor” exhibitors did not exhibit at the event. They typically would spend 10 times more on services than other exhibitors; high-voltage services, multiple hard wired internet lines, catered F & B in the exhibit booth, and so on.
• A well-known consumer show company had five consumer shows at Metro each year (golf, antiques, travel, outdoor sports, and a food and wine show). Two of the events were scheduled in January. Two of the events had used all the exhibit space as well as the ballrooms and most of the meeting rooms. The company had been sold to a private equity group in late 2017 but kept key managers. In the last quarter of 2018 they reorganized their sales team and replaced many
of the original team including the VP of Sales. They also increased exhibit space rent by 25%. The reaction from exhibitors was profound. Some protested and many decided not to exhibit. NSF reductions over the previous year were greater than 30%.
• A major retained event sold their February event to another lesser known company in the same business. The business was classic cars and the event included a large exhibit hall
for car display only, another exhibit hall for car accessories, and a major auction, which was normally well attended and often televised. The event organizer was local and operated a classic car showroom in the city. The organizer decided to sell this event and requested that Mertro permitted the organizer to assign the event’s License Agreement to the buyer. Metro agreed. There were no prospective event organizers who had expressed interest in those dates and there was no time to fill the space and dates with a new event. The decision to agree to the assignment was seen as a good risk. Unfortunately
the classic car owners and collectors thought differently. Their participation was the core of the event and they lost confidence their cars would sell at high auction prices. Many decided not to exhibit.
Things happen. The buying and selling of event companies or some of their assets occurs all the time. When new ownership takes over, management and the methods of conducting business change too. It’s a risk that convention centers should prepare for. In this case the preparation could have been better.
2. Metro management either didn’t understand and overlooked too many important KPIs in their program. I am reminded of a quote from the movie about major league baseball, Moneyball. The quote comes from a conversation between an aspiring statistician (played by actor Jonah Hill) and a team general manager (played by Brad Pitt). The Jonah Hill character is explaining performance metrics to Pitt’s character:
There is an epidemic failure within the game to understand what is really happening. And this leads people who run Major League Baseball teams to misjudge their players and mismanage their teams. . . . People who run ball clubs, they think in terms of buying players. Your goal shouldn’t be to buy players, your goal should be to buy wins. And in order to buy wins, you need to buy runs. You’re trying to replace Johnny Damon. The Boston Red Sox see Johnny Damon and they see a star who’s worth seven and half million dollars a year. When I see Johnny Damon, what I see is . . . is . . . an imperfect understanding of where runs come from.1
In this case Metro management had an imperfect understanding of earned revenue and the importance of NSF
• Metro management did not see the value of measuring and tracking NSF. Rents were based on GSF, not NSF, and they were satisfied to have financial reports, number of events, event attendance, GSF Rented, and Occupancy Rate as sufficient KPIs to track business performance.
• Some KPI reporting frequencies were too long an interval. A monthly KPI report of Profit/GSF Rented vs. quarterly would have revealed problems sooner.
• Metro management’s decision to use exclusive contractors for services was well-conceived, but there were some unforeseen problems: Contract terms left no requirement that productivity metrics be reported. Metro was satisfied to rely on quarterly reporting of commissions and number and nature of service complaints to judge contractor performance.
There were two more probable causes:
• Exclusive contractors failed to report what should have been an observed difference in the number, timing, and pace of orders received from exhibitors vs. the previous year. The 2018 problem could have been anticipated earlier; or
• Exclusive contractors did inform Metro management, but the reports were dismissed because the other KPIs looked so favorable.
Actions Taken
1. In order to remain at a positive cash flow for the year, the investigative team believed that the NSF/GSF ratio would improve. The business issues regarding low NSF did not apply to most of the upcoming events and those that did would be resolved. The team calculated the five-year average of NSF/GSF ratio 36.5 percent. With that, profit/GSF Rented would have to improve to $0.06/GSF Rented or greater. This estimate would be confirmed or updated as Sales would ask upcoming events directly what their NSF had been elsewhere and what they anticipated at Metro. All departments, not just those directly involved with events, would have to control expenses as much as practical, a tough row to hoe.
2. Metro management resolved to conduct periodic business reviews of retained events where the agenda would include pointed questions about the event company’s management, changes in key positions, and, most importantly, how space sales were going. Event organizers will not want to show or predict what NSF will be, but you will have NSF history for retained events, so it’s a natural segue to talk frankly about it. In my time at the Javits Center, we made a routine of visiting the event organizer’s main offices well before an upcoming event. It was convenient for us as most of the organizers had offices in the NY metropolitan area. In the business review, we’d ask to see their sales floor plan, which was normally an oversized plan color coded for all to see. We’d ask questions about certain exhibitors and we would express our concerns and discuss them in a frank and honest way. We would leave the review meeting with a good sense of what NSF would be and how things were going in general.
3. Related to the above, the Metro sales team and managers of exclusive contractors were strongly encouraged to develop a business intelligence network of contacts. They were advised to use finesse in any conversations and not force others to compromise their relationship with event organizers. A useful network included hoteliers, GSCs, key past exhibitors, and other local suppliers who event organizers had used before.
4. Exclusive contractors were instructed to report any changes in the amount, timing, and pace of service orders received for upcoming events vs. previous years.
5. New KPIs were launched in the third quarter:
• NSF for each event using exhibit halls (monthly)
• NSF/GSF Ratio
• Operating Profit/Loss Statements for Each Event
• Profit or (Loss)/NSF from the Utility, Communications, and Cleaning exclusive contractors (monthly)
• Profit or (Loss)/GSF Rented from the F and B, Communications and Parking contractors (monthly)
• Exclusive Contractor Reporting of the Number of Orders Received vs. the Previous Year (60-, 30-, 10-, and 5-day intervals from event opening)
6. The reporting frequency for Profit/GSF Rented was changed from quarterly to monthly.
Lessons Learned
1. Convention centers will probably always be a low margin business and for those with an objective to remain cash flow positive, there is little room for error. Productivity metrics are sensitive to a lot of variables. Some variables you could control, others not. Things can go wrong very quickly and become out of control if not dealt with in a timely way.
2. When launching a KPI program, center management should not neglect KPIs for major revenue producing services whether from an exclusive contractor or an in-house operation.
3. In our business earned revenue and financial performance is largely about NSF.
4. KPI reporting frequency matters. For Metro, a quarterly review of certain KPIs should have been monthly.
5. Exclusive contractors, no matter their reputation and experience, have to be well integrated into the convention center service organization. They have to part of the KPI program and should “own” what’s appropriate. They have to be managed and held accountable as if they were employed as Metro managers.
6. The sales team should know their event organizers to a point where they can recognize “tells” and other subtle and unusual business actions. They need to keep management well advised of things they hear and observe.
1 Hill, Jonah, H. 2011. Moneyball. Television. Directed by Bennett Miller. Los Angeles, Columbia Pictures, https://en.wikiquote.org/wiki/Moneyball_(film) (accessed November 2019).