KPI: Operating Expenses Per GSF Rented
Owner |
The Finance Department |
Data Sources and Collection |
The Finance Department will provide the operating expense data. The Sales Department will provide GSF Rented |
Reporting Frequency |
Semi-annually |
Why This KPI Is Useful
This KPI is a statistic best utilized when making comparisons to other convention centers. At some point there may be a useful industry benchmark for comparison, researched and published by an academic source or an advocacy organization like the International Association of Venue Managers (IAVM).
Objective
Obtain a baseline metric for operating the convention center.
Managing an Unfavorable Conclusion or Inference
A baseline ratio or average history of this metric should first be determined before a judgment is made that it is unfavorable. Once a baseline is established, count on this KPI to enumerate the extent of the problem or lack of control over expenses. For most experienced managers who sense intuitively whether expenses are out of line, the KPI results are an affirmation and a cause to act. An audit conducted by in-house managers will probably find a lack of controls, wasteful policies, practices, work routines, and spending.
How to Calculate and/or Organize Data
1. Sum all operating expenses for reporting period.
2. Divide operating expenses by GSF Rented.
Presentation Notes and Formats
Table, bar graph, or both, comparing baseline year, current average, current year and previous year and business plan.
KPI: Amount and Percentages of Operating Expense Categories
Owner |
Finance Department |
Data Sources and Collection |
The Finance Department will provide this data |
Reporting Frequency |
Annually |
Why This KPI Is Useful
It’s a good management practice to know what categories of expense are the highest.
Objective
Obtain a knowledge base of expenses and their percent of total expenses.
Managing an Unfavorable Conclusion or Inference
Not applicable.
How to Calculate and/or Organize Data
1. These expense data are in the end of year Monthly Financial Report.
2. Divide each category’s expense by total operating expenses to calculate the percentage of each.
Presentation Notes and Formats
Table only is recommended. For some presentations there will be an inclination to display everything graphically. Sometimes less is more. Below is an example. The data are simple but the range from a low of 1.7% to a high of 37.5% makes for an awkward graphic. The segmented ring chart below doesn’t quite work either. In this case a simple table works better with less confusion and better comprehension (Table 4.1 and Figure 4.1).
PERCENTAGES OF ANNUAL EXPRNSES |
|
Payroll – Events |
37.5 |
Payroll –House |
27.1 |
Utilities |
20.1 |
Contract Services |
6.5 |
Materials and Supplies |
5 |
Insurance |
2.1 |
Professional Services |
1.7 |
Table 4.1 Percentages of annual expenses

Figure 4.1 Percentages of annual expenses
KPI: Amount and Percentages of Utility Costs Per Commodity
Owner |
Finance Department and Facilities Department |
Data Sources and Collection |
The Finance Department routinely collects and compiles operating expense details |
Reporting Frequency |
Quarterly |
Why This KPI Is Useful
It’s good management practice to know details about utility costs.
Objective
Obtain a knowledge base of utility cost comparisons by commodity. Also, with cost per commodity, productivity metrics can be calculated.
Managing an Unfavorable Conclusion or Inference
The expectation is that electric costs will always be a much higher percentage of utility costs. This is especially true for convention centers in regions with traditionally high commercial electric rates and hot and humid summers or desert-like temperatures as you may find in Las Vegas or Phoenix. These costs should be predictable. However commodity costs can increase unexpectedly; a water shortage during a severe drought, a natural gas supply problem if tropical storms occur where pipelines originate, or the sudden loss of a base load electric generating plant.
How to Calculate and/or Organize Data
1. Obtain expenses for each commodity.
2. Divide each commodity’s expense by total operating expenses to calculate the percentage of each.
Presentation Notes and Formats
Table, bar graph, or a tile or ring chart or both, comparing current YTD, previous YTD and YTD plan. See Figure 4.2:

Figure 4.2 Utility commodity cost percentage
KPI: Electric and Natural Gas Costs Per Thousand GSF Rented (KGSF)
Owner |
Finance Department and Facilities Department |
Data Sources and Collection |
The Finance Department routinely collects and compiles operating expense details. The Sales Dept. will provide GSF Rented expressed in thousands (KGSF). |
Reporting Frequency |
Monthly |
Why This KPI Is Useful
From time to time there will be high unplanned costs that require explanation. One obvious reason is that there was an event added to the schedule after the budget was approved or that some events grew in square footage unexpectedly. Another common reason is excessively high or low temperatures during a large weekday events. For more complete explanations, it’s best to also refer to other related “KPIs: Summer Peak Electric Demand, Date /Time of, and Cost,” found next in this chapter, or in “Energy Efficiency” found in Chapter 9. For natural gas, it’s best to look into “Energy Efficiency” found in the Chapter 9, or to ask your natural gas supplier.
Objective
Stabilized or gradual reduction in energy use based on business activity (KGSF). This KPI also provides a basis for forecasting utility usage.
Managing an Unfavorable Conclusion or Inference
Tracking energy costs based on business activity connects this expense to business activity. Tracking energy costs based on facility square footage alone does not accurately explain energy use, intensity, and peak electric demand. Unfavorable KPI results, especially if they cannot be attributed to an increase in business activity or an unexpected change in weather, have to be investigated thoroughly. There could be a breakdown in operating procedures, a lack preventive maintenance, malfunctioning equipment, and so on.
How to Calculate and/or Organize Data
1. Obtain expenses from monthly utility bills.
2. Divide monthly electric and natural gas costs by monthly KGSF.
Presentation Notes and Formats
Table, line graph, or both with brief narrative if necessary. Compare current YTD, previous YTD and business plan.
KPI: Peak Electric Demand—Date, Time of, and Cost
Owner |
Facilities Department |
Data Sources and Collection |
The Facilities Department can obtain most of this data from the monthly electric bill or from the utility itself if not included. |
Reporting Frequency |
Monthly |
Why This KPI Is Useful
It’s difficult to manage electric demand costs in a convention center. Overall demand costs are a significant fraction of electric utility costs especially for centers in regions where electric costs are high and hot and humid weather prevails. In my time at the Javits Center the highest peak demand would occur on weekdays in July or August when the entire building was occupied and the weather hot and humid. Recording when peaks occur, and noting the averages and time of day patterns won’t change the demand but it will provide a clear picture of cost control possibilities.
Objective
Obtain detailed knowledge of peak demand amounts and patterns of occurrence. This information is required in order to come up with a plan to reduce peak demand charges.
Managing an Unfavorable Conclusion or Inference
Obtaining the most detailed knowledge of the business activity, the weather, and the status of the HVAC plant on the day the monthly peak occurs is the first step in managing peak demand costs. High peak demand costs are always unfavorable, unpredictable, and in some cases beyond control. The findings this knowledge base reveals is necessary for a peak demand control program. A typical program consists of a low cost load shedding procedure for equipment which does not affect customers. A convention center that keeps pace with energy efficient advances and makes capital investments in commercially proven technologies will be ahead of the game in controlling the unpredictability of high demand costs. The conversion to high bay LED lighting systems is an excellent example (Figures 4.3 and 4.3a).
How to Calculate and/or Organize Data
As an example, see Work Sheet 4.1:
RECORD OF PEAK ELECTRIC DEMAND - SUMMER 2019 |
||||
Month |
Peak Demand (KW) |
Date/Day/Time |
Temp and RH |
Business Activity |
June |
25,035 |
June 10th/ Mon./ 2 -2:15 |
84 dgrees 70% RH |
One event moving in another Chem. Show open at 120K GSF |
July |
27,975 |
July 27th/ Tues./ 3:10 - 3:25 |
90 dgrees 70% RH |
Gift Fair open 659,000 GSF |
Aug. |
||||
Sept. |
||||
Work Sheet 4.1 – Record of peak electric demand
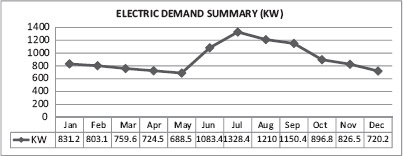
Figure 4.3 Electric demand summary – peak demand (KW)
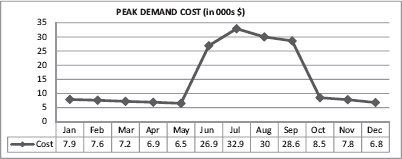
Figure 4.3a Peak demand costs
KPI: Cost and Percentages of Contract and Professional Services
Owner |
Finance Department. |
Data Sources and Collection |
The Finance Department routinely collects and compiles operating expense details. |
Reporting Frequency |
Semi-annually |
Why This KPI Is Useful
It’s a good management practice to monitor expense details and be able to explain deviations from plan. Contract services are normally related to on-site maintenance and other services having to do with facilities and building operations. Examples are high-voltage testing and maintenance and exterminating. Professional services include services such as legal, graphic design, marketing research, architectural/engineering, and accounting.
Objective
Achieve predictability for these costs and to set up a review of performance and pricing on a regular basis.
Managing an Unfavorable Conclusion or Inference
Usually the contract scope of services is well defined. A well-written contract would, of course, have a spending limit and require a higher level signing authority and a written explanation as to why additional spending is needed before proceeding. It takes a serious effort when composing the next year’s business plan. Line managers of different business units should be prepared to explain and defend their plan request especially if it is new or represents a significant increase over current spending.
How to Calculate and/or Organize Data
1. Obtain contract and professional service expenses. List contract and professional services separately.
2. Divide each service item by total operating expenses to calculate the percentage of each.
3. Maintain a running average of percentages.
4. Highlight and explain all items which are greater than or equal to a 10% increase over business plan.
Presentation Notes and Formats
Table, bar graph, or both, comparing current YTD to previous YTD and business plan. Include brief narratives if warranted.
KPI: Cost and Percentages of Event and House (Building Operations) Materials and Supplies
Owner |
Finance Department |
Data Sources and Collection |
The Finance Department routinely collects and compiles operating expense details. |
Reporting Frequency |
Semi-annually |
It’s a good management practice to monitor expense details and be able to explain deviations from plan. Materials and supplies include items such as electric cable and connections, light bulbs, communications cable, office supplies, and cleaning products such as vacuum cleaner parts and toilet paper.
Objective
Achieve predictability for these costs and to set up a review of product suitability and pricing on a regular basis.
Managing an Unfavorable Conclusion or Inference
The conclusion and inference is unfavorable when and if spending exceeds the plan by a certain percentage or more and cannot be explained. Typically, the causes for overspending are a lack of financial and logistic controls. Other causes are “maverick spending” where a manager or employee purchases products and services outside of the negotiated contract, hoarding (hidden inventories) of supplies and materials, pilferage (organized and random), or other wrongdoing. My first management action would be to make sure procurement controls and budgets are in place and enforceable. Second, I would organize a central stock room, which is accessed, controlled and managed by an individual who would make certain that inventory levels are adequate and re-order levels are executed on time. I would also recommend that the convention center order standard commodities using state or city contracts as their unit prices are less expensive.
How to Calculate and/or Organize Data
1. Obtain expenses for each commodity and list event and house materials and supplies separately.
2. Divide each commodity’s expense by total operating expenses to calculate the percentage of each.
3. Maintain a running average of percentages.
4. Highlight and explain all items that are greater than or equal to a 5 percent increase over business plan.
Presentation Notes and Formats
Table, bar graph, or both, comparing current YTD, previous YTD and business plan. Include brief narratives if warranted.
KPI: Event Labor Cost Per GSF Rented
Owner |
Finance Department and Event Operations Department |
Data Sources and Collection |
The Finance Department will provide these costs. The quarterly GSF is a fundamental KPI. |
Reporting Frequency |
Quarterly or more frequently if data collected are by linking spreadsheets per the above. |
Why This KPI Is Useful
This KPI is a productivity metric based on business activity. GSF Rented covers business activity. Event costs include total labor costs for all “in-house” trades (electricians, plumbers, cleaners, riggers, etc.) involved in event production. These costs are hourly costs that are “fully loaded”— wages, benefits, payroll taxes, and unemployment and workman’s compensation insurance. It’s a good management practice to monitor labor hours and expense and be able to explain deviations from plan. Quite often the reasons for high labor costs are not increased business volume and work load, but rather a low productivity.
Objective
Gradual reduction of labor hours/GSF Rented, demonstrating labor productivity. Accuracy will improve as more data is collected. In Volume 2, other means of measuring event productivity are introduced. Another objective is to use this metric for forecasting.
Managing an Unfavorable Conclusion or Inference
Poor results from this indicator should prompt an investigation into other productivity KPIs. The productivity problem may be because of management and labor problems in the leading earned revenue sources (utility services, F and B, parking, or communications). If the investigations provide no answers, then the head of Finance should start an audit of the payroll division as soon as possible. In organizations with large payrolls and many temporary workers, I have seen fraud and malfeasance on the part of payroll clerks.
How to Calculate and/or Organize Data
1. To obtain Event Costs, sum total event labor costs for the quarter.
2. Divide event costs by GSF Rented. See example below:
Event costs for the second quarter are $370,656. The GSF Rented is $510,000. Therefore:
$370,656/510,000 = $0.73.
3. To use this for forecasting, say that next year’s second quarter GSF Rented estimate is 565,500 sq. ft. Then the forecast for event labor costs for the quarter is: $0.73 ¥ 565,500 = $412,815.
Presentation Notes and Formats
Table, bar graph, or both, comparing current YTD to previous YTD and business plan.
Things to Watch for: Misinterpretations, Nuances, and Cautions
KPIs Which Reveal Unusual Out of Pattern Expenses Can Be Caused by Employee, Contractor, or Supplier Wrongdoing: When expense aberrations occur and cannot be properly explained, it’s possible that there is wrongdoing of some type: theft of materials, false inventory reports, and false payroll inputs.