Convention Center Business Fundamentals
A Primer on the Convention Center Business Model in the United States
Private companies with little debt and plenty of cash are said to have strong fundamentals. But year after year fundamentals are recast as new management techniques with clever buzz words. I see most of them as new slants for ideas that have endured for years. Fundamentals that drive success don’t change. For convention centers many private business fundamentals apply. On a macro level the national economy expressed as market indices or GDP affect convention centers as profoundly as private businesses. However, at an operational level, there are distinct differences. The obvious is that most centers are publicly owned. They are built through the sale of tax-exempt bonds with debt service paid through tax collections. Bondholders enjoy low risk, are indifferent about a center’s operations, and cannot be compared to a private company’s investors and shareholders. Importantly, convention centers are free from funding debt payments and pay no corporate taxes. They also operate with low expectations of being profitable.
Ongoing operations and capital funds are provided by hotel taxes and government tourism funds. They are managed by a mix of government-owned corporations, city and county government divisions, not-for-profit organizations such as Chambers of Commerce or Convention and Visitor Bureaus (CVB) or privately owned venue management companies.
A center’s business strategy can be segmented as follows:
• Leadership and governance—Having the right governance and management structure and team in place; competent, well-informed, decisive, and committed to constant improvement.
• Economic impact—Achieving high occupancy and attracting enough out-of-town visitors to materially improve profits for hotels, restaurants, and entertainment and cultural attractions.
• Operational and business competency—Maintaining high standards of customer service with respect to building appearance, functionality and efficiency, and event services.
• Overall financial health—Contributing enough earned revenue to cover or exceed expenses, reduce dependence on subsidies, maintain positive cash flow, and establish a capital reserve.
From the key performance indicators (KPIs) in this chapter, convention centers can build and apply other KPIs that fit their business model. As a minimum, these KPIs must regularly engage the attention of senior management and board of directors.
The remainder of this chapter is divided into three parts:
1. Number and nature of events and space use
2. Financial reports
3. Economic impact
Number and Nature of Events and Space Use
KPI: Number of Events
Owner |
Sales Department |
Data Sources and Collection |
Self-explanatory |
Reporting Frequency |
Quarterly |
Why This KPI Is Useful
The number of events is a basic KPI. It’s analogous to how many cars an automobile plant produces or bushels of corn a farmer grows. However, simply tracking the number of events alone can be misleading. Many small to mid-sized convention centers cite event numbers as favorable performance. Indeed the number itself can be impressive, say 300 per year. In one consulting engagement I learned a large event number included school board meetings, regular meetings for the Kiwanis Club chapter, and other similar events. The event numbers were high, but the revenue value and economic impact negligible. The number of events has to be coupled with space use statistics to lessen the impression that the number of events alone is a measure of success.
Objective
Initially, the objective should be to meet or exceed the projections stated in the feasibility study. After obtaining actual results, a stretch goal should be to obtain enough events to achieve above 60 percent occupancy. If that is not achievable, work backward to a reachable objective, on par with the best performing competitor and build from there.
Managing Unfavorable KPI Conclusions and Inferences
Assume that second quarter results show a decline in the number of events compared to the previous year-to-date (YTD) and business plan. I recommend management take these steps as soon as practical:
1. Conduct a thorough review of qualified leads and come up with a closing plan for events that may occur in the last two quarters.
2. Consult hoteliers and the CVB about possible leads.
3. Start a sales drive to have local corporations hold their business meetings, award dinners, and shareholder meetings at your convention center.
4. Pursue social events such as charity banquets, school graduations, religious services, weddings, and so on.
Presentation Notes and Formats
Table, bar graph, or both, comparing current YTD to previous YTD and business plan.
KPI: Gross Square Footage Rented (GSF Rented)
Owner |
Sales Department |
Data Sources and Collection |
The Sales Dept. will provide GSF Rented. |
Reporting Frequency |
Quarterly or more frequently if data is collected by linking spreadsheets per the above |
Why This KPI Is Useful
GSF Rented is a fundamental indicator of business activity. Rented or licensed space measured in gross square feet is in some cases the basis for rent. GSF Rented is also part of the calculation for certain productivity metrics such as earned revenue per GSF Rented.
Objective
Obtain an accurate record of GSF Rented and progressively increase GSF Rented until the most practical occupancy rate is achieved.
Managing Unfavorable KPI Conclusions and Inferences
The same recommendations as shown in the KPI for number of events apply.
How to Calculate and/or Organize Data
Sum total GSF Rented for the quarter
Presentation Notes and Formats
Table, bar graph, or both, comparing current YTD to previous YTD and business plan.
KPI: Number, Percentage, and GSF Rented by event Type and Economic Sector
Owner |
Sales Department |
Data Sources and Collection |
The Sales Department will record the event types and economic sectors |
Reporting Frequency |
Quarterly |
Why This KPI Is Useful
Event types and economic sectors have unique characteristics with respect to services, revenue, and out-of-town attendance. How they are categorized is important. Event type categories typically are tradeshows, consumer shows, conventions with meetings only, conventions with meetings and exhibits, entertainment, sports, and corporate events (training, product rollouts, conferences, and banquets). Economic sector categories are: health/life sciences, technology (IT), manufacturing and industrial, food, consumer goods, arts, sports and leisure, fashion, and SMERFS (social, military, education, religious, and fraternal). On review this KPI should prompt the question as to whether this is the mix of events the center needs to be successful. This KPI will also expose differences among event types and the economic sectors they represent. As you read on you will see this type of KPI oft repeated where those differences are enumerated and compared. Factors that differentiate an event type and economic sector from another are critically important to a convention center’s sales and marketing strategy.
Objective
Obtain a knowledge base of events based on event type and economic sector. Use the knowledge base for assigning value to prospective events and business forecasting.
Managing Unfavorable KPI Conclusions and Inferences
Not applicable for this KPI.
How to Calculate and/or Organize Data
1. Create and record the number of events and their GSF Rented totals for each event type and economic sector and their respective categories.
2. Sum the number of events for each category for the quarter.
3. Divide category sum by total events to determine the category percentage.
4. Sum the GSF Rented for each category.
5. Divide each category GSF Rented sum by GSF Rented for all categories to determine the category percentage.
Presentation Notes and Formats
Table and horizontal bar graph, comparing current YTD to previous YTD and business plan.
KPI: Amount of Exhibit Hall’s Net Square Footage (NSF)
Owner |
Sales Department or the Event Services Department. |
Data Sources and Collection |
When NSF is the basis for exhibit hall rent there is usually a formal procedure for verifying and agreeing to actual NSF at the end of an event. If the basis for rent is gross square feet of the exhibit hall, then a staff member will have to be trained and assigned to measure NSF after each event that has exhibits. |
Reporting Frequency |
Quarterly or more frequently if data are collected by linking spreadsheets per the above. |
NSF is the square footage for exhibit booths sold by an event organizer. In some cases, NSF with a minimum percent of GSF Rented is the basis for rent. Typically the minimum is between 40 to 60 percent. Maintaining records of NSF is essential when calculating and comparing profit for event types and economic sectors which have exhibits.
This data can also be used to track the performance of individual events, particularly retained events. Additionally, NSF is used in calculating productivity metrics related to earned revenue such as utility services and cleaning.
Objective
Obtain a data base of event NSF performance.
Managing Unfavorable KPI Conclusions and Inferences
1. If NSF is declining across all event types and economic sectors, then it’s likely that other fundamental and earned revenue KPIs are showing unfavorable results. Cross-check these first. There will be a steep overall drop in service revenue, which will outpace an expected drop in event expenses.
2. Know that there have been separate episodic declines in NSF that occur and require attention. A decline in NSF may be indicative of a downturn in a particular economic sector or the result of competitive events playing in the same time period elsewhere.
3. At some point, there needs to be a serious conversation with retained event organizers who are experiencing declining NSF.
How to Calculate and/or Organize Data
1. If the event is a retained event where NSF has been consistently accurate, then the event organizer’s NSF and a cursory check of the floor plan is all that’s necessary.
2. If there is confidence in the final floor plan and exhibit booths are a standard size (10’ × 10’’), then simply count the number of booths and multiply by 100.
3. If there is no confidence in the final floor plan and the exhibit booth sizes vary, then to accurately measure and calculate NSF, a staff member will have to obtain and know how to use a planimeter shown Figure 1.1. They are easy to use and there are reliable inexpensive models.
4. Calculate the area by using the planimeter and measure the two-dimensional drawing of exhibit booth space from the event floor plan (see Figure 1.2). Then calculate as if calculating the area of a rectangle or square. The product is area and the measure is square feet. Sum all the rectangle or square areas. Sum total NSF for all events and separately for recurring events.

Figure 1.1 Planimeter, Source – grainger.com
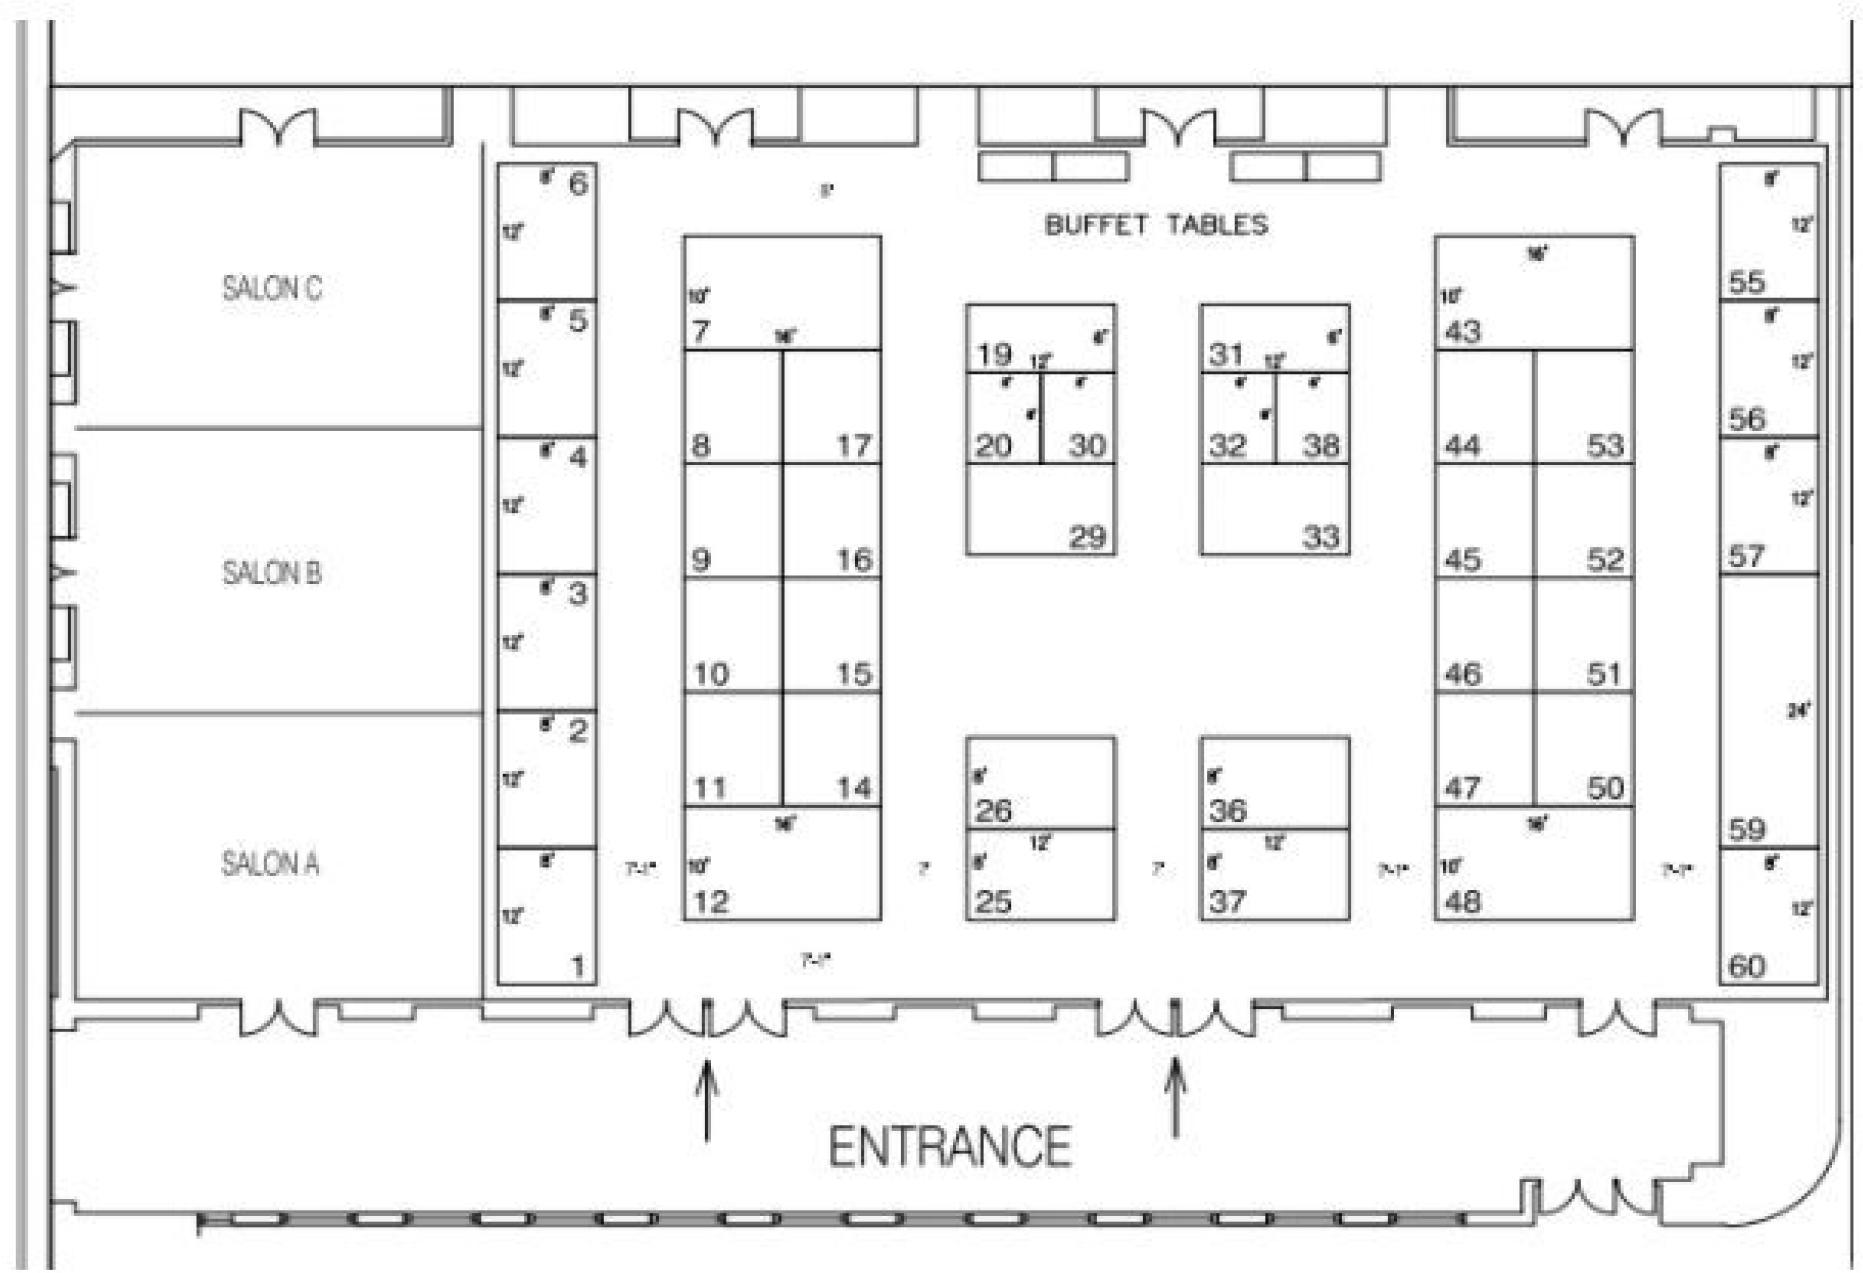
Figure 1.2 Sample tradeshow floor plan
Presentation Notes and Formats
Table, bar graph or both, comparing current YTD, previous YTD, and business plan. See Figure 1.3.
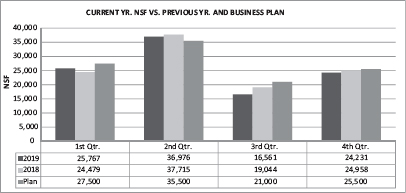
Figure 1.3 Current year NSF by quarter compared to previous year and plan
Things to Watch for—Misinterpretations, Nuances, and Cautions
NSF Accuracy: Be cautious about relying on an NSF figure provided by some event organizers. Event organizers may not want to disclose accurate NSF for a variety of reasons and simply throw out a casual number which may be inflated.
KPI: Occupancy Rate
Owner |
Sales Department or the Event Services Department |
Data Sources and Collection |
The Sales Department has GSF Rented and gross square footage available for rent. Gross square footage available usually remains constant unless space is taken out of service for maintenance or construction. It is also advisable to take city and center promotional events out of the occupancy rate equation |
Reporting Frequency |
Quarterly |
Occupancy rate is an elegant measure, shedding light on all aspects of business performance. Occupancy rate reveals whether a center is busy or not. High occupancy draws praise, increases revenue, supports investment, and opens selectivity when booking events. Low occupancy draws scrutiny, often unfavorable.
Objective
For centers in major cities (Las Vegas, New York, Chicago), annual occupancy rate should consistently be 60 percent or more; for second and third tier cities, 40–45 percent or more.
Managing Unfavorable KPI Conclusions and Inferences
The same recommendations as shown in the “KPI: Number of Events” apply.
How to Calculate and/or Organize Data
Occupancy rate is a simple process of tracking GSF Rented each quarter. It is derived from hotel occupancy rate, which is standardized and part of the “Uniform System of Accounts for the Lodging Industry.” For hotels, occupancy is the percent of rooms sold vs. rooms available for a specific time period. For convention centers, occupancy rate is similar:
1. Occupancy Rate (%) = GSF Rented for the quarter/Gross Square Feet available in the quarter mutiplied by the number of days in the quarter.
2. For example, say the convention center rented 2,762,100 gross square feet in the second quarter. The center has 99,000 gross square feet available to rent each day.
3. Occupancy Rate (second quarter) = 2,762,100 sq. ft. / (99,000 sq. ft. mutiplied by 91 days)
4. Occupancy Rate = 2,762,100/9,009,000 = 30.7%
Presentation Notes and Formats
Table, bar graph, or both, comparing current YTD, previous YTD, and business plan.
Things to Watch for—Misinterpretations, Nuances, and Cautions
An Incorrect Method to Calculate Occupancy Rate: Curiously, I have run across more than one convention center using a different method, which is incorrect. In those cases any occupancy, no matter how small, is regarded as 100 percent. So a small meeting occupying a few meeting rooms while the rest of the center is vacant qualifies as 100 percent occupancy for the day. Now that’s more than a fisherman’s lie.
Know How High Will Occupancy Rate Reasonably Go: About 20 years ago the consulting firm, PwC, announced 70 percent to be the maximum practical occupancy for convention centers. Their logic was that convention and trade shows have definite dates and days of the week in mind and won’t compromise so gaps of several days or more between events naturally appear. Add holidays when events are rare and days when space is taken out of service for maintenance or construction and event day possibilities lessen, making 70 percent ring true.
Financial Reports
KPI: Monthly Financial Report
Owner |
Finance Department |
Data Sources and Collection |
The Finance Department is responsible for compiling financial data and composition of the Monthly Financial Report |
Reporting Frequency |
Monthly |
Convention center managers know the three basic types of financial statements: income statement, balance sheet, and cash flow statement. These basic financial statements are standard accounting practices. On review, they prompt serious discussion about why revenues are shrinking or expenses rising. They are fundamental for managing business and are regularly presented for board meetings, audits, and annual reports. In my view, none of these financial statements alone have the relevancy or detail needed for line managers to readily see progress or unfavorable trends. In my time at the Javits Center, we used a Monthly Financial Report similar to this KPI. In sum, the Monthly Financial Report is a derivative of a standard and traditional process of reviewing financial metrics.
Objective
Track and uncover unfavorable trends overall and in operating divisions responsible for earned revenue and customer service in order to solve problems early.
Managing Unfavorable KPI Conclusions and Inferences
As an example, a review of Work Sheet 1.1 below depicts a serious problem. Earned revenue is 20 percent behind plan but expenses are only 1.3 percent higher than plan. Clearly the problem is with earned revenue. All revenue categories have underperformed. I recommend this course of action:
1. Start with number of events. Was there a cancellation?
2. Go to rent, which is 18 percent behind plan (from Work Sheet 1.1 below). Were there rent concessions and if so, why?
3. Before you go on to services, was NSF as planned? If not, why were the organizer’s space sales so low?
4. Compare these productivity KPIs (as presented in Chapter 3) to the retained events or to averages for event types and economic sectors. Review utility services/NSF. Cleaning/NSF, Parking/GSF Rented, Communications Service/GSF Rented, and Food and Beverage/GSF Rented.
5. The cause of subpar earned revenue performance will be exposed and evident after the above is analyzed. The cause is likely to be more than one poorly performing KPI.
Actions taken for a business problem like this generally lie with an underperforming event (those with low NSF), poor management and supervision, a labor productivity problem or a lack of coordination with General Service Contractors.
How to Calculate and/or Organize Data
Below is an example of a Monthly Financial Report work sheet:
MONTHLY FINANCIAL REPORT—MARCH, 2019 |
|||||
EARNED (Operating) REVENUES |
|||||
Revenue Category |
This Month Actual |
Cumulative Actual |
Cumulative Plan |
$ Difference from Plan |
% Difference from Plan |
Rent |
79,500 |
251,200 |
306,960 |
-55,760 |
-18.2% |
Services |
60,480 |
311,715 |
391,665 |
-79,950 |
-20.4% |
F & B Commissions |
47,498 |
165,388 |
207,154 |
-41,766 |
-20.2% |
Commissions from Excl//Off'l Contractors |
5,565 |
21,215 |
28,500 |
-7,285 |
-25.6% |
Other |
1,590 |
5,340 |
15,000 |
-9,660 |
-64.4% |
Sub - total |
194,633 |
754,858 |
949,279 |
-194,421 |
-20.5% |
Work Sheet 1.1 – Monthly Financial Report
Expense Category |
This Month Actual |
Cumulative Actual |
Cumulative Plan |
$ Difference from Plan |
% Difference from Plan |
Salaries – House |
68,324 |
181,130 |
180,000 |
1,130 |
0.6% |
Salaries – Events |
83,260 |
259,772 |
280,500 |
-20,728 |
-7.4% |
Employee Benefits – House |
17,081 |
63,396 |
54,000 |
9,396 |
17.4% |
Employee Benefits – Events |
24,978 |
103,909 |
98,000 |
5,909 |
6.0% |
Contract Services |
10,000 |
30,400 |
37,500 |
-7,100 |
-18.9% |
Materials and Supplies – House |
2,150 |
6,450 |
4,500 |
1,950 |
43.3% |
Supplies – Events |
2,325 |
6,975 |
5,700 |
1,275 |
22.4% |
Utilities |
51,590 |
181,130 |
165,000 |
16,130 |
9.8% |
Insurance |
4,169 |
12,674 |
12,500 |
174 |
1.4% |
Other |
2,000 |
7,630 |
4,500 |
3,130 |
69.6% |
Sub – Total |
265,877 |
853,466 |
842,200 |
11,266 |
1.3% |
PROFIT/LOSS |
-71,244 |
-98,608 |
107,079 |
-205,687 |
-192.1% |
Work Sheet 1.1a – Monthly Financial Report (cont’d)
Below is a continuation of the report above: This section shows the effect of non-operating revenue and expenses that express a more complete picture of financial performance.
NON-OPERATING REVENUES |
This Month Actual |
Cumulative Actual |
Cumulative Plan |
$ Difference from Plan |
% Difference from Plan |
Hotel Tax - Operating Deficit |
71,244 |
98,608 |
0 |
98,608 |
100.0% |
Investment Interest |
5,760 |
14,400 |
15,000 |
-600 |
4.2% |
Sub-Total |
77,004 |
113,008 |
15,000 |
98,008 |
-86.7% |
Capital Contributions - Hotel Tax |
5,000 |
15,000 |
15,000 |
0 |
0.0% |
Total |
82,005 |
241,016 |
30,000 |
98,008 |
-87.6% |
NON-OPERATING EXPENSES |
|||||
CVB Contribution |
2,000 |
6,000 |
6,000 |
0 |
0.0% |
Sales Tax (5.5%) |
9,732 |
37,743 |
47,464 |
-4,397 |
25.8% |
Capital Spending |
12,350 |
7,550 |
10,000 |
-2,350 |
32.5% |
Sub – Total |
24,082 |
51,293 |
63,464 |
1,547 |
23.7% |
NON-OPERATING REVENUES LESS EXPENSES |
57,923 |
189,723 |
-33,464 |
117,860 |
-117.6% |
EXCESS/(DEFICIENCY) OF REVENUES AND CAPITAL CONTRIB. vs EXPENSES |
24,082 |
51,293 |
63,464 |
1,547 |
23.7% |
Work Sheet 1.1b – Monthly Financial Report (cont’d).
This KPI is similar to EBITDA (earnings before interest, taxes, depreciation, and amortization). EBITDA evaluates a private company’s performance without having to factor financing charges, accounting decisions, or taxes. Convention centers pay sales tax on operating revenue (services) but no corporate income tax. Most pay no interest on debt. The line in the table above labeled “Operating Profit/(Loss)” shows monthly business performance using only earned (operating) revenues. Non-operating revenues, like hotel tax subsidies, and expenses, like sales tax, are included but in a separate section. Depreciation and amortization, which are non- cash expenses, are left out. This is useful for convention centers, which have many fixed assets subject to heavy depreciation charges. In reading the table above one sees the monthly problem is not just for the month but rather for the entire second quarter. The problem is low earned revenue. This monthly KPI will show how these trends develop month to month.
Presentation Notes and Formats
Prepare a graphic with the most important elements of Work Sheets 1.1 or 1.1a. Use tables, line graphs, or both, comparing current YTD, previous YTD, and business plan. For meetings have print copies available of the entire Work Sheets 1.1, 1.1a and 1.1b for participants.
KPI: Monthly Operating Profit or Loss Per GSF Rented
Owner |
Finance Department |
Data Sources and Collection |
The Finance Department will provide operating profit/loss for all events. The Sales Department will provide GSF Rented for all events. |
Reporting Frequency |
Monthly or more frequently if data is collected by spreadsheet linking per the above. |
Why This KPI Is Useful
This is a basic productivity metric for all types of events that connects profit to business activity.
Objective
Obtain a database of profit/GSF Rented so that a benchmark can be established at some point. As profit/GSF Rented increases, it demonstrates stronger earned revenue and improved cost control.
Managing Unfavorable KPI Conclusions and Inferences
A decline in profit/GSF Rented is a sign of an erosion of earned revenue or a lack of control over expenses. It should prompt an investigation centering on the cause of decline. The most likely cause is an overall decline in event NSF. Other likely causes are declining labor productivity, excessive rent concessions, and other discounts. The sequence of the investigation is similar to the one outlined for the “KPI: Monthly Financial Report” above.
How to Calculate and/or Organize Data
1. Operating Profit or Loss/GSF Rented is obtained from Operating Profit or Loss from the Monthly Financial Report above.
2. For example, say the month’s events occupied 153,500 GSF and had an operating loss of ($71,245).
Operating Loss = ($71,245)/153,500 GSF = ($.46) per GSF Rented
Presentation Notes and Formats
Table, and either line or bar graph, comparing current YTD to previous YTD and business plan. Below are samples (Figure 1.4 and 1.4a) of the annual data for this KPI displayed as a line graph and bar graph, both with embedded tables.
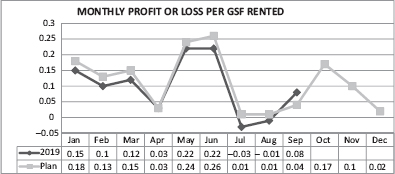
Figure 1.4 Monthly profit or loss per GSF Rented (line graph)
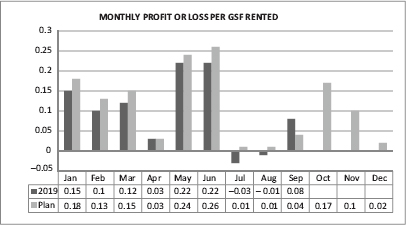
Figure 1.4a Monthly profit or loss per GSF Rented (bar graph)
KPI: Operating Profit or Loss Statements for Each Event
Owner |
Finance Dept |
Data Sources and Collection |
The Finance Department will make this data available from revenue receipts, payroll and procurement records, and exclusive and official contractor commission reports. |
Reporting Frequency |
Report on events within one week after the event closes. |
Why This KPI Is Useful
This KPI is a rapid “snapshot” of service performance after each event and should be issued and distributed within a few days after an event closes. The immediacy of the results is the primary value of this KPI. It makes it possible to expose productivity weaknesses within just a few days after an event closes. Corrective adjustments can be made before the next event.
Objective
Obtain immediate results that may reveal performance less than plan. This enables management to react to problems rapidly. Problems are typically poor supervision, a lack of event work coordination with other contractors, a supply delay, and so on.
Managing Unfavorable KPI Conclusions and Inferences
In my time at Javits, we relied on individual event profit–loss statements a great deal. Our routine would be to conduct a management review as soon as practical. In this process, we would compare productivity metrics such as utility service/NSF or communications service/GSF Rented averages, vs. the previous year if it was a retained event. We would also review productivity vs. economic sector averages. If we found subpar performance, we would meet with floor supervisors to go over what and why productivity declined and develop an action plan to remedy the problem. We always found these reports invaluable.
How to Calculate and/or Organize Data
Data are available using routine event revenue and expense reporting from the Finance Dept. When received, calculate profit per NSF for utility and cleaning services and profit per GSF Rented for parking, food and beverage, and communications services. Record on the work sheets below:
EVENT PROFIT/LOSS STATEMENT EVENT NAME ________DATE ______ |
|||||||||
THIS YEAR ACTUAL |
PLAN |
||||||||
NSF |
|||||||||
GSF |
|||||||||
Type |
|||||||||
Sector |
|||||||||
PRINCIPAL REVENUE SOURCES |
|||||||||
Rev. or Comm. |
# of Billable Items |
Labor Hrs. |
Labor Costs |
Material Cost Est. |
Total Costs |
Rev. |
Profit or Comm. |
||
Rent |
|||||||||
Electric |
|||||||||
Plumbing |
|||||||||
Parking |
|||||||||
F and B |
|||||||||
Telcomm. |
|||||||||
Cleaning |
|||||||||
Sub-Total |
|||||||||
Work Sheet 1.2 – Individual event profit or loss statement
THIS YEAR ACTUAL |
|
PLAN |
|||||||
|
Rev. or Comm. |
# of Billable Items |
Labor Hrs. |
Labor Costs |
Material Cost Est. |
Total Costs |
Rev. |
Profit or Comm. |
|
A/V |
|||||||||
Set - Up |
|||||||||
Adv. |
|||||||||
Rigging |
|||||||||
Security |
|||||||||
Other |
|||||||||
Other |
|||||||||
Sub - Total |
|||||||||
Total |
|||||||||
Profit or (Loss) |
|||||||||
Profit or (Loss)/GSF Rented |
|||||||||
Profit or (Loss)/NSF |
|||||||||
Event Labor Cost/GSF Rented |
|||||||||
NSF/GSF Ratio |
|||||||||
Work Sheet 1.2a – Individual event profit or loss statement (cont’d)
PRODUCTIVITY METRICS FOR EACH EVENT EARNED REVENUE CATERGORY |
||||||||||
Elec. |
Plumb. |
Park. |
F & B |
Comm. |
Clean |
A/V |
Set Up |
Rigging |
Security |
|
Profit or (Loss)/GSF Rented |
||||||||||
Profit or (Loss)/ NSF |
||||||||||
Labor Hrs./ Billable Item |
||||||||||
Work Sheet 1.2b – Productivity metrics for each event earned revenue category
Presentation Notes and Formats
Use tables to summarize the profit or ;oss and productivity metrics for each event for the month. If details are requested have the individual event work sheets available for explanations.
Things to Watch for—Misinterpretations, Nuances, and Cautions
Expanding the Event Profit/Loss Report into a Comprehensive End of Event Report Will Greatly Improve Data Collection: Most centers maintain a record of various reports documenting service issues which occur at events. They are mostly narratives, often anecdotal, and on separate departmental forms. There is little effort to enumerate and classify the issues into a unified and comprehensive end of event report The event profit/loss and productivity metrics presented above would naturally be an important part of a comprehensive report. If a center elects to create a comprehensive report using Excel, then through linking, a major fraction of KPIs would automatically be compiled and updated for other KPI work sheets. This subject is covered further in Volume 2, Chapter 11.
KPI: Profit Per GSF Rented for Each Event Type and Economic Sector
Owner |
Finance Department |
Data Sources and Collection |
The Finance Department will compile all financial statistics for events. GSF Rented, event types and economic sectors will be provided by the Sales Department. If the KPI: Operating Profit or Loss Statements for Each Event is used and its work sheets completed, then through linking spreadsheets using MS Excel, this KPI can be automatically updated very soon after each event. |
Reporting Frequency |
Semi-annually or more frequently if data is collected by spreadsheet linking per the above |
This KPI borrows from the retail sector’s KPI of sales per square foot. That sector’s characteristic dispersion of retail sales based on the product and merchandise line also applies. For an example of dispersion, Apple Stores produce well over $5,000 in sales per square foot. By contrast, sales per square foot for Walmart are only around $400 per square foot. Similar dispersions in profit per square foot exist in convention centers. Different event types and economic sectors yield different results. For example, the American College of Surgeons’ Clinical Congress, which uses exhibit halls, meeting rooms, and ballrooms, yields a profit of $3.03/ GSF Rented. As a comparison, Profit/GSF Rented for a national education conference with identical space and event duration yields a profit/ GSF Rented of $1.05/GSF Rented. The services ordered by exhibitors and attendees at the education conference were much more modest in comparison. No doubt, most center managers intuitively would know the education conference would yield lesser profit/GSF. With this KPI, now you’ll know by how much.
Objective
Create a knowledge base for profit yield per GSF Rented for different event types and economic sectors.
Managing Unfavorable KPI Conclusions and Inferences
This KPI’s primary intent is to establish a knowledge base showing the profit potential differences of event types and economic sectors. It will be some time before profit or loss/GSF Rented will have statistical validity unless you go through the time and effort to research event history. When you are confident of the data, I’d consider an event type or economic sector profit yield to be unfavorable when the profit/GSF Rented falls below the average for the type and economic sector. At that point it would be useful to study the trends occurring elsewhere in a particular industry. For example, the commerce of women’s fashion has shifted away from brick and mortar stores to the internet. This has profoundly affected the number of exhibitors and spending habits of buyers at fashion trade shows. Fewer stores mean fewer buyers at fashion trade shows. Fewer stores mean fewer buyers.
How to Calculate and/or Organize Data
1. Sum GSF Rented for each event by type and economic sector for the six months representing half the year.
2. The Finance Dept. will sum all event related expenses for each event type and economic sector for half the year.
3. Subtract expenses from earned revenue to obtain profit or loss for each event type and economic sector.
4. The Finance Department will divide each event type and economic sector profit or loss sum by GSF Rented sum for each event type and economic sector to obtain their average profit or loss per GSF Rented.
Presentation Notes and Formats
This format will have to be rich with data as it covers multiple event types and economic sectors all organized to show results and comparisons over time. Begin with tables organized where the best performers are on top with others listed below in descending order.
KPI: Percentages of Earned Revenue Categories
Owner |
Finance Department |
Data Sources and Collection |
The Finance Department routinely collects and compiles earned revenue details |
Reporting Frequency |
Annually |
It’s good management practice to know the rank order of revenue source contributions. This knowledge base should prompt a discussion of which revenue categories are satisfactory and others that have room for growth. In particular, there will always be an earned revenue source called “other.” Their percentage is insignificant compared to utility services, food and beverage, or parking. Within “other,” there may be a few that have substantial potential for growth, such as advertising and sponsorships and naming rights.
Objective
Make it routine to always have the up-to-date knowledge of these percentages.
Managing Unfavorable KPI Conclusions and Inferences
Not applicable for this KPI.
How to Calculate and/or Organize Data
1. Assign revenues to the appropriate categories.
2. Divide each category’s revenue by total earned revenues to calculate the percentage of each.
Presentation Notes and Formats
Table. A horizontal bar graph or a ring chart (aka donut chart) may work if the number of categories is limited to the six top earned revenue categories. Which communicates the data more effectively? See below (Figure 1.5 and 1.5a):

Figure 1.5 Earned revenue percent (horizontal bar graph)
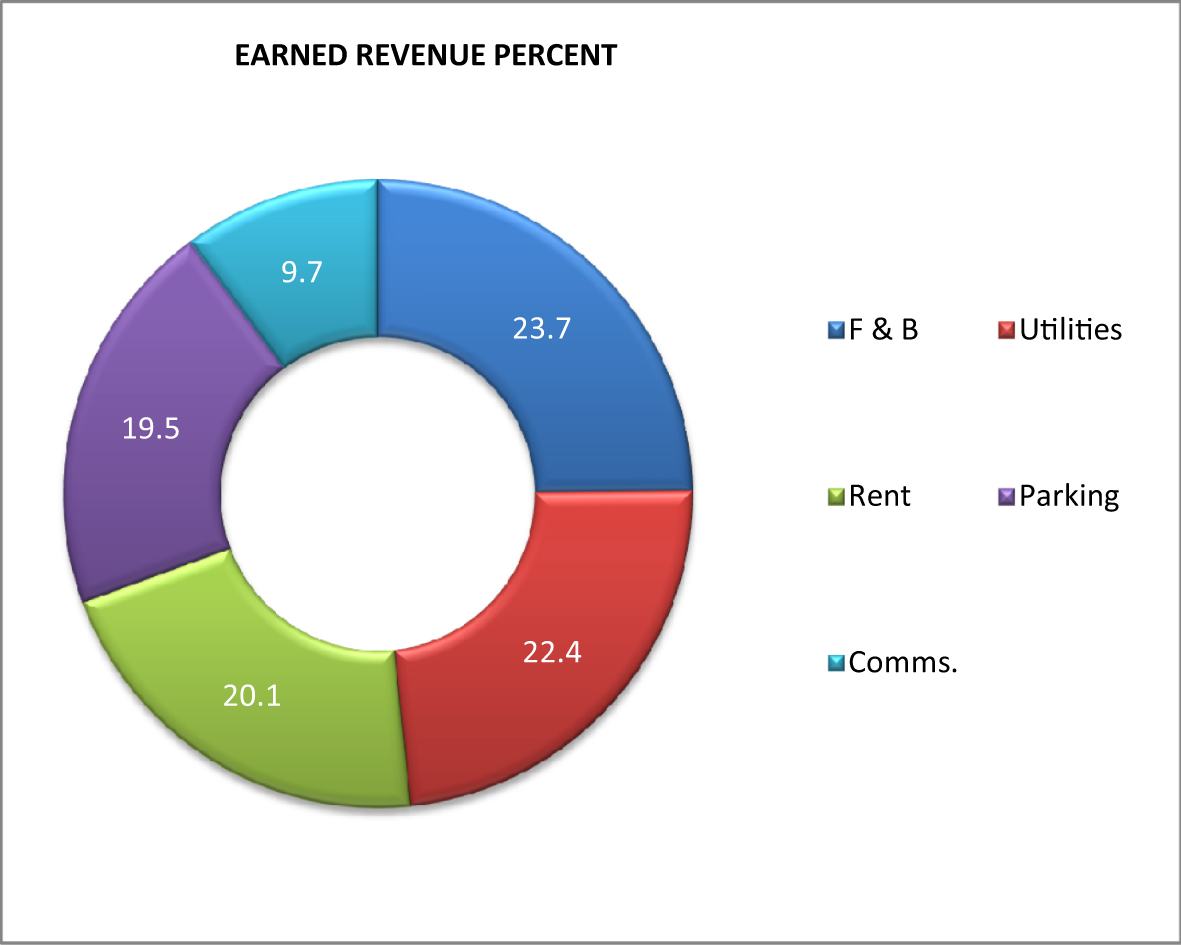
Figure 1.5a Earned revenue percent (ring chart)
Economic impact occurs anytime money changes hands, be it consumer-to-business or business-to-business. A common misconception is that there is a single value representing economic impact. Economic impact is typically measured using several metrics:
• Jobs created—Both full and part time
• New tax revenues—Sales tax, hotel occupancy tax, and so on
• Increases in household income
• Economic output—Economic output is the basis for economic impact; without output there is no impact, no new dollars added to the local economy, no new jobs and no increases in household income. Economic output is the dollar amount of all sales made or the value of goods and services created
due to new business activity such as convention center events. Economic output represents the money spent to purchase all of the inputs used to produce and stage an event and as well as money received by local business as a result of the event. This is also called direct spending.
• Direct spending has a cascading or ripple effect. These effects are called indirect and induced spending. So economic output is the sum of direct, indirect, and induced spending.
• Value added is the total dollar amount of only new sales made. It is economic output minus the value of any product or service already sold in the local market area.
When discussing the economic impact of events, the conversation is really about economic output and value added. The two terms have combined into just “economic impact” when the subject is convention centers and the events. Economic impact is a convention center’s raison d’etre. Events attracting out-of-town attendees are the impetus for building a publicly financed convention center. As a KPI, economic impact is the most meaningful and most contentious.
It’s meaningful because economic impact justifies the project’s high investment and does so in a measureable, timely way. Nearly all convention centers use consultancies with experience in advising on economic impact when first considering construction of a convention center or when expanding. The process starts with a market study where national and regional event demand is reviewed. This is followed by a survey of occupancy at comparable venues. If these results are favorable, a series of surveys and one-on-one interviews with prospects is conducted. From this, consultants fill a simulated calendar and make judgments about booking probabilities. Presuming there is enough demand to meet occupancy goals, additional research and surveying is conducted in order to:
• determine event organizer and exhibitor event production spending;
• determine organizer, exhibitor, and attendee in town-spending habits for commuters and out-of-town persons (the primary metric is spending per day); and
• determine the average length of stay (in days and fractions of days) for out-of-town event organizer staff, exhibitors, and attendees.
It is at this point where consultants employ an economic impact model. The one used most frequently is the IMPLAN model. This model uses direct spending (transactions occurring locally by event organizers, exhibitors, and attendees) as a basis to calculate indirect and induced spending. To calculate these spending categories, the economic model uses a “multiplier.” There is a calculation method and an explanation for the multiplier. The economic impact eventually diminishes in value once other uses of the income obtained from having events is not spent or consumed locally. Rather, the extra income is absorbed by taxes, savings, or a preference to consume imports (products and services not made or sourced locally).
As mentioned, the determination of economic impact is also contentious. It’s contentious because of perceived flaws and ambiguities in nearly every step, from the market study through to the multiplier. To many, the final economic impact may also appear grandiose. It’s advisable to expect a multiplier to be between 1.0 and 1.5. If it goes beyond that, it’s time to question the process. Typically multiplier ranges follow this general pattern; at a city and county level a multiplier is between 1 and 2, at a state level a multiplier is normally higher. The end game for economic impact is to persuade government to fund convention center construction and expansion through sale of general obligation bonds.
Funding is also needed to cover operational costs of running a convention center, which generally cannot be covered by earned revenue from events. The source of this funding is normally the hotel tax. This too is contentious because other projects related to tourism seek entitlement to hotel tax revenues to fund new projects. As an example of which projects can be funded by a hotel tax, below are the uses prescribed by the State of Texas.
• Funding the establishment, improvement, or maintenance of a convention center or visitor information office
• Paying the administrative costs for facilitating convention registration
• Paying for advertising, solicitations, and promotions that attract tourists and convention delegates to the city or its vicinity
• Expenditures that promote the arts
• Funding historical restoration or preservation programs
• Funding certain expenses including promotional expenses, directly related to a sporting event within counties of a population fewer than 1 million
• Funding the enhancement or upgrading of existing sports facilities or sports field for certain municipalities
• Funding transportation systems for tourists
• Signage directing tourists to sights and attractions that are visited frequently by hotel guests.
KPI: Economic Impact of Convention Center Events
Owner |
CEO/General Manager and CVB management |
Data Sources and Collection |
See narrative below |
Reporting Frequency |
Monthly or Quarterly (Short Version) |
Data Sources and Collection (Long Version)
1. Obtain the number of event organizer staff, exhibitors, and attendees who stayed at hotels or Airbnbs from the event organizer.
2. Use the estimated stay in days from the event organizer or the initial feasibility study or its update.
3. Obtain the number of exhibitors and attendees who commuted from the event organizer.
4. If confidence is low in the organizer’s numbers, include reporting requirements in the license agreement and require a deposit, held until the information is received. Then follow the procedures below:
• Obtain the number by zip code and country code if international, for organizer staff, exhibitors, and attendees.
• Estimate if U.S. attendees and exhibitors are staying overnight in the city based on zip codes, distance, and ease of commuting. Assume international exhibitors and attendees stay in hotels or Airbnbs. Then, split the attendees and exhibitors (United States) into out-of-town and commuting.
• Information about zip codes for consumer show attendees can be obtained from online ticket sales.
• Set up a spread sheet template similar to the Economic Impact table below except that this will be for each event. Use the initial feasibility study multiplier effect. The Finance Department can create a master spreadsheet recording each event for the year.
Data Sources and Collection (Short Version)
1. Obtain hotel room nights that are normally reported to CVBs. Large CVB staffs may have a statistician you can rely on for this data.
2. Use the event organizer’s report of number of out-of-town attendees who stayed at hotels. Organizers may also have hotel room night data.
This KPI enumerates the value of all individuals who work at, exhibit or attend events at the city’s convention center. The emphasis is on those from out-of-town who remain overnight and stay at a local hotels and use their free time spending by dining at restaurants, shopping, or engaging in other tourist activities.
This KPI refers to a “long version” and a “short version”. The long version is presented annually. There is a good deal of work obtaining the data. You may rely on the event organizer or, if you find the statistics unreliable, you can use the procedures detailed in the “How to Calculate and/or Organize Data” section. Generally, statistics like these are presented in annual reports, marketing literature, and in formal requests for facility expansion. The short version is a useful and expedient way to report on economic impact using the number of event attendees staying at hotels and how many nights they stayed at hotels. The short version is also important because it creates a database for assigning economic impact to each event type and each event economic sector.
Objective
Use economic impact calculations to periodically report on the center’s contribution to the local economy. Also, use impact statistics to roughly estimate economic value of future events. Cities such as Las Vegas have found that periodic independent research to update spending patterns improves the impact estimate’s accuracy and credibility. Updates are normally done every five years.
Managing Unfavorable KPI Conclusions and Inferences
It would be rare that a convention center would openly discuss an unfavorable economic impact. However, when it does occur the problem is sometimes so obvious that public discussions are unavoidable. As mentioned earlier the impact numbers are generally very high and it’s not unusual to see annual impact amounts in billions of dollars for cities like Orlando, New Orleans, and Las Vegas. These are cities where the dependence on tourism and convention center events are so impactful that bad news would likely trigger a rigorous investigation.
How to Calculate and/or Organize Data
To calculate the annual Economic Impact, create a work sheet with all the above listed elements. A sample of such a work sheet is shown below. The sample only covers economic impact for the city and does not include the county, region, or state. Consider this sample the “long version.”
ANNUAL ECONOMIC IMPACT |
|||||
Category |
Number |
Ave. # of Days |
Spending/Day |
Total $ |
|
Event Organizer Rent and Services |
NA |
NA |
NA |
5,500,000 |
|
Event Staff Staying at Hotels |
324 |
3.5 |
45.96 |
52,119 |
|
Event Exhibitors Staying at Hotels |
3,578 |
4.1 |
176.01 |
2,582,031 |
|
Event Exhibitors Commuting |
397 |
NA |
25.3 |
10,044 |
|
Exhibitor - Event Services |
NA |
NA |
NA |
2,874 |
|
Out-of-Town Attendees (US) |
41,964 |
2.5 |
234.68 |
24,620,279 |
|
Out-of-Town Attendees (Int'l) |
1634 |
4.5 |
563.23 |
4,141,430 |
|
Attendees Day Trip or Commuting |
58,357 |
1 |
41.78 |
2,438,155 |
|
Sub-Total |
42,218,789 |
||||
|
|||||
Geography |
Direct Spending |
Multiplier and Indirect and Induced Spending |
Total Spending (Economic Impact) |
||
1.38 x 42,218,789 = 58,261,928 |
|||||
CapitalL City |
42,218,789 |
58,261,928 |
$100,480,717 |
||
Work Sheet 1.3 – Annual economic impact (long version)
Event |
Type |
Economic Sector |
Attendees at Hotels |
Est. - Hotel Room Nights |
State Music Teachers |
Convention w/exhibits |
SMERF |
1,695 |
2,567 |
Gift Fair |
Tradeshow |
Consumer Goods |
957 |
1,823 |
Regional HS Cheer-leading |
Sports |
Sports Competition |
1,090 |
750 |
Spring Dog Show |
Consumer Show |
Arts, Sports and Leisure |
3,180 |
25 |
XYZ Corp. Sales Mtg. |
Corporate Event |
Business |
35 |
60 |
Furniture Mfg. Expo |
Tradeshow |
Manufacturing |
1,936 |
2,385 |
It for Finance Seminar |
Business Seminar |
Tech |
390 |
500 |
Totals |
9,283 |
8,110 |
||
Work Sheet 1.3a – Monthly economic impact of events (short version)
Presentation Notes and Formats
Tables, bar graphs, or both, for each event type and economic sector, comparing current and previous years.
Things to Watch for—Misinterpretations, Nuances, and Cautions
Total Number of Exhibitors and Attendees from Out-of-Town Is Often Inaccurate: It’s known by convention center managers that attendance is sometimes roughly estimated. Moreover, even if an event organizer has a reasonably accurate estimate before the event, there is rarely follow-up with adjustments made after the event closes. The problems described are especially true for privately owned tradeshows and consumer shows. This situation normally does not occur for events owned and managed by professional associations.
Initial Convention Center Feasibility Studies Are Often Criticized as Flawed: Perceived flaws may exist in the initial feasibility ranging from the estimated number of events to direct spending estimates and methods used to derive multiplier effects. The most oft-criticized aspects of the feasibility process are as follows:
• Consultants conduct market feasibility and direct spending studies, and then apply an economic impact model to find the value of indirect and induced spending. In conducting studies where a center does not already exist, there is often a lack of reliable business data in the event industry. This leads to many assumptions that cannot be validated. A frequent critic of new convention centers (Heywood Sanders) characterized initial feasibility studies as relying on the opinions of prospective event managers and not on actual data. Sanders called this a “Survey of Expectations” taken from interviews. On reading through studies, it’s evident that most prospects typically say yes, they would consider the new convention center as an event location. These responses and sentiments often end up as overly optimistic forecasts.
• Initial feasibility studies are strongly influenced by the enthusiasm and drive of local hospitality businesses, backed by political leadership. In these circumstances it is difficult for consultants to stay objective. However, that has been changing over the last few years.
• Consultants do not have clear insight regarding the power
of supply and demand and how it governs the way cities and venues compete. Some convention centers go to extreme lengths to maintain and grow market share. It is not uncommon for them to offer zero rent and deeply discount services. This can have a material effect on market share. Rarely do studies mention price of rent as the basis for winning and losing events. Cost is a driving factor for major event locations and changes the competitive picture dramatically.
• Economists believe that “opportunity costs” should be part of convention center feasibility studies. Investopedia defines “opportunity costs” as follows:
Opportunity costs represent the benefits an individual, investor or business misses out on when choosing one alternative over another. While financial reports do not show opportunity cost, business owners can use it to make educated decisions when they have multiple options before . . . Because by definition they are unseen, opportunity costs can be easily overlooked if one is not careful. Understanding the potential missed opportunities foregone by choosing one investment over another allows for better decision-making.1
Applied to convention center feasibility studies, public investment in building a convention center is rarely, if ever, compared to an investment in projects like airport construction, industrial parks, and other urban improvements.
When Reporting Economic Impact, Emphasis Should Be on Direct Spending Data: Until a follow-up study is done updating initial direct spending data, center management should rely on the initial study results. However, management should be careful about discussions regarding indirect or induced spending impacts until validated by further research. Most critics know positive indirect and induced impacts exist. It’s more a question of the impact scale factored up by the multipliers. If a conversation is unavoidable, you can avoid speculation by assigning a range of possible multipliers from 1.1 to 1.5. Critics have a good argument when impacts cannot be observed or accurately measured and appear grandiose.
When Collecting Hotel Room Night Data, There May Be Overnight Stays That Are Not Included in Room Block Data: Know that hotel room nights are many times under-reported. For mature events that consistently have returning attendees each year, there is anecdotal evidence that many book their own hotel accommodations and are not reported in the “room block” (where the hotel room night statistic is derived). Also, new research from PCMA has shown that room block data accounts for only about half of those staying overnight. Attendees are staying at hotels where they are awarded loyalty points, use their company credit cards to book where they please or where their companies recommend. Many attendees are trying out Airbnb and other short-term rental options instead of hotels.
1 Investopedia. Undated. “Opportunity Costs.” https://investopedia.com/terms/o/opportunitycost.asp (accessed October 2019).