“If you can’t measure it, you can’t improve it.”1 Peter Drucker’s words unwittingly created the widespread use of business analytics or key performance indicators (KPIs) as a business philosophy. The idea was not new in Drucker’s time but his elegant quote led others to build the idea into a refined organized process of management. The explanations below provide an introductory perspective.
What Are KPIs?
KPIs work by applying units of measure to business functions, then displaying progress or decline, gains or losses, and ultimately success or failure. In simpler terms, KPIs measure how well companies, their business units and departments, managers, and projects are performing. In the KPI process actual performance is regularly tracked and judged in relation to business objectives. The well-known author on KPIs, Bernard Marr, best defines KPIs as “… vital navigational instruments, . . . giving a clear picture of current levels of performance and whether the business is where it needs to be. KPIs are also useful decision-making tools. Because they help reduce the complex nature of organisational performance to a small, manageable number of key indicators, KPIs can, in turn, assist decision making—and, ultimately help improve performance.”2
In Marr’s words, “the complex nature of organisational performance to a small, manageable number of key indicators” is a solution to a convention center’s time-consuming, constantly changing, and often overwhelming demands of event production, customers, stakeholders, and union labor. In this type of business environment, it’s hard to keep your eye on the ball. A systematic, reliable, and proven management process is needed.
How can a convention center fully engage and benefit by starting a KPI program? Where does one start? The advanced state of business software makes data collection and organization so routine that the number of possible KPIs seems without limit. Indeed many management consultants advise that only about five KPIs provide enough breadth and depth to touch all business operations and direct strategic management. I disagree. The top five theory may hold for senior level managers and board members, but managers at the departmental level need to be part of the KPI program and measure success of their operations. Collectively their contribution to overall business performance drives high-level KPIs. Tactical KPIs covering productivity in revenue-earning departments, sales and marketing metrics, and of course metrics for tracking customer service levels are the data they need. These results will reflect on overall business performance. As you read Volume 1, know that an effective KPI program has many levels and parts, all which complement and advance KPIs that may appear in an Annual Report.
The Basic Characteristics of Good KPIs: Things One Should Know Before Getting Started
A good KPI program has common traits that direct development of your program. They are listed below:
Good KPIs:
• Embody Simplicity: They are clear, fact-based and unambiguous.
• Are Easily Measurable: Most KPIs use data already available and units of measure which are familiar.
• Are Achievable: KPIs do not promote “pie in the sky” objectives. Employees lose enthusiasm when the objective is unreachable.
• Are Relevant: The KPI must measure some real and critical aspect of strategy and directly contribute to achieving it.
• Are Timely: Our business moves very fast. It’s best not to let poor performance and bad habits fester.
• Can Be Tracked Over Time for Comparisons and Analysis: Current trends and differences should be compared to a baseline year (derived from three to five years of data), an industry benchmark, a previous year’s data and performance, and to business plan objectives.
• Help Explain Business’s Most Fundamental Concerns: Are we at risk? How can we perform better? Can we meet stakeholder expectations?
What Does a KPI Look Like and How Does the KPI Review Process Work?
The KPI process includes collecting, organizing, analyzing, and interpreting business data and information. Data are collected and organized on work sheets, Excel spread sheets, fill in the blank forms, from questionnaires and interviews, or from existing records and financial statements. This all culminates in a KPI presentation where everything is distilled and reviewed into an easy-to-follow table, graphic, or simple narrative. The example in Figure I.1 is what could be part of a convention center’s KPI presentation as it may appear in a report to a board of directors and stakeholders. The KPIs presented in the figure cover operating profit and the number of events for the first two quarters of the year. The graphic below was created using MS Excel.
The graphic’s purpose is to present facts and make comparisons to previous years’ performance and the business plan. The purpose is also to prompt discussion, which in turn may require a “deeper dive” by reviewing related KPIs. If I were General Manager or a board member reviewing the above, these would be my thoughts and questions:
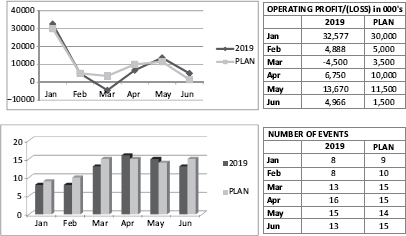
Figure I.1 Sample KPIs as they may appear in a presentation
1. Number of events and profit have performed well. Excellent recovery from previous years. Why is that so?
2. Operating profit is tracking close to business plan. What happened in March?
3. What was the mix of event types and economic sectors so far this year and which brought in the most service revenue and out-of-town visitors who stayed at hotels?
4. Did we have to offer rent concessions or service discounts to attract any of this year’s events? If so, how much revenue was forfeited?
At the end of a comprehensive review, there should be enough information to draw strong inferences and conclusions.
HOW IS THIS BOOK ORGANIZED?
Volume 1 consists of ten chapters. Most chapters (1–4 and 6–10) cover major business functions such as Convention Center Business Fundamentals, Earned Revenue, and Customer Service. The format for these chapters was adapted from Bernard Marr’s 2012 book Key Performance Indicators: The 75 Measures Every Manager Needs to Know. Within these chapters, there are narratives for each KPI subject. Chapter narratives all follow the format below:
Some chapters begin with a general discussion about the subject. Some chapters will be broken down by related titles that are more precise. Then, KPIs will be presented as noted below:
• KPI
• Owner
• Data Sources and Collection
• Reporting Frequency
• Why this KPI Is Useful
• Objective
• Managing Unfavorable Conclusions and Inferences
• How to Calculate and/or Organize Data (Sample work sheets may also be presented. Nearly all of the work sheets were done using MS Excel).
• Presentation Notes and Formats (Sample tables and graphics for presentation will be included in several KPI narratives. The graphics were created using MS Excel. Similar graphics can also be created using MS Power Point. The graphics and tables shown in ithe book are not prescriptive. Rather, they show a variety of examples of presentations; some are clear and understandable, others not so much. Chapter 10 in Volume 2 “Presenting and Displaying KPIs” offers the best advice and examples for tables and graphics.
• Also, a section titled “Things to Watch For: Nuances, Misinterpretations, and Cautions” may follow referencing the KPI subject matter.
Chapter 5 is titled “KPIs Applied: The Case of the Contradictory KPIs.” This chapter does not follow the format above. It is a case study providing perspective and insight into the discipline and value of a thoughtful KPI program.
“Without data you’re just another person with an opinion.”3 This is a quote from W. Edwards Deming. He was an engineer, scholar, and professor at New York University’s and Columbia University’s School of Business Administration.
1 Lavinsky, Dave, L. undated, “The Two Most Important Quotes in Business.” https://growthink.com/content/two-most-important-quotes-business (accessed December 2019).
2 Bernard Marr & Co. 2018, “What Is a KPI?” https://bernardmarr.com/default.asp?contentID=762, (accessed April 2019).
3 Deming, Edwards, D.W., undated, https://goodreads.com/quotes/7327935-without-data-you-re-just-another-person-with-an-opinion (accessed December 2019).