6
Recycling Technologies – Physical Separation
Amit Kumar1, Maria E. Holuszko1, and Shulei Song2
1University of British Columbia, NBK Institute of Mining Engineering, 6350 Stores Road, Vancouver, British Columbia V6T 1Z4, Canada
2China University of Mining and Technology, School of Chemical Engineering, Ding No.11 Xueyuan Road, Haidian District, Beijing 100083, People’s Republic of China
6.1 Introduction
Electronic waste has been a growing concern around the world. The amount of e-waste generated has been growing at a rate of 3–4% and is expected to reach 120 million tonnes by 2050. With the development of new technologies, especially in laptops, cellphones, and tablets, older technologies are getting obsolete, reducing the lifespan of electrical and electronics products and thus contributing to a higher rate of waste generation. These staggering facts should be considered as an essential incentive for e-waste recycling. If this waste is recycled correctly, it could offer an opportunity for urban mining for the recovery of copper, gold, silver, palladium, and other metals with an estimated value of 55 billion euros. The concentration of metals in e-waste is also significantly higher than the natural ores.
Various routes are currently being implemented to recover metals from the e-waste stream. The recycling methods for e-waste could be broadly categorized into two sections, preprocessing and end processing (Namias 2013). The preprocessing stage, also known as mechanical recycling, has gained popularity due to its relatively low operating cost. It also recovers the metallic fraction without destroying the nonmetal fraction, which, in turn, helps to promote the recycling of nonmetal fraction and the circular economy (Ning et al. 2017). The physical methods recover the metallic fraction and thus reduce the overall mass to be transported or processed subsequently and are less energy-intensive usually. On the other hand, it requires proper dust control units if processed dry or proper water recycling/treatment systems if processed wet.
The preprocessing techniques deal with physical separation methods focused on separating metals from the nonmetals and thus reduce the amount to be processed in subsequent energy-intensive and costly stages. The end processing uses the metal concentrate obtained from the preprocessing stage and methods such as pyrometallurgy, hydrometallurgy, and biometallurgy to produce high-purity metals.
Mechanical recycling of waste printed circuit boards (PCBs) is usually based on density separation, magnetic separation, or electrostatic separation. The liberation of metal and nonmetals is achieved by using a combination of shredders (coarse crushing), hammer mills, and knife/cutting mills (fine crushing) (Bizzo et al. 2014; Ghosh et al. 2015; Mou et al. 2004; Ogunniyi et al. 2009; Otsuki et al. 2019; Veit et al. 2006; Wen et al. 2005a; Zhang and Forssberg 1999). After the size reduction, the liberated waste is processed using physical separation methods.
This chapter provides the details of the preprocessing processes used in e-waste recycling. The preprocessing step majorly deals with the disassembly, size reduction, and physical separation of various components such as metals, glass, and plastics from the e-waste.
6.2 Dismantling
The dismantling process is mostly a manual disassembly process to remove the hazardous materials out of the e-waste before recycling. The substances removed during dismantling include (Kaya 2018),
- Inks and toners from printers
- Cathode-ray front panels from cathode tube ray (CRT) screens
- Batteries from laptops
- Degassing of chlorofluorocarbons (CFC), hydrofluorocarbons (HFC), and hydrochlorofluorocarbons (HCFC)
- Coolants from refrigerators
- Mercury-containing switchers and PCB capacitors
- Removal of compressor and deoiling
This stage is also used to reduce cross-contamination and to segregate different streams such as plastics, steel, aluminum, copper, and printed circuit boards (Abdelbasir et al. 2018). Automatic and semiautomatic dismantling systems use has increased in recent years; however, manual dismantling is still the most widely used (Hsu et al. 2019). Robotic systems such as Liam and Daisy have been developed by Apple Inc. for dismantling iPhones that can process several cellphones at once. These automatic systems reduce the risk of worker safety and increase the capacity and processing speed for the processing plant. The dismantled streams are sent to the individual processor for the subsequent stage involving size reduction and metal recovery.
Dismantling helps to improve the quality of streams/products for subsequent steps, has low investment, and reduces/eliminates the dust issue. However, it is harder to dismantle new sophisticated technologies, is time consuming, and increases the risk for worker safety. It also is a significant cost concern, especially in high-labor-cost economies.
6.3 Comminution/Size Reduction
Similar to the mining industry, the comminution step involves reducing the particle size to increase liberation and provide proper particle size for subsequent processing/enrichment. The size reduction in e-waste recycling is achieved by using shredders and hammer mills. The particle breakage is achieved by impact and shear forces (Schubert and Hoberg 1997). Recently, high-voltage pulse fragmentation has also gained attention for size reduction as it reduces the dust issue and provides liberation at a coarser size (Duan et al. 2015).
The comminution unit increases the overall plant throughput and reduces the volume for materials to be transported for subsequent process. The significant drawbacks of the comminution process are the generation of dust and loss of valuable metals with the dust and decreased grade/cross-contamination of streams if performed without prior dismantling.
6.3.1 Shredders
Shredders are the first stage of the size reduction process in e-waste recycling. A shredder utilizes sharp cutting blades mounted on a rotating shaft powered by high-power electric motor for cutting materials into smaller pieces. It relies on shear cutting and tearing forces provided in the form of low-speed and high-torque operation. The two main parts of shredders are the rotating shaft and the cutting knives. A shredder can be mounted with single, double, or four heavy-duty rotating shafts depending on the requirement of the operation. The additional shafts provide second-stage size reduction and can further reduce the particle size by increasing the cutting action at a given time (Ekman 2018). The shafts rotate counterclockwise, and the knives mounted on the shaft provide the required shear forces on the material trapped between the knives (Fitzgerald 2009). The knife design depends on the application. Heavy-duty shredders used for cutting cars and metals require thicker and smaller knives. The number of knives dictates the operation of the shredder. More knives not only increase the probability of shredding actions, but also increase the chances of materials to keep bouncing on the surface of the shredder and sometimes clogging the equipment (Ekman 2018).
The rotational speed of industrial shredders ranges from 10 to 50 RPM and can process up to 150 t of materials per hour; however, the throughput capacity changes widely depending on the application (Fitzgerald 2009). The energy consumption ranges from 3 to 11 kWh/t depending on the feed rate and feed properties. A low-power shredder from UNTHA shredding technology has a single shaft (LR520) powered by an 11 kW motor rotating at a speed of 85 RPM, whereas a two-shaft shredder (S120) from the same manufacturer (high torque shredder) has 88 KW drive power and a rotational speed of 10–25 RPM (UNTHA Shredding Technology 2018).

Figure 6.1 Cross-section of a typical hammer mill.
Source: Wills and Finch (2016a).
6.3.2 Hammer Mills
A hammer mill is usually installed after the shredder to reduce the particle size of the shredded product for subsequent processes. It uses a high-speed hammer head mounted on a rotating shaft to provide high-impact forces to feed particles to produce smaller particles (Fitzgerald 2009). The particles are impacted by the rotating hammer heads and subsequently by the grid plates for size reduction. Due to high rotational speed, the hammer head also gets severely damaged in the presence of steel and iron. A cross-belt electromagnet is preferably used before feeding the hammer mills. The hammer mill is also lined with a screen at the product end; hence, particles larger than the screen size are retained and undergo multiple impacts. The hammer head is usually manufactured using manganese steel or cast iron with chromium carbide. Figure 6.1 shows the cross-section of a typical hammer mill.
The size reduction in the hammer mill allows particles to achieve proper liberation for subsequent separation processes. These mills have low cost and high production capacity. The heavy-duty WA-36-H-E-Cycle hammer mill from Schutte is equipped with 100 hp. motor and could process at a unit throughput of 455–1360 kg/h depending on the application (SCHUTTE Hammer Mill 2019).
6.3.3 High-Voltage Fragmentation
High-voltage pulse fragmentation is a relatively new technology that has been developed to utilize electrical energy to break the rocks/ore at the grain boundary. The primary benefit of this technology is its higher selectivity. The electrical fragmentation uses fast pulse rise time (<1 μs) and higher voltages (>90 kV) to discharge into a solid material, causing an “explosion” within. The higher selectivity of this technology comes from different electrical properties of different materials. Field distortions caused by adjacent minerals with different dielectric constants provide the fastest route to ground for the discharge (Wielen et al. Van Der Wielen et al. 2014).
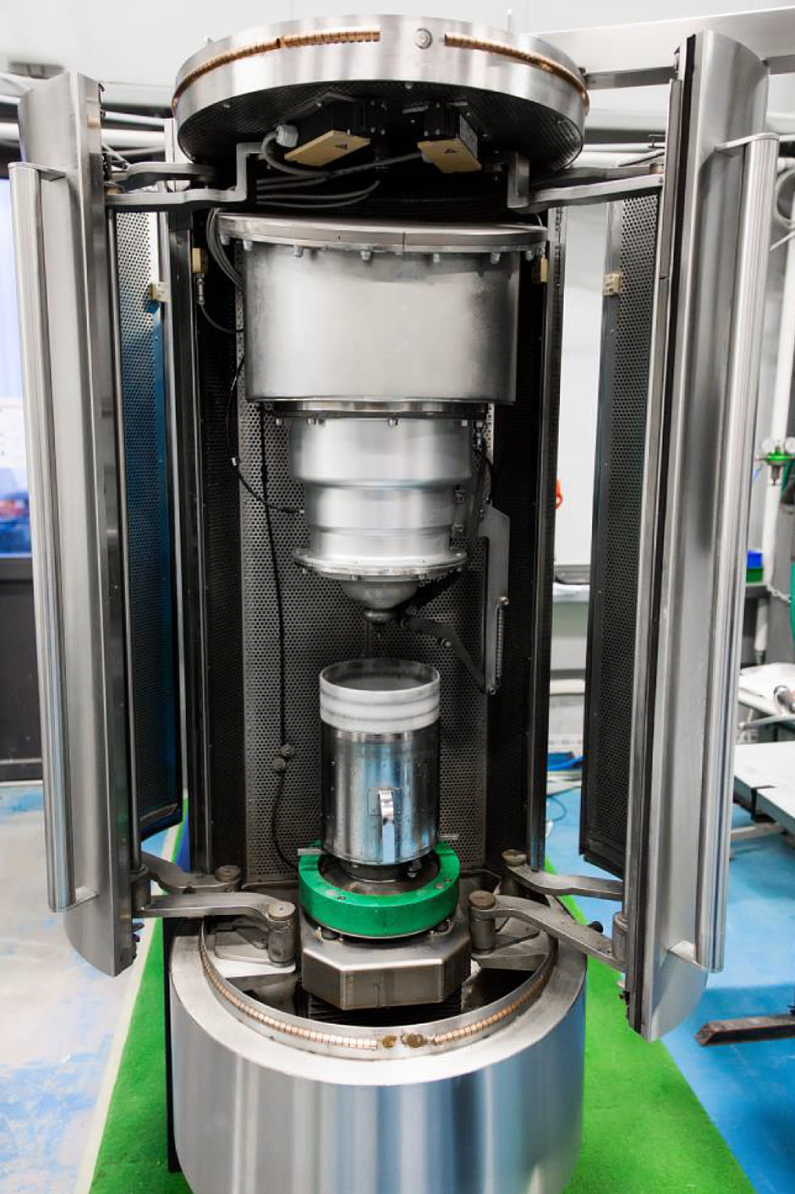
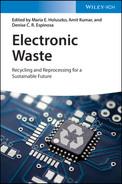
Figure 6.2 SELFRAG lab.
Source: Courtesy: SELFRAG (2012).
A comparison of ores crushed using SELFRAG (a high-voltage pulse fragmentation technology, shown in Figure 6.2) and ground using conventional methods at same specific energy showed that the pulse technology generates less fines and a significantly higher proportion of >95% liberated minerals in coarser size fraction (Wielen et al. Van Der Wielen et al. 2014). Shi et al. (2014) showed that an energy reduction of 5 kWh/t was achieved while simulating a grinding circuit with this technology.
SELFRAG (2012) showed that metals from e-waste could be separated without fine grinding as proper liberation is achieved during the fragmentation process. Since it utilizes a water as a process medium, the loss-to-fines is depressed, and a coarser liberation size also improves the recovery of the subsequent processes. Duan et al. (2015) showed that ∼98% of the copper gets liberated and concentrated in the −2 mm size when a printed circuit board was processed through the SELFRAG lab at 400 pulses.
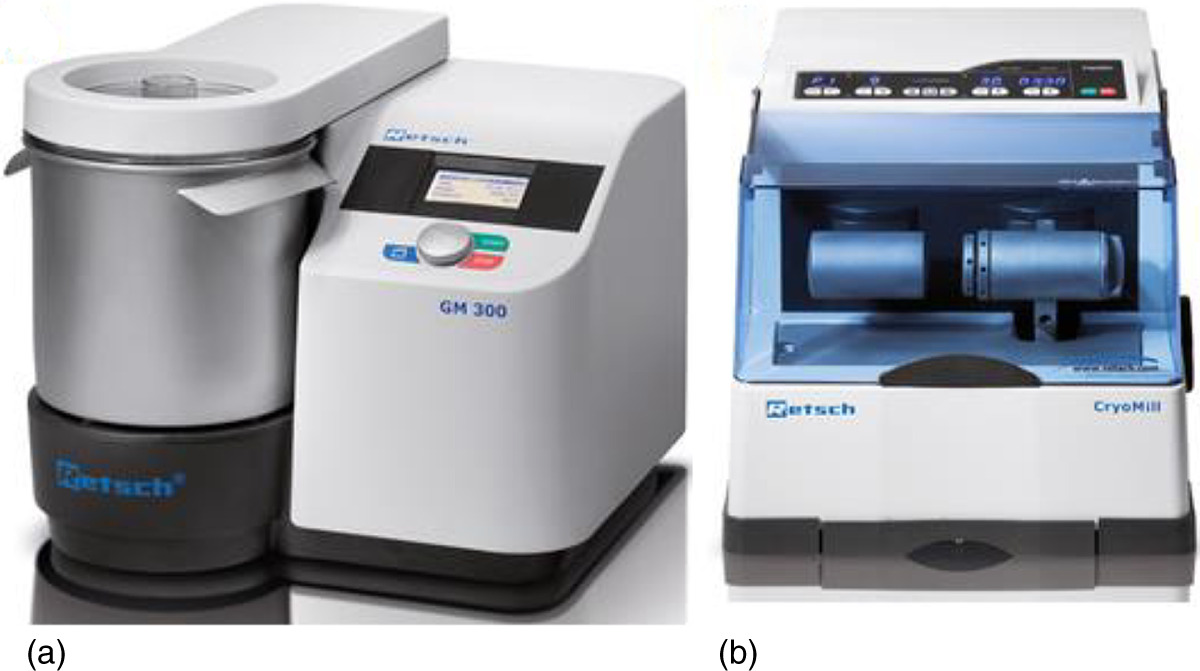
Figure 6.3 (a) GRINDOMIX GM 300 knife mill (b) CryoMill.
Source: Courtesy: Retsch.
6.3.4 Knife Mills
Knife mill is a low-volume cutting mill mostly used in the laboratory environment to create a fine powder. The material is fed to the cutting chamber fitted with sharp blades rotated by a high-speed motor. It is mostly used for grinding plastic and fibrous materials. Figure 6.3a shows the Retsch GRINDOMIX GM 300 knife mill. The motor capacity for this unit peaks at 3 kW, and it is capable of grinding materials from 130 mm to <300 μm. The grinding chamber has a capacity of 4.5 l and can be used dry or wet depending on the requirement.
6.3.5 Cryogrinding
Cryogrinding technology is another process for size reduction, especially suitable for a laboratory environment. The material is frozen at low temperatures using liquid nitrogen or liquid carbon dioxide, which induces the brittle nature in the sample. The sample is then placed in the grinding chamber, which is cooled by circulating liquid nitrogen continuously. The size reduction is mostly achieved by impact forces. The low temperature provided by liquid nitrogen suppresses the recrystallization of particles and thus leads to a finer particle size while reducing the contamination issues. Figure 6.3b shows the Retsch cryomill that can handle 20 ml materials and can reduce particle size from 8 mm to 5 μm. In a study, Zhou et al. (2016) showed that the cooling of the printed circuit board could help to reduce the energy expenditure during the comminution process, and the required liberation could quickly be achieved if the circuit boards are cooled at −30 °C for five minutes. This step makes the boards stiff and brittle, rendering them easier to crush.
6.4 Particle Size Analysis
The particle size plays an essential role in the processing of e-waste or ore. All equipment has an optimum particle size for its efficient functionality. Guo et al. (2011) and Ventura et al. (2018) have shown that metals usually get enriched in sizes below 1.25 mm and 1.7 mm, respectively, in crushed waste circuit boards with the highest concentration in the finest fraction, whereas Duan et al. (2015) have suggested that all metals could achieve nearly complete liberation in −1 mm size fraction. Many researchers have suggested a low separation efficiency of the mechanical process for −75 μm particles (Zhao et al. 2012).
Figure 6.4 Particle size distribution plot.
Particle size analysis could be conducted using mechanical screens for coarse particles (up to 38 μm) or laser-based sizing for fine particles (below 500 μm). Depending on the particle size, screening can be performed either dry or wet. The efficiency of dry screening decreases with particle size, and wet screening is preferred for fine particles. The particle size of a sample is most widely defined by its 80% or 50% cumulative passing sizes (D80 or D50), the screen size at which 80% or 50% of the total mass would pass through the screen. The D80 or D50 for a sample is obtained using sieve analysis where a given sample mass is placed on a stack of consecutive screens and shaken for 10–20 minutes to allow the particle to segregate based on sizes. The sample retained on each screen is then weighed to determine cumulative passing at each screen size and can be plotted, as shown in Figure 6.4. The D80 or D50 is obtained by interpolating the screen size and cumulative passing data.
The particle size distributions can also be represented using cumulative distribution functions such as Gaudin–Schuhmann equation for fine particles or Rosin–Rammler distribution for coarse particles. Rosin–Rammler distribution has shown a good fit for waste printed circuit boards, shredded electronics products, and solid waste (Quan et al. 2012; Sun et al. 2015; Vesilind 1980).
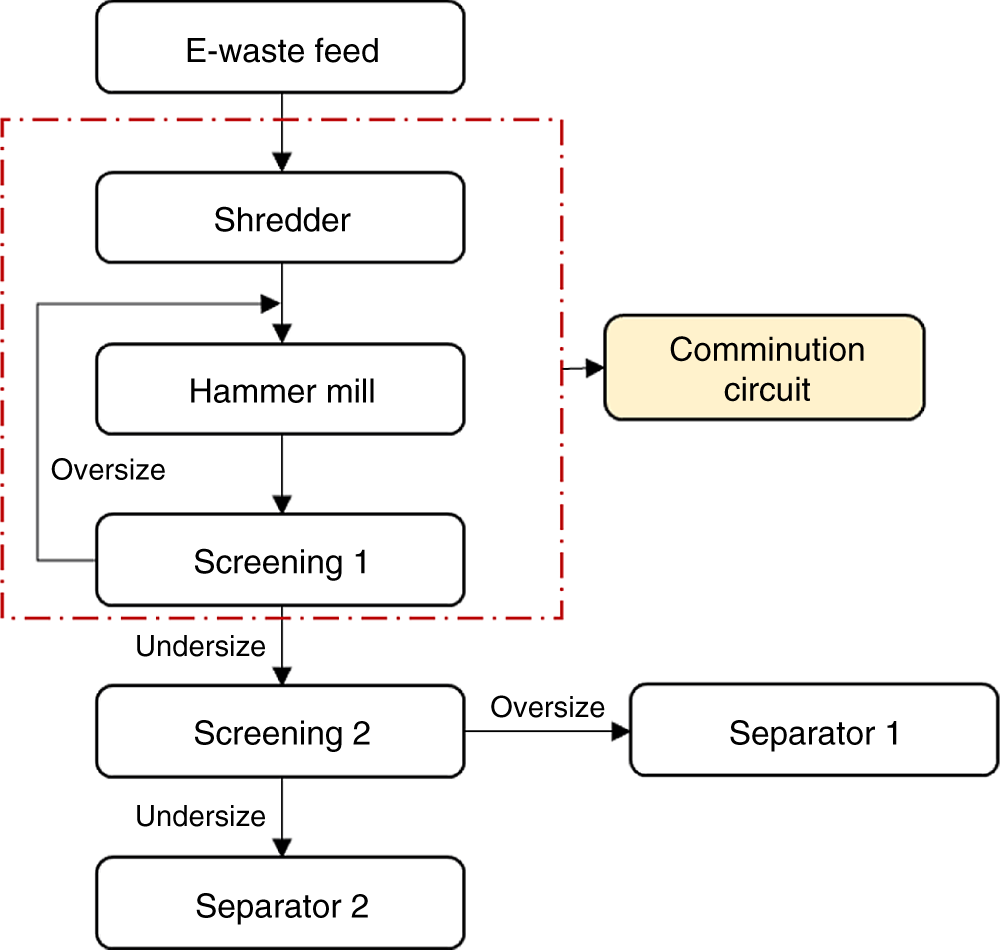
Figure 6.5 An example of a closed-circuit comminution circuit.
Where F(x) is cumulative percent passing at size X, X is the particle size, X’ is size modulus defining the theoretical maximum particle size, and n is distribution modulus defining the spread of the distribution (small n represents wide distribution).
6.5 Size Separation/Classification
Size separation is a crucial stage in processing and is used for two main reasons,
- Provide the optimum size range particles to specific downstream equipment
- Maintain a specific top size from the comminution circuit
A typical flowsheet for a comminution circuit is shown in Figure 6.5. It shows that the hammer mill is in the closed circuit with the first screen to provide a fixed top size to the subsequent process. Screen 2 is used to provide an optimum particle size range to individual separators. The two main sizing processes, namely screening and classification (hydrocyclones or air cyclones), could be used for size separation (Menad 2016).
6.5.1 Screening
Screening is the most commonly used process to separate particles by size to provide an optimum size range for the subsequent process to increase their process efficiency. In the case of close circuit comminution, it is used to prevent oversized materials from passing to the next stage. This process is mostly used for coarse applications (up to 1 mm), and the screening efficiency reduces with the reduction in particle size.
The most commonly used screens are the vibratory screens with perforated decks. These screens can be used as single, double, or triple deck depending on the process requirement. The decks have opening holes, and the diameter of these holes depends on the particle cut size. The particle larger than the opening size reports to the oversize, which could be recirculated back to the hammer mill. The particle smaller than the opening size would pass through the screen and report to the undersize, which is sent to the subsequent process. The perforated screen deck could be made of woven wire, polyurethane, rubber, or stainless steel depending on the properties of the materials being processed.
The efficiency of screens is estimated using the recovery of a particle at a given size, and amount of misplaced particles (fine particles reporting to the oversize) and can be calculated using the following equation,
Where Ru is the efficiency of undersize recovery and fx and Ox are fractions of material smaller than the cut size in feed and oversize.
The efficiency of screening depends on several machine and operating parameters as well as feed material properties. Some of these factors are:
- Feed rate: inversely proportional
- Screen angle: inversely proportional
- Particle shape: inversely proportional to extreme particle shapes
- Opening area: inversely proportional
- Vibration: excessive vibration would reduce screening efficiency
- Moisture: inversely proportional
The size (length and width) of the screen required could be estimated using Vibrating Screen Manufacturers Association (VSMA) equation for screening surface area calculation or Metso equation and is shown in the equation below (Olsen and Carnes 2016):
Where U is undersize tonnes per hour, S is safety factor, A is basic capacity factor, B is oversize percentage factor, C is half-size factor, D is deck location factor, E is wet screening factor, F is bulk density factor, G is screen surface open area factor, H is opening shape factor, and J is screen efficiency factor.
Once the required area is estimated, the screen would be selected based on the screen information available from different vendors.
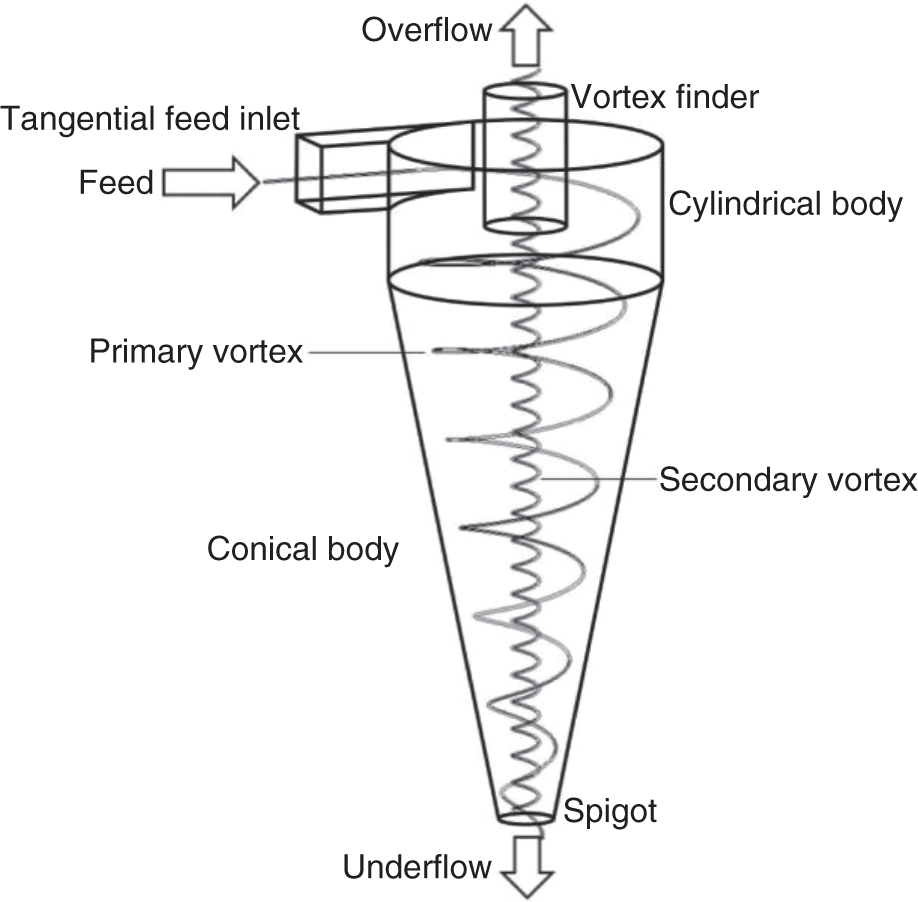
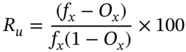
Figure 6.6 Schematic of a hydrocyclone.
Source: Vega-Garcia et al. (2018). Licensed under CC BY-4.0.
6.5.2 Classification
Classification is a size separation process based on the particle behavior in a fluid such as air or water. The process is suitable for fine particles (<1 mm) and mostly used in the final stage of comminution as a size control device before beneficiation.
The classification process depends on the forces acting on a particle in a fluid. The net resultant force on the particle dictates the movement of the particle. To achieve proper size classification, the direction of the net resulting force should be different for coarse and fine particles. The forces acting on the particle in the fluid are gravitational force, drag force, and centrifugal force. Depending on the solid density (amount of solids in the slurry by weight), the particle-settling behavior in the fluid can be defined as free settling or hindered settling. If particles of the same density are placed in a water medium, the coarser particle moves faster than finer particles, thus achieving separation. The classification units can be classified as gravitational or centrifugal depending on the forces acting on the particles.
6.5.2.1 Centrifugal Classifier
The most widely used centrifugal classifier in the processing industry is hydrocyclone. These are robust and relatively efficient size separators. The schematic of a hydrocyclone is shown in Figure 6.6. A hydrocyclone consists of a feed inlet, an apex/spigot (underflow discharge), a vortex finder (overflow discharge), and a cylindroconical body. The slurry is tangentially fed through the feed inlet under pressure and high velocity. The tangential feed inlet provides the rotational motion to the slurry that helps to create opposing forces, centrifugal force, and drag force. The high centrifugal force on the coarse particle moves it toward the outside wall, where it spirals downwards and reports to the underflow through apex/spigot. The finer particles remain in the center and move upward with the secondary vortex and then exit as overflow through the vortex finder. The cyclone diameter could vary from 13 mm to 900 mm depending on the requirement and could be used for classification down to 20 μm or sometimes lower.
The cut point of the hydrocyclone is the size that has an equal probability of reporting in underflow or overflow stream. The cut size for a hydrocyclone depends on the cyclone diameter and flow rate. The cut size increases with the cyclone diameter but decreases with flow rate. The efficiency of the cyclone is quantified using partition curves, which defines the percentage of a size fraction in the feed reporting to underflow. Ideally, the particles larger than cut size should report to underflow, whereas particles smaller than the cut size should report to overflow. However, in real operations, some particles are always misplaced. Some coarse particles that did not have sufficient opportunity to move to the underflow would report to overflow as short circuit, whereas some fine particles could become trapped among coarse particles and would report to the underflow as entrainment. The efficiency of separation is estimated using the following equation,

Where d75, d50, and d25 are particle sizes at the partition value of 0.75, 0.50, and 0.25. For the ideal scenario, imperfection would be 0.
Another criterion for cyclone performance is the amount of water in the underflow. In the ideal scenario, no water should report to underflow; however, the water content of <30% in underflow is considered to be good.
6.5.2.2 Gravitational Classifiers
Gravitational classifiers are simple and low-energy consuming classifiers that work on particle settling by gravity. The rake and spiral classifiers are the most common examples of gravitational classifiers. It comprises a tank with an inclined surface and a system to move settled material in an upwards motion. The coarse particles are settled due to their weight and get continuously extracted with the help of a mechanical device (Dunne 2019; Zhou et al. 2012).
In the case of spiral classifiers, one or two screws move the settled materials upward, whereas, in rake classifiers, an array of tines is used to separate the coarser material from the finer ones, as shown in Figure 6.7. The fine particles stay suspended in water and get discharged by overfilling the tank.
Some other gravitational classifiers are hydraulic classifiers such as Linatex, Reflux, Crossflow, Allux, and Floatex classifiers. These devices use gravity for separating coarse particles from fine particles instead of a mechanical system. The coarse particles form a bed at the bottom of the classifiers, and the fine particles are moved upward with water injection through a perforated bottom plate that moves fine particles to the overflow launder. The coarse particles are discharged through the lower part of the tank as thick pulp (Luttrell et al. 2006; Mankosa et al. 2019).
Figure 6.7 Mechanical size classification equipment: (a) spiral; and (b) rake.
Source: Wills and Finch (2016b).
6.6 Magnetic Separation
Magnetic separation has been utilized to remove the ferromagnetic elements, iron and nickel, and other iron scraps. It uses the difference in particle behavior in a magnetic field for separation. All particles can be classified as diamagnetic, paramagnetic, and ferromagnetic, depending on their magnetic properties.
Diamagnetic particles such as copper, gold silver, plastic, fibers are repelled from the magnetic field lines and would report to the nonmagnetic tailings bin. The paramagnetic particles such as platinum, manganese, tungsten are attracted to the magnetic field lines and would report to the magnetic concentrate bin during separation. The ferromagnetic particles such as iron, cobalt, and nickel are a special case of paramagnetic behavior where the particle retains magnetic property even after the removal of magnetic field lines. These particles would also report to the magnetic concentrate bin during separation.
A magnetic separator consists of a permanent magnet or electromagnet to generate the magnetic field and a conveyor to move particle over the field lines. The types of magnetic separators can broadly be classified into low- and high-intensity magnetic separators depending on their magnetic field intensity.
6.6.1 Low-Intensity Magnetic Separators
Low-intensity magnetic separators are used to separate ferromagnetic materials such as iron and nickel from the crushed e-waste. The magnetic field intensity used is <0.3 T, which is sufficient to take advantage of the high magnetic susceptibility of iron particles. The primary utilization of the low-intensity separator is in the form of cross-belt separators located over the conveyor. It is widely used to remove the coarse magnetic iron particles before the materials are fed to the hammer mills.
Another major type to the low-intensity separator is the rare-earth roll separator used in dry applications. The feed is moved using a conveyor, and a rare-earth magnetic roll is installed at one discharge end of the conveyor. The magnetic particles are attracted to the roll, move with the belt, and get discharged into the magnetic bins, whereas the nonmagnetic particles fly away from the belt due to the centrifugal forces from the rotating rolls and fall in the nonmagnetic bin as shown in Figure 6.8 (Wills and Finch 2016c). The roll speed, feed rate, field strength, and particle size are the major factors affecting the separation. In the case of wet applications, drum separators are the most widely used. It consists of a nonmagnetic drum fitted with magnets that rotate in a pool of slurry. The magnetic particles get pinned with the drum and lifted to the concentrate bin, whereas the nonmagnetic particles move with the slurry and get discharged into the tailings (Haldar 2018).
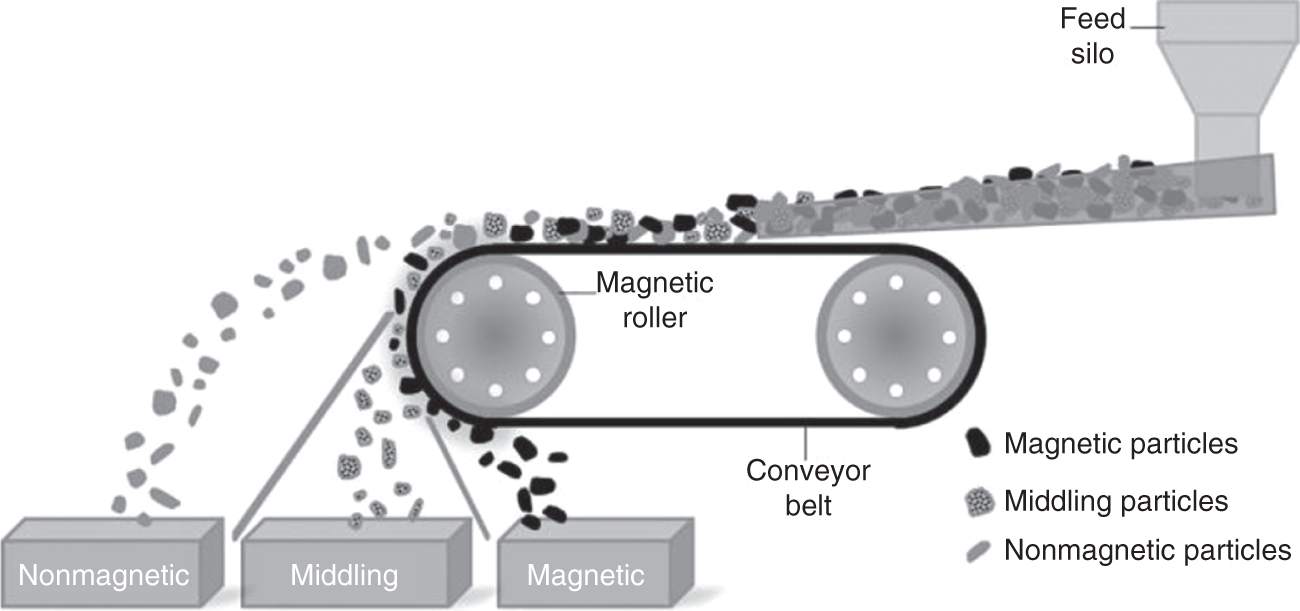
Figure 6.8 Rare-earth roll dry low-intensity magnetic separator.
Source: Miceli et al. (2017).
6.6.2 High-Intensity Magnetic Separators
These types of magnetic separators are useful for the separation of weakly magnetic particles (paramagnetic materials). The magnetic field could be generated using rare-earth alloy magnets or electromagnetic coils and is more useful for fine particles and low iron-containing materials.
The induced roll separator is one of the most common dry high-intensity magnetic separators where the material is fed directly on the rotating roll. The magnetic materials get pinned with the roll, whereas the nonmagnetic materials fly off the roll due to the centrifugal forces induced due to the roll rotation (Figure 6.9). Magnetic field strength up to 2 T could be achieved with this separator. Particle size and feed rate are the major factors for particle separation.
Wet high-intensity magnetic separators have successfully been used for fine hematite ores to produce iron ore concentrates and can be used for ultrafine particles too. Other magnetic separators such as high-gradient separators and superconducting separators are used for particles of very low magnetic susceptibility.
Yoo et al. (2009) used magnetic separation to recover 83% of iron and nickel as magnetic concentrate from shredder printed circuit boards. Veit et al. (2005) showed that a high iron and nickel concentration in the magnetic concentrate for printed circuit boards and electronic component scrap could be achieved at a low magnetic field strength of 0.65 T.
The iron concentration in the magnetic materials was increased to 41% compared to 27% in the feed with 89% iron recovery for fine (−0.6 mm) e-waste powder in a study conducted by Lee and Mishra (2018). In another study, up to 89% nickel and 98% iron were recovered for relatively coarse (+0.5 mm) circuit board particles at 0.1 and 0.8 T field strength (Fujita et al. 2014). Recently, Zhu et al. (2020) used a wet low-intensity magnetic separator for fine waste printed circuit board particles (−0.5 mm) to recover iron particles and suggested that magnetic separation is an effective method to recover high-grade magnetic particles.
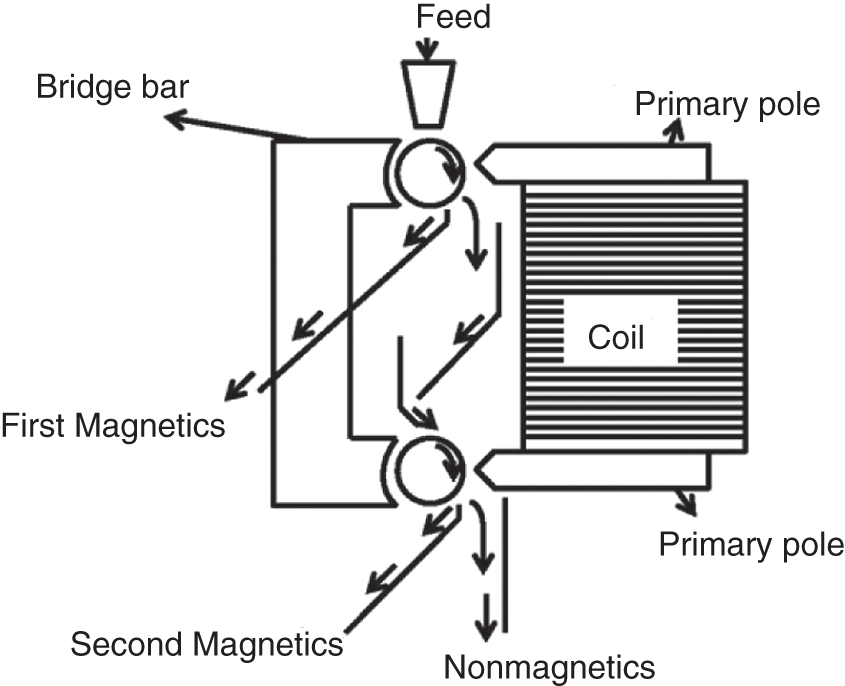
Figure 6.9 Induced roll magnetic separator.
Source: Tripathy et al. (2014).
6.7 Electrical Separation
Electrical separation is one of the most used techniques to recycle metals such as copper from nonmetals such as plastic and fibers. It uses the differences in electrical conductivity among various materials present in e-waste. One of the significant challenges with the process is its limitation to dry feed. For most efficient operation, the feed should be in monolayer, which also restricts its throughput. The separator needs to charge the particles to use the conductivity differences selectively. There are three main mechanisms of particle charging, ion bombardment (corona electrostatic), frictional charging (triboelectric), and eddy current. Corona electrostatic separation has been proven useful to separate metals from nonmetal streams in dry environment, whereas eddy current separation has been successfully utilized to extract aluminum from the nonferrous metal stream (Abdelbasir et al. 2018; Bizzo et al. 2014; Burat and Özer 2018; Das et al. 2009; Duan et al. 2009; Hsu et al. 2019; Kasper et al. 2015; Kaya 2016, 2018; Menad 2016; Veit et al. 2014).
6.7.1 Corona Electrostatic Separation
Corona separator uses ion bombardment as the method for particle charging. The charging process uses high voltage between two electrodes that ionize the gases near the electrodes forming a continuous flow of gaseous ions called the corona. When the feed particles pass through this corona, all particles receive a surface charge. When the particles move out of the corona, the nonconductive particles maintain the surface charge and get pinned to the rotor surface. Particles of high conductivity lose their surface charge as they quickly dissipate to the earthed rotor, and the centrifugal force induced due to the rotor rotation throws the particles away from the rotor/roll (Han et al. 2014).
Guo et al. (2011) obtained over 90% recovery for copper using electrostatic separation with a copper grade of 71%, whereas Veit et al. (2005) used electrostatic separation to enrich metal concentration to 50% Cu, 25% Sn, and 7% lead in printed circuit boards. Li et al. (2007) showed that the optimum particle size for electrostatic separation is 0.6–1.2 mm in circuit boards.
6.7.2 Triboelectric Separation
The triboelectric separator uses particle contact/friction as the method for particle charging. When two particles with different electrical properties come in contact and rub against each other, there is an exchange of electrons resulting in positively and negatively charged particles. If these charged particles are subjected to an electric field, the particles move toward oppositely polarized electrodes and hence provide the needed separation. The rubbing/friction between the particles is achieved by using a fluidized bed, and then the charged particles are allowed to free fall between two oppositely charged electrode plates. This process is more useful for plastics and other nonmetallic materials.
Saeki (2008) used triboelectric separation to recover 95% polyvinyl chloride (PVC) with 99% purity from a mixture of PVC, polyethylene terephthalate (PET), and polyethylene (PE), whereas 90% recovery of acrylonitrile butadiene styrene (ABS) with 99% purity was achieved from a mixture of ABS, polypropylene (PP), and polystyrene (PS). Dodbiba et al. (2002b) listed that the triboelectric charging sequence for various plastics is,
PC is polycarbonate and PTFE is polytetrafluoroethylene.
The sequence suggests that if two plastics (i.e. PE and PS) are rubbed against each other, the one on the left of the sequence (PS) gets a positive charge and one on the right of the sequence (PE) gets a negative charge. In a two-component mix of PET and PE, triboelectric separation could achieve over 95% grade of individual plastic. Other researchers have also concluded high grades and high recoveries for different plastics using triboelectric separation (Lee and Shin 2002; Li et al. 2015; Xiao et al. 2003; Zelmat et al. 2013).
Figure 6.10 shows a simplified schematic for a triboelectric separation system where particle charging is achieved via tribo-cyclone. The charged particles are gravity fed to the separation system and products are collected in the collecting bins.
In the field of nonmetal fraction from printed circuit boards recycling, Zhang et al. (2017) and Yang et al. (2019) used triboelectric separation to separate inorganics from the nonmetal fraction to improve the quality of the product. Overall, a concentrate yield of 47% was achieved with an organic content of 69%, recovery of 59%, and an upgradation ratio of 1.27 by Zhang et al. (2017). In the case of Yang et al. (2019), an upgradation ratio of 1.17 was achieved.

Figure 6.10 Design of a triboelectric separation system.
Source: Dodbiba et al. (2005).
6.7.3 Eddy Current Separation
Eddy current separation is widely used in the recycling industry to recover nonferrous metals such as aluminum and copper from electronic waste (Jujun et al. 2014; Ruan et al. 2017). The process is dictated from the generation of eddy current in particles when passing over a rotating magnetic field. When a nonferrous metal is placed in a high-speed rotating magnetic field, eddy currents generated in the nonferrous materials create a secondary magnetic field around itself. These particles are then repelled due to the same polarity of the two magnetic fields and hence separating the nonferrous metals from the mixture, as shown in Figure 6.11. It can be used to separate particles in size range of 3 mm–350 mm (Smith et al. 2019).
Eddy current separators were used to recovery over 90% aluminum from electronic scrap by Zhang et al. (1998). Bi et al. (2019) used eddy current separation to recover copper and aluminum from the crushed spent lithium iron phosphate batteries in size range of 2–20 mm. Li et al. (2017) used eddy current separator to recover printed circuit boards from crushed cell phones with over 95% separation efficiency. Ruan and Xu (2011) showed that this process is also an efficient method to separate aluminum from plastic in crushed waste toner cartridges.

Figure 6.11 Schematic of eddy current separator.
Source: Smith et al. (2019).
6.8 Gravity Separation
Gravity separation is one of the most common low-cost physical processing methods and has already being used for the separation of metals from nonmetals (Eswaraiah et al. 2008; Forssberg et al. 1998; Hanafi et al. 2012; He et al. 2015; Meng et al. 2018; Nekouei et al. 2018; Sarvar et al. 2015; Veit et al. 2014; Ventura et al. 2018; Wen et al. 2005b; Zhou et al. 2016). It has been successfully used in the separation of different types of plastic wastes too. Processes such as air classifiers, jigs, hydrocyclones, and float–sink have been widely studied in the separation of different types of plastics (Bauer et al. 2018; Ruj et al. 2015; Serranti and Bonifazi 2019).
A gravity separator utilizes the differences in the density of various metals and nonmetals as the basis of separation. If particles of same size are placed in a fluid, the high-density particles sink faster than the light-density particles. Since the density of most of the metals is higher compared to the nonmetals present in the e-waste, gravity separation is the most successful technique for the physical recycling of e-waste. The ease of gravity separation can be expressed by the concentration criterion and can be estimated using the equation below,
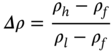
Where ρh, ρl, and ρf are the density of heavy material, light material, and the fluid medium.
Generally, if the concentration criterion is greater than 2.5, the gravity separation is relatively easy, and the efficiency of separation decreases with decreasing value of concentration criterion. Various gravity separation units are available at industrial scale for metal recycling from e-waste. Some of the most common separators are discussed in this section.
6.8.1 Jigs
Jigs are one of the oldest gravity separation technologies used in the mineral processing industry. The jigging process is a stratification of a particle bed by fluidization achieved by a pulsating flow of medium (Ambrós et al. 2019). Traditional jigs operate using pulsating water; however, air jigs have also been employed for dry application where constant airflow is used for stratification. Each pulsation cycle causes the particle bed to lift and then cause the heavy particle to settle first, followed by light particles causing the formation of a stratified bed. Ambrós et al. (2019) showed that particle-size distribution has a significant effect on the separation efficiency of a jig due to the packing effects. Particle shape, pulsation frequency, water flow rate, and feed density also affect efficiency (Sarvar et al. 2015).
Phengsaart et al. (2018) used a jig to achieve up to 98% copper recovery from shredded small home appliances. Sarvar et al. (2015) showed that the wet jigging could produce a metal concentrate with 94% recovery and 41% metal grade. The jigging process has also shown success in the separation of mixed plastics (Pita and Castilho 2016). Hori et al. (2009) used jigs with water pulsation to separate polyvinyl chloride (PVC), polyethylene terephthalate (PET), and polyethylene (PE) with a specific gravity difference as low as 0.11. Ito et al. (2010) showed that a bench-scale continuous jig could be used to separate PP and high-density polyethylene (HDPE) plastics with 99% product recovery.
6.8.2 Spirals
Spirals are simple, robust, and low-cost gravity separators where the slurry is fed at a solid density of ∼20–25% at the top of the spiral. As the slurry flows down the curved channel, lighter particles due to action of drag forces combined with the water flow report to the outer area of the spiral as tailings, while the heavier particles are pulled inward to the inner area of the spiral as a concentrate, thus effecting the separation. Wash water is continuously added at the inner area to flush any entrained light particles. Modern spirals are constructed from fiberglass and plastic and can treat particles down to 75 μm. The operating parameters are feed rate, pulp density, feed grade, splitter openings, the position of distributors, and the diameter of spirals.
No researchers have yet used spirals in the field of e-waste recycling; however, spiral concentrators have shown success in iron, coal, and rare-earth industry.

Figure 6.12 Schematic of a wet shaking table.
Source: Shariati et al. (2015). Licensed under CC BY-4.0.
6.8.3 Shaking Tables
The shaking table is the most widely used gravity separator in the recycling industry. The table consists of a riffled deck enabled to move in a reciprocating motion in a direction parallel to the riffler (Figure 6.12). The slope of the table could be adjusted depending on the requirement. When the table is given the reciprocating motion at a right angle to the flow of water, heavier minerals settle down in riffles and are carried along the diagonal line of the table as a concentrate. The lighter minerals do not settle in riffles and are washed along with the water as tailings. The riffles on the table form small jigging motion to stratify particles based on their density (Manser et al. 1991). The operating parameters are water flow rate, deck slope, feed throughput, stroke length, and pulp density. The solid density is generally maintained at is 25–30% (wt/wt).
Air tables have also been incorporated in the industry for dry gravity separation. Compressed air is pumped below the vibrating table with the surface fitted with a perforated cloth. The feed is introduced near the top of the inclined table. Lighter particles are lifted by the compressed air and flow downwards as tailings. The oscillating motion of the table causes the heavy minerals in contact with the table surface to move upward and are collected as a concentrate (Dodbiba and Fujita 2015).
Veit et al. (2014) used Mozley concentrator, a variance of shaking table, to recover 85% Cu, 95% Sn, 96% Ni, and 98% Ag from printed circuit boards at −1 + 0.25 mm size. The shaking table could also be used as a preconcentration stage to recover high-grade concentrate from subsequent processes (Das et al. 2009; Ventura et al. 2018; Xia et al. 2017). Liu et al. (2014) showed that the optimum size range for the shaking table is −1 + 0.074 mm, and recoveries over 90% could be achieved for Cu, Sn, and Al. A recovery of ∼80% of Cu and other metals was achieved for particles smaller than 1 mm using a wet shaking table by Wu et al. (2012) and Zhu et al. (2020). Pita and Castilho (2018) showed that wet shaking tables could also be used to separate copper from electric cable waste with high recoveries and high grades.
Researchers have also shown the applicability of air tables for metal recoveries from crushed printed circuit boards. Zhou et al. (2016) achieved recovery of nearly 95% with 60% metal grade in the air table concentrate. Air tables have also shown their applicability for the separation of low-density PP from high-density PET and PVC mixture with high recoveries and high grades (Dodbiba et al. 2005).
6.8.4 Zig-Zag Classifiers
Zig-zag classifiers are a dry classification system that uses an air stream to separate light particles from heavy particles. The classifier consists of several sections with rectangular cross-sections connected to form a zig-zag shaped channel. A current of upflowing air carries light particles upward while the heavy particles move downwards, thus achieving required separation (Senden 1980). The efficiency of the classifier is highly dependent on the particle size, airflow rate, feed rate, and the angle of the sections.
Yoo et al. (2009) used a zig-zag classifier on various size fractions at an optimized airflow rate to obtain light and heavy streams and achieved high recoveries up to 95% for particles larger than 0.6 mm. Recently, Da Silva et al. (2019) showed that zig-zag classifier is an economical and energy-efficient alternative for metal recovery from waste printed circuit boards.
6.8.5 Centrifugal Concentrators
Centrifugal concentrates such as Knelson concentrator and Falcon concentrator are highly efficient processes used to enhance the gravitational forces experienced by particle by adding high rotational speed, especially for fine particles. The feed slurry is pumped to the top of the feed inlet of the concentrator. In the centrifugal concentrator, the particles are accelerated up to 60–300 times the regular g-forces from the rotating bowl trapping the heavier particles in the grooves located in the bowl, whereas the lighter particles are flushed with the water and report to the tailing launder as shown in Figure 6.13. The centrifugal concentrator in most of the gold processing plants is batch operated with an optimum concentrate cycle. After the completion of the cycle, the heavy concentrate is flushed from the bowl into the concentrate launder (Chen et al. 2020; Oruç et al. 2010).
Zhang et al. (2018) showed that the high density of lithium cathode oxide could help to achieve a separation of lithium cathode oxide from spent lithium-ion batteries with over 80% grade and recovery using Falcon concentrator. The optimum particle size was determined to be −90 + 45 μm. Duane et al. (Duan et al. 2009), Wen et al. (2005b), and Yue-min (2006) showed that the Falcon concentrator could be used for metal recovery from crushed printed circuit boards with high recovery and high grades. In a study conducted by Kwon et al. (2016), Kelson concentrator was used to recover tantalum from the electronic components of printed circuit boards obtained from a laptop with ∼80% grade and recovery.

Figure 6.13 Schematic of a Knelson centrifugal concentrator.
Source: Chen et al. (2020).
6.8.6 Dense Medium Separation (DM Bath/Cyclone)
Dense media separation is the most common approach used in the coal industry to remove heavy inorganic materials from the light cleaner coal particles. The process uses a fluid medium at a given separation density to achieve separation. When a particle is placed in a fluid, it would either float or sink depending on fluid density. If the particle density is less than the fluid density, it floats to the surface, or else it would sink to the bottom. The fluid used for this process is mostly organic liquid of different specific gravities at lab scale; however, at the industrial scale, the required fluid density is achieved by mixing fine heavy media such as magnetite or ferrosilicon into water. This media could then be recycled using simple drum magnetic separators and reused.
The coarse material is mostly processed in a static bath (dense media bath) where the heavy particles are settled at the bottom and then carried out to the heavy launder by a removal mechanism such as a conveyor belt, whereas the light particles overflow or are scraped from the surface. For finer particle size, a dense medium cyclone is used. The working principle is similar to that of a hydrocyclone. The heavy particle moves toward the cyclone wall due to centrifugal forces and move to the bottom of the cyclone and get discharged through the spigot. The light particles are moved to the center and get discharged through the vortex finder. The separation density and theoretical grade and recovery for a gravity separator are established from a float–sink test.
A float–sink test is a simple lab-scale technique used to determine the gravity separation behavior for a given sample where the sample is subjected to increasing density liquids, and the floated and sunk fractions are analyzed from their properties. Previous researchers have utilized heavy liquids of higher densities (∼2.89 g/cm3) to separate the metallic fraction from the nonmetallic fraction (Bizzo et al. 2014). A lab-scale float–sink test was able to recover 75% of metallic fraction using organic liquids (Nekouei et al. 2018). Cui and Forssberg (2007) showed that over 88% of copper in the shredded television scrap could be recovered at a separation density of 1.4 g/cm3 with 42% copper grade.

Figure 6.14 End view of the drum separator.
Source: Dodbiba et al. (2002a).
Float–sink test based on heavy liquids has also been used to separate waste plastics into <1.0, 1.0–1.1, and 1.1–1.2 specific gravity ranges by Lee (2007). Pongstabodee et al. (2008) used a three-stage float-and-sink method to classify six different plastics into low (specific gravity: 0.90–1.00), medium (specific gravity: 1.00–1.20), and high (specific gravity: 1.20–1.40) density ranges. Choi (2004) used gravity separation to recover PVC (specific gravity 1.32–1.42) from a mix of polyolefin plastic waste (specific gravity: 0.90–1.06). Dodbiba et al. (2002a) used a drum separator at a speed of 1 RPM at a specific gravity of 1.11 to separate PET from polypropylene (PP). The schematic of the drum separator used by Dodbiba et al. (2002a) is shown in Figure 6.14. The light product overflows to the discharge launder, whereas the heavy sink product is carried up by the sink lifters and then discharged to the sink launder.
6.9 Froth Flotation
Froth flotation is a physicochemical separation process that utilizes the differences in the surface properties of various materials for separation in the water medium. This process depends on the selective attachment of air bubbles to one specific material/mineral in the sample and brings it to the surface where it is skimmed off to the concentrate launder.
The tendency of the air bubble attachment to a particle can be expressed using the contact angle. The contact angle depends on the work of adhesion, cohesion, and surface tension at the bubble, water, and solid interface. A contact angle of 0° represents complete wetting rendering the surface hydrophilic (water attracting), whereas a contact angle of 180° represents complete dewetting, rendering the surface hydrophobic (water repelling). The bubble selectively attaches to the hydrophobic particle leaving the hydrophilic particles in the slurry as tailings.
However, the contact angle measurement is possible for smooth and coarse particles. The surface energy or the bubble particle interaction could also be measured using inverse gas chromatography (IGC). The surface tension at three interfaces is highly affected by the surface properties of the solids and surface energy is one of the most important surface properties (Ali et al. 2013). One of the benefits of using an IGC for estimating the hydrophilicity/hydrophobicity of particles that it can be used on fine particles, powders, and rough/uneven surfaces. Mohammadi-Jam and Waters (2016) and Mohammadi-Jam et al. (2014) showed that decreasing the surface energy of particles decreased the work of adhesion with water and increased the floatability of particles and thus increasing hydrophobicity for different minerals.
Some particles such as plastics and nonmetals in e-waste are naturally hydrophobic, whereas the metals are naturally hydrophilic, making flotation a useful process for metal recycling. Inverse/reverse flotation is most studied for flotation for e-waste recycling where the unwanted particles are selectively floated, and the valuable materials are left behind in the slurry. Various reagents are added to the flotation process to aid with the flotation. The reagents can be classified as,
- Collectors: These are the chemicals that selectively adsorb on the surface of a particle, making it hydrophobic, and facilitates the bubble particle attachment. Examples: Xanthates, amines, oils, sulfonates, etc.
- Frother: This chemical helps with the formation of stable bubbles by interacting with the air–water interface and decreasing water/air surface tension. Examples: pine oil, methyl isobutyl carbinol, dow froth, etc.
- Activators: These are the chemicals that help with altering the chemical structure of the particle surface, thus helping collectors to adsorb on the given particle. Examples: metal ions, amines, etc.
- pH regulators: This group of chemicals is added to the slurry to alter the pH of the slurry and thus changing the surface charge and help with the adsorption process. Examples: lime, sodium hydroxide, etc.
- Dispersants: It is used to prevent fine particles to agglomerate by controlling the surface charge. Examples: polyphosphates, sodium silicate, starch, guar gum, etc.
- Depressants: It is used to prevent the adsorption of collectors on the particles rendering them hydrophilic. Examples: humic acids, sodium bisulfide, cyanide, etc.
A combination of these chemicals is used to help with the froth flotation process. However, researchers have shown high recovery without needing any additional chemical due to the nature of particles in the e-waste system. The nonmetal fractions such as fiberglass and plastics are naturally hydrophobic, whereas the metallic fraction is commonly hydrophilic. It should be noted that the flotation is highly dependent on particle size, reagent type, and dosage; hence, very carefully designed experiments at the lab scale are needed to optimize the process.
The flotation is mostly carried out in mechanical flotation cells in the industry as shown in Figure 6.15. It consists of a tank with a rotating impeller. The impeller design changes widely with the vendors; however, it delivers the same purpose. It helps with the agitation of the slurry and create air bubbles by breaking a stream of air. The air bubble rises in the slurry carrying the hydrophobic particles with it, which is skimmed from the surface. The largest flotation cell from Outotec has a capacity of 630 m3. Usually, flotation cells are installed in banks consisting of several (5–8) individual cells.
Column flotation cells are another type of flotation device commonly used at cleaner and recleaner stage to improve the metal grade. The bubble in the columns is generated directly through air spargers. Normally, the feed to the column enters one-third way down from the top and moves downwards where it encounters upward moving air bubbles. The hydrophobic particles are carried to the surface with the bubbles. Wash water is added at the surface using an array of perforated pipes to remove any entrained hydrophilic particles, thus increasing the grades.
Flotation without any reagent has shown a good metal recovery from waste printed circuit boards (Mäkinen et al. 2015; Ogunniyi and Vermaak 2009). Flotation using kerosene and terpenic oil showed a metallic recovery of over 84% at a particle size below 75 μm (He and Duan 2017), whereas soapy collector was used in the flotation experiments conducted by Zhu et al. (2019). He and Duan (2017) reported a copper recovery of 79%, whereas the recovery for Zhu et al. (2019) was only 47%, most likely due to larger particle size (−1 + 0.5 mm). Vidyadhar and Das (2013, 2012) showed that over 90% of the total metal in printed circuit boards could be recovered with a single-stage flotation process at 1 mm grind size. Frother flotation with fuel oil as collector and pine oil as frother showed over 95% metal recovery (Sarvar et al. 2015). Gallegos-Acevedo et al. (2014) showed that a metal-rich and a nonmetal rich stream could be obtained with the addition of 5 ppm frother with over 90% metal recovery.

Figure 6.15 The process of froth flotation.
Source: Crawford and Quinn (2017).
Separation of different plastics using froth flotation is another avenue for extensive research. Researchers have shown that the surface properties of plastics can be modified to increase or decrease the hydrophobicity of plastic particles, thus aiding with the flotation process. Table 6.1 lists some of the research conducted in the field of plastics flotation.
6.10 Sensor-Based Sorting
Sensor-based sorting is an automated material detection and removal system that uses high-precision sorter to identify the materials based on their physical and chemical signature and then remove it using an ejection system. It is an online, contactless real-time system that analyzes the particle properties along with its location. The sensor-based system has four major components (Wills and Finch 2016d),
- Particle presentation: Particle is fed to the sensor using a conveyor belt in a monolayer distribution.
- Sensing (particle examination/detection): Various sensor systems (listed in Table 6.2) have been developed to analyze the particle and capture the particle properties.
- Electronic processing (data analysis): The particle properties are processed using a lab-developed algorithm based on sensor type and ore properties.
- Separation: The particle rejection is achieved by a stream of air jets. Mechanical ejectors have also been employed for some sensing technologies.
6.11 Example Flowsheets
The European Recycling Platform have published the recycling process for some of the common e-waste items as shown in Figure 6.16. It shows that the recycling process starts with manual dismantling and removal of hazardous chemicals followed by the shredding and size reduction process. The separation of various components is achieved by a combination of physical separation processes and the recovered items are then sent for subsequent processes.
Table 6.1 Research in the field of flotation separation of various plastics present in e-waste.
| Authors | Materials | Reagents | Frother | Particle size |
|---|---|---|---|---|
| Abbasi et al. (2010) | PET and PVC | Tannic acid | MIBC | −6.23 + 2.78 mm |
| Barbakadze et al. (2018) | PVC, nylon, and HDPE | Ca lignosulfonate, tannic acid, methylcellulose, Triton X-100 | MIBC | 0.5–0.7 cm |
| Buchan and Yarar (1995) | PET, PVC, PE, and PP | Methanol | MIBC | −1.7 mm |
| Carvalho et al. (2010) | PE, PP, PS, PET, and PVC | Ca lignosulfonate, hostaphat | MIBC | 3–12 mm |
| Censori et al. (2016) | PS and ABS | Tannic acid | MIBC | 2–4 mm |
| Dodbiba et al. (2002a) | PET and PE or PP | Dodecylamine acetate, Polyvinyl alcohol | MIBC | 2–8 mm |
| Drelich et al. (1998, 1999) | PET and PVC | – | Rhodasurf 91-6 | 2–10 mm |
| Guern et al. (Le Guern et al. 2001; Le Guern et al. 2000) | PET and PVC | Na and NH4+ lignosulfonate | – | 3–10 mm |
| Güney et al. (2015) | PET and PVC | Diethylene glycol, lignin alkali | MIBC | −3.36 + 2 mm |
| Marques and Tenório (2000) | PET and PVC | Ca lignosulfonate | Pine oil and MIBC | −4.70 + 1.70 mm |
| Martin et al. (2011) | PET and PVC | – | Polyethylene glycol | 5 × 5 mm |
| Negari et al. (2018) | PS, PET, and PVC | Polyethylene glycol, polyvinyl alcohol, methylcellulose, tannic acid | MIBC | 5 mm diameter |
| Pascoe (2005) | ABS and HIPS | Acetic acid, methanol carboxymethyl cellulose, Quebracho | Pine oil | 5–10 mm |
| Pita and Castilho (2017) | PS, PMMA, PET, and PVC | Tannic acid | MIBC | −5.6 mm |
| Pongstabodee et al. (2008) | PET, HDPE, PVC, PP, PS, and ABS | Ca lignosulfonate | MIBC | 0.3–0.5 cm |
| Saisinchai (2014) | PET and PVC | Ca lignosulfonate | Pine oil | 5 × 5 mm |
| Saitoh et al. (1976) | PP, PE, PS, and PVC | Na lignosulfonate, tannic acid | – | 5 mm |
| Salerno et al. (2018) | PS and PVC | — | MIBC | 2–4 mm |
| Shen et al. (2001, 2002) | PET, PC, PMMA, PVC, PS, POM, and ABS | Tannic acid, alkyl ethoxylated nonionic surfactant (Tergitol 15-S-7) | MIBC | −5.6 mm −2.38 + 2.00 mm |
| Shibata et al. (1996) | PVC, PC, POM, and PPE | Na lignosulfonate, tannic acid, polyoxyethylene lauryl ether, aerosol OT, sorbitan monolaurate, polyvinyl alcohol, saponin | Pine oil | −4 + 2 mm |
| Singh (1998) | PVC and POM | Na lignosulfonate, sorbitan monolaurate | Pine oil | 2–4 mm |
| Takoungsakdakun and Pongstabodee (2007) | PET, POM, and PVC | Ca lignosulfonate polyvinyl alcohol | MIBC | 0.3–0.5 cm |
| Wang et al. (2013) | PE, PVC, PP, PS, PET, ABS, and PC | – | MIBC, Terpineol Diethyl phthalate | −4 mm |
| Wang et al. (2014) | PP, PE, PTFE, ABS, PS, PVC, PET, and PC | Lignin sulfonate, tannic acid, methylcellulose, Triton X-100 | – | −5 mm |
| Yenial et al. (2013) | PET and PVC | Diethylene glycol dibenzoate, Triton XL-100 N | MIBC | −3.36 + 2 mm |
| Zhao et al. (2019) | PET, PVC, and PE | Na lignosulfonate, tannic acid | MIBC, glycol | – |
a ABS – Acrylonitrile–butadiene–styrene, HDPE – High-density polyethylene, HIPS – High-impact polystyrene, PC – Polycarbonates, PE – Polyethylene, PET – Polyethylene terephthalate, PMMA – Polymethyl methacrylate, POM – Polyoxymethylene or Polyacetal, PP – Polypropylene, PPE – Polyphenylene ether, PS – Polystyrene, PTFE – Polytetrafluoroethylene, PVC – Polyvinyl chloride.
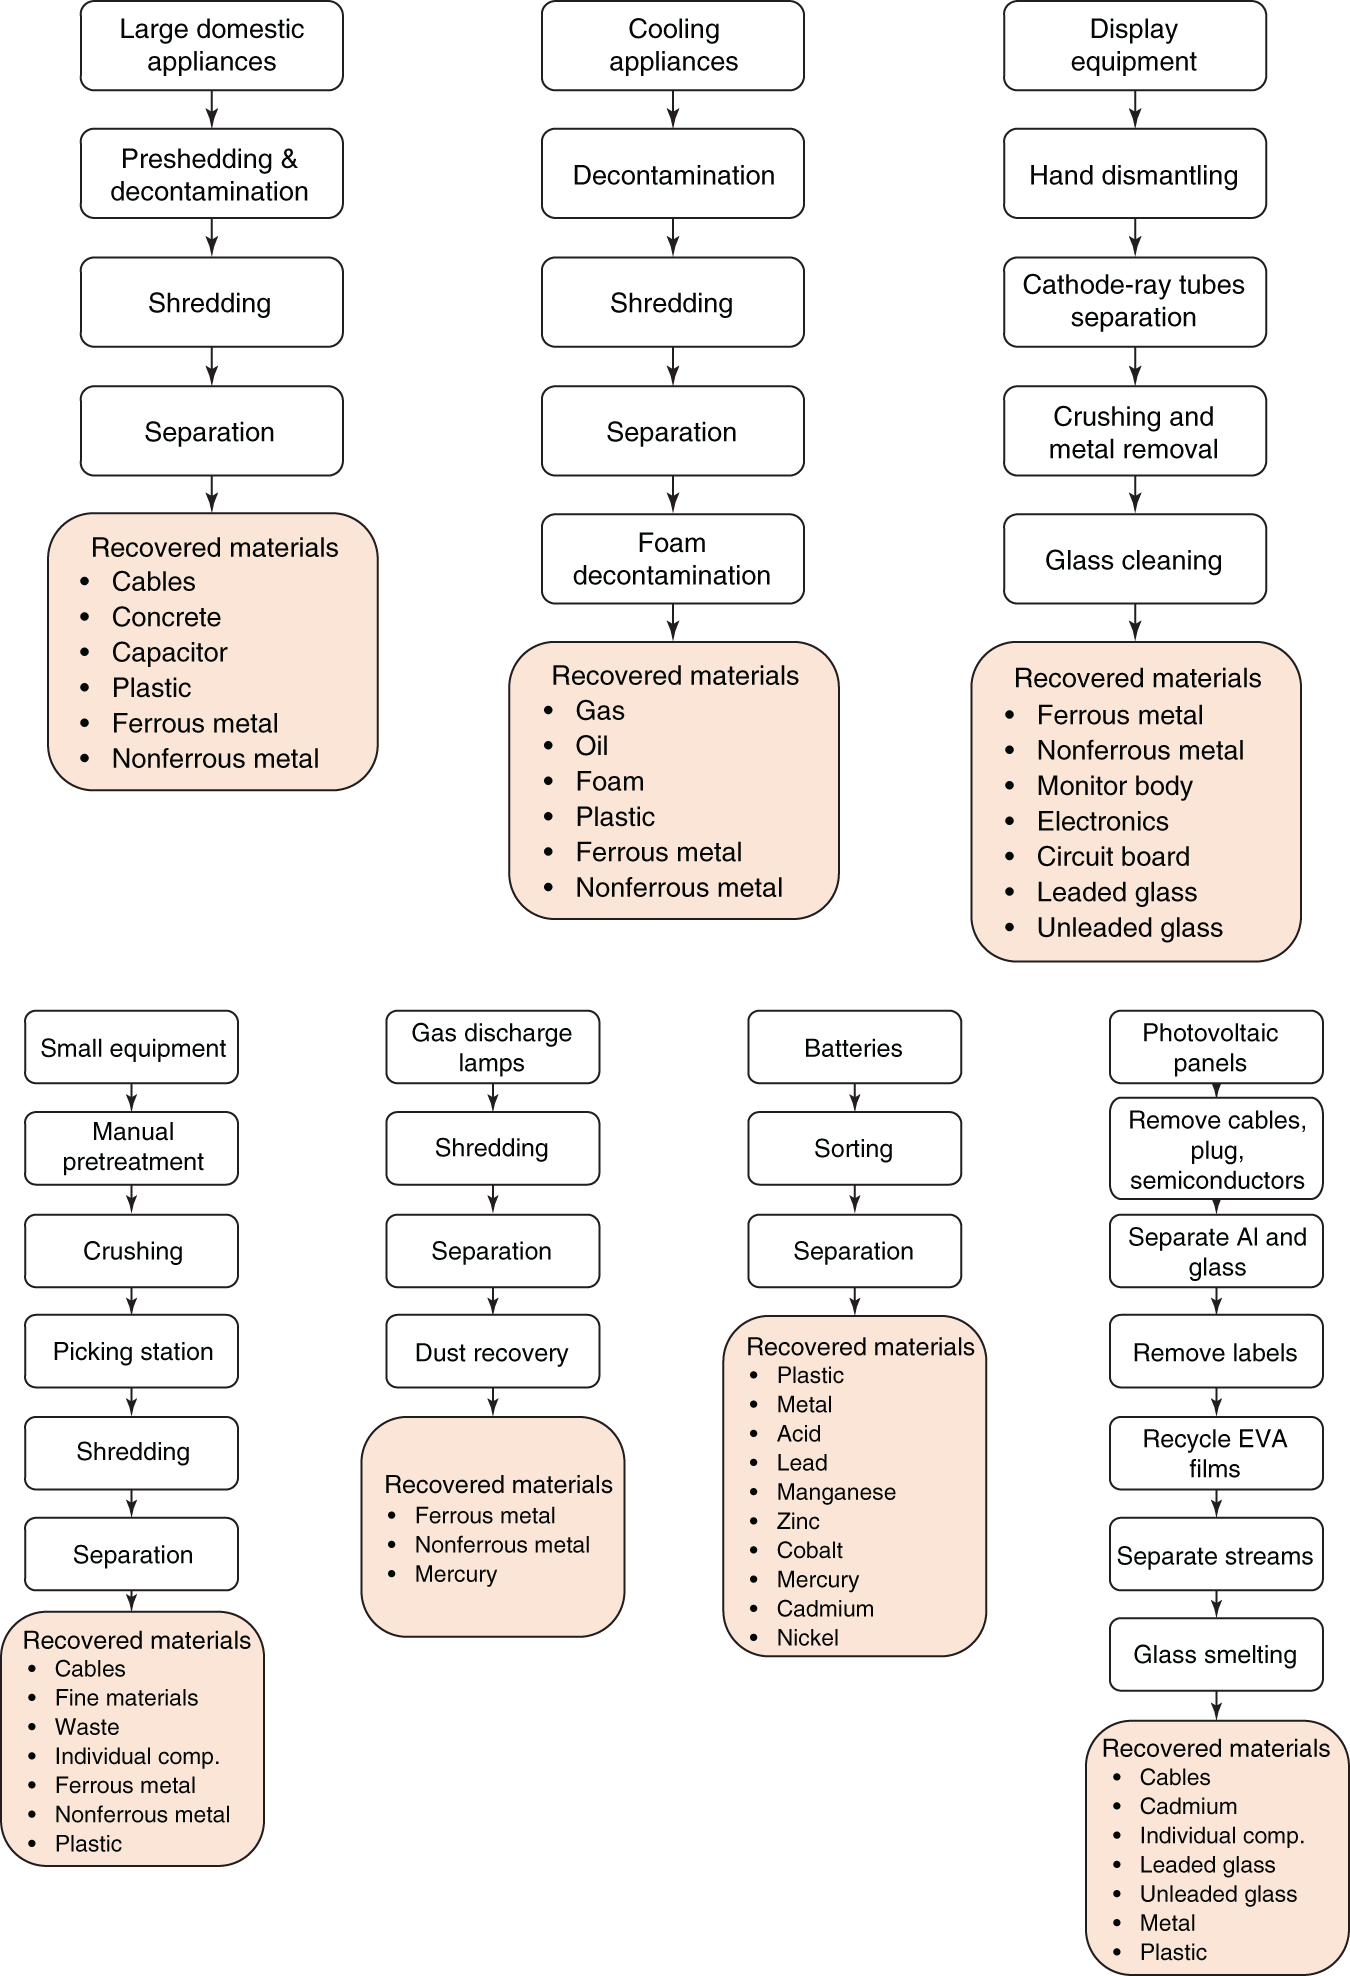
Figure 6.16 Recycling process and recovered materials from various e-waste units.
Source: Based on European Recycling Platform (2017)
.
Table 6.2 Sensor technologies.
| Sensors | Physical properties | Application |
|---|---|---|
| Prompt gamma neutron activation analysis | Elemental composition | Metals |
| X-ray transmission | Density | Metal, glass, plastic |
| X-ray fluorescence | Elemental composition | Metal separation |
| Photometric | Color | Circuit board, glass, plastic |
| Near-infrared spectroscopy | Infrared absorption | Plastic, rubber, polymers |
| Electromagnetic induction | Conductivity | Metal separation |
| Laser-induced breakdown spectroscopy | Elemental composition | Metal separation, flame retardants |
Sources: Based on Hilscher et al. (2017) and Wills and Finch (2016d).
References
- Abbasi, M., Salarirad, M.M., and Ghasemi, I. (2010). Selective separation of PVC from PET/PVC mixture using floatation by tannic acid depressant. Iranian Polymer Journal 19 (7): 483–489. https://www.researchgate.net/publication/229057122_Selective_Separation_of_PVC_from_PETPVC_Mixture_Using_Floatation_by_Tannic_Acid_Depressant (accessed 18 March 2021).
- Abdelbasir, S.M., Hassan, S.S.M., Kamel, A.H., and El-Nasr, R.S. (2018). Status of electronic waste recycling techniques: a review. Environmental Science and Pollution Research 25 (17): 16533–16547. https://doi.org/10.1007/s11356-018-2136-6.
- Ali, S.S.M., Heng, J.Y.Y., Nikolaev, A.A., and Waters, K.E. (2013). Introducing inverse gas chromatography as a method of determining the surface heterogeneity of minerals for flotation. Powder Technology 249: 373–377. https://doi.org/10.1016/J.POWTEC.2013.09.004.
- Ambrós, W.M., Sampaio, C.H., Cazacliu, B.G. et al. (2019). Some observations on the influence of particle size and size distribution on stratification in pneumatic jigs. Powder Technology 342: 594–606. https://doi.org/10.1016/J.POWTEC.2018.10.029.
- Barbakadze, K., Brostow, W., Granowski, G. et al. (2018). Separation of metal and plastic wastes from wire and cable manufacturing for effective recycling. Resources, Conservation and Recycling 139: 251–258. https://doi.org/10.1016/J.RESCONREC.2018.06.022.
- Bauer, M., Lehner, M., Schwabl, D. et al. (2018). Sink–float density separation of post-consumer plastics for feedstock recycling. Journal of Material Cycles and Waste Management 20 (3): 1781–1791. https://doi.org/10.1007/s10163-018-0748-z.
- Bi, H., Zhu, H., Zu, L. et al. (2019). A new model of trajectory in eddy current separation for recovering spent lithium iron phosphate batteries. Waste Management 100: 1–9. https://doi.org/10.1016/J.WASMAN.2019.08.041.
- Bizzo, W., Figueiredo, R., and de Andrade, V. (2014). Characterization of printed circuit boards for metal and energy recovery after milling and mechanical separation. Materials 7 (6): 4555–4566. https://doi.org/10.3390/ma7064555.
- Buchan, R. and Yarar, B. (1995). Recovering plastics for recycling by mineral processing techniques. Journal of The Minerals Metals & Materials Society 47 (2): 52–55. https://doi.org/10.1007/BF03221410.
- Burat, F. and Özer, M. (2018). Physical separation route for printed circuit boards. Physicochemical Problems of Mineral Processing 54 (2): 554–566. https://doi.org/10.5277/ppmp1858.
- Carvalho, T., Durão, F., and Ferreira, C. (2010). Separation of packaging plastics by froth flotation in a continuous pilot plant. Waste Management 30 (11): 2209–2215. https://doi.org/10.1016/J.WASMAN.2010.05.023.
- Censori, M., La Marca, F., and Carvalho, M.T. (2016). Separation of plastics: the importance of kinetics knowledge in the evaluation of froth flotation. Waste Management (New York, N.Y.) 54: 39–43. https://doi.org/10.1016/j.wasman.2016.05.021.
- Chen, Q., Yang, H., Tong, L. et al. (2020). Research and application of a Knelson concentrator: a review. Minerals Engineering 152: 106339. https://doi.org/10.1016/J.MINENG.2020.106339.
- Choi, W.Z. (2004). Removal of PVC from mixed plastic waste by gravity separation process. Geosystem Engineering 7 (3): 57–62. https://doi.org/10.1080/12269328.2004.10541221.
- Crawford, C.B. and Quinn, B. (2017). Microplastic separation techniques. In: Microplastic Pollutants (eds. C.B. Crawford and B.B.T.-M.P. Quinn), 203–218. Elsevier https://doi.org/https://doi.org/10.1016/B978-0-12-809406-8.00009-8.
- Cui, J. and Forssberg, E. (2007). Characterization of shredded television scrap and implications for materials recovery. Waste Management 27 (3): 415–424. https://doi.org/10.1016/J.WASMAN.2006.02.003.
- Da Silva, M.D.F., Dutra, A.J.B., and Mansur, M.B. (2019). Enrichment of copper, lead, and tin by mechanical dry processing of obsolete printed circuit board residues. Materials Research 22 (5) https://doi.org/10.1590/1980-5373-MR-2019-0341.
- Das, A., Vidyadhar, A., and Mehrotra, S.P. (2009). A novel flowsheet for the recovery of metal values from waste printed circuit boards. Resources, Conservation and Recycling 53 (8): 464–469. https://doi.org/10.1016/j.resconrec.2009.03.008.
- Dodbiba, G., Haruki, N., Shibayama, A. et al. (2002a). Combination of sink–float separation and flotation technique for purification of shredded PET-bottle from PE or PP flakes. International Journal of Mineral Processing 65 (1): 11–29. https://doi.org/10.1016/S0301-7516(01)00056-4.
- Dodbiba, G., Sadaki, J., Okaya, K. et al. (2005). The use of air tabling and triboelectric separation for separating a mixture of three plastics. Minerals Engineering 18 (15): 1350–1360. https://doi.org/10.1016/J.MINENG.2005.02.015.
- Dodbiba, G. and Fujita, T. (2015). Air tabling—a dry gravity solid–solid separation technique. In: Progress in Filtration and Separation (ed. S. Tarleton), 527–555. Academic Press https://doi.org/10.1016/B978-0-12-384746-1.00012-4.
- Dodbiba, G., Shibayama, A., Miyazaki, T., and Fujita, T. (2002b). Electrostatic separation of the shredded plastic mixtures using a tribo-cyclone. Magnetic and Electrical Separation 11 (1–2): 63–92. https://doi.org/10.1080/07313630290002626.
- Drelich, J., Kim, J.H., Payne, T. et al. (1999). Purification of polyethylene terephthalate from polyvinyl chloride by froth flotation for the plastics (soft-drink bottle) recycling industry. Separation and Purification Technology 15 (1): 9–17. https://doi.org/10.1016/S1383-5866(98)00047-1.
- Drelich, J., Payne, T., Kim, J.H. et al. (1998). Selective froth flotation of PVC from PVC/PET mixtures for the plastics recycling industry. Polymer Engineering & Science 38 (9): 1378–1386. https://doi.org/10.1002/pen.10308.
- Duan, C., Wen, X., Shi, C. et al. (2009). Recovery of metals from waste printed circuit boards by a mechanical method using a water medium. Journal of Hazardous Materials 166 (1): 478–482. https://doi.org/10.1016/j.jhazmat.2008.11.060.
- Duan, C.L., Diao, Z.J., Zhao, Y.M., and Huang, W. (2015). Liberation of valuable materials in waste printed circuit boards by high-voltage electrical pulses. Minerals Engineering 70: 170–177. https://doi.org/10.1016/j.mineng.2014.09.018.
- Dunne, R.C. (2019). Mechanical classifiers. In: SME Mineral Processing & Extractive Metallurgy Handbook (eds. S.K. Kawatra and C.A. Young), 625–632. Society for Mining, Metallurgy, and Exploration. https://app.knovel.com/web/view/khtml/show.v/rcid:kpSMEMPEM1/cid:kt011IX673/viewerType:khtml//root_slug:sme-mineral-processing/url_slug:mechanical-classifiers?page=last&view=collapsed&zoom=1 (accessed 18 March 2021).
- Ekman, R. (2018). Development of a Plastic Shredder. Lund University.
- Eswaraiah, C., Kavitha, T., Vidyasagar, S., and Narayanan, S.S. (2008). Classification of metals and plastics from printed circuit boards (PCB) using air classifier. Chemical Engineering and Processing: Process Intensification 47 (4): 565–576. https://doi.org/10.1016/J.CEP.2006.11.010.
- European Recycling Platform. (2017). What happens to your waste • ERP UK. https://erp-recycling.org/uk/learning-centre/what-happens-to-your-waste (accessed 18 March 2021).
- Fitzgerald, G. C. (2009). Technical and Economic Analysis of Pre-Shredding Municipal Solid Wastes Prior to Disposal. Columbia University.
- Forssberg, E., Zhang, S., & Björkman, B. (1998). Metals recycling from electronic scrap by air table separation: theory and application. EPD Congress, 497–515. http://www.diva-portal.org/smash/record.jsf?pid=diva2%3A1003563&dswid=1889 (accessed 18 March 2021).
- Fujita, T., Ono, H., Dodbiba, G., and Yamaguchi, K. (2014). Evaluation of a recycling process for printed circuit board by physical separation and heat treatment. Waste Management 34 (7): 1264–1273. https://doi.org/10.1016/J.WASMAN.2014.03.002.
- Gallegos-Acevedo, P.M., Espinoza-Cuadra, J., and Olivera-Ponce, J.M. (2014). Conventional flotation techniques to separate metallic and nonmetallic fractions from waste printed circuit boards with particles nonconventional size. Journal of Mining Science 50 (5): 974–981. https://doi.org/10.1134/S1062739114050172.
- Ghosh, B., Ghosh, M.K., Parhi, P. et al. (2015). Waste printed circuit boards recycling: an extensive assessment of current status. Journal of Cleaner Production 94: 5–19. https://doi.org/10.1016/J.JCLEPRO.2015.02.024.
- Güney, A., Özdilek, C., Kangal, M.O., and Burat, F. (2015). Flotation characterization of PET and PVC in the presence of different plasticizers. Separation and Purification Technology 151: 47–56. https://doi.org/10.1016/J.SEPPUR.2015.07.027.
- Guo, C., Wang, H., Liang, W. et al. (2011). Liberation characteristic and physical separation of printed circuit board (PCB). Waste Management 31 (9–10): 2161–2166. https://doi.org/10.1016/J.WASMAN.2011.05.011.
- Haldar, S.K. (2018). Mineral processing. In: Mineral Exploration, 2e, 259–290. Elsevier https://doi.org/10.1016/B978-0-12-814022-2.00013-7.
- Han, S., Park, S., Kim, S., and Park, J. (2014). Simulation on the PCB particle trajectories in Corona-discharge electrostatic separator. Journal of the Korean Institute of Resources Recycling 23 (6): 30–39. https://doi.org/10.7844/kirr.2014.23.6.30.
- Hanafi, J., Jobiliong, E., Christiani, A. et al. (2012). Material recovery and characterization of PCB from electronic waste. Procedia – Social and Behavioral Sciences 57: 331–338. https://doi.org/10.1016/J.SBSPRO.2012.09.1194.
- He, J. and Duan, C. (2017). Recovery of metallic concentrations from waste printed circuit boards via reverse floatation. Waste Management 60: 618–628. https://doi.org/10.1016/J.WASMAN.2016.11.019.
- He, J.F., Duan, C.L., He, Y.Q., and Zhang, H.J. (2015). Recovery of valuable metal concentrate from waste printed circuit boards by a physical beneficiation technology. International journal of Environmental Science and Technology 12 (8): 2603–2612. https://doi.org/10.1007/s13762-014-0664-2.
- Hilscher, B., Nayak, P., Lorio, L., & Yoon, N. (2017). Technical Review and Evaluation of Ore Sorting Technologies on Precious Metals Operations – CEEC (Coalition for Eco Efficient Comminution). 49th Annual Conference of Metallurgists.
- Hori, K., Tsunekawa, M., Ueda, M. et al. (2009). Development of a new gravity separator for plastics – a hybrid jig. Materials Transactions 50 (12): 2844–2847. https://doi.org/10.2320/matertrans.M-M2009825.
- Hsu, E., Barmak, K., West, A.C., and Park, A.-H.A. (2019). Advancements in the treatment and processing of electronic waste with sustainability: a review of metal extraction and recovery technologies. Green Chemistry 21 (5): 919–936. https://doi.org/10.1039/C8GC03688H.
- Ito, M., Tsunekawa, M., Ishida, E. et al. (2010). Reverse jig separation of shredded floating plastics – separation of polypropylene and high density polyethylene. International Journal of Mineral Processing 97 (1–4): 96–99. https://doi.org/10.1016/J.MINPRO.2010.08.007.
- Jujun, R., Yiming, Q., and Zhenming, X. (2014). Environment-friendly technology for recovering nonferrous metals from e-waste: eddy current separation. Resources, Conservation and Recycling 87: 109–116. https://doi.org/10.1016/J.RESCONREC.2014.03.017.
- Kasper, A.C., de Juchneski, N.C., F., and Veit, H.M. (2015). Mechanical processing. In: Electronic Waste: Recycling Techniques Recycling Techniques (eds. H.M. Veit and A.M. Bernardes), 19–38. Springer https://doi.org/10.1007/978-3-319-15714-6_4.
- Kaya, M. (2016). Recovery of metals and nonmetals from electronic waste by physical and chemical recycling processes. Waste Management 57: 64–90.
- Kaya, M. (2018). Current WEEE recycling solutions. In: Waste Electrical and Electronic Equipment Recycling (eds. F. Vegliò and I. Birloaga), 33–93. Woodhead Publishing https://doi.org/10.1016/B978-0-08-102057-9.00003-2.
- Kwon, S., Park, S., Kim, S. et al. (2016). Separation of tantalum from electronic components on laptop printed circuit board assembly. Journal of the Korean Institute of Resources Recycling 25 (1): 24–30. https://doi.org/10.7844/kirr.2016.25.1.24.
- Le Guern, C., Baillif, P., Conil, P., and Houot, R. (2001). Adsorption of a lignosulphonate polymer onto PVC and PET surfaces: evaluation by XPS. Journal of Materials Science 36 (6): 1547–1554. https://doi.org/10.1023/A:1017565201410.
- Le Guern, C., Conil, P., and Houot, R. (2000). Role of calcium ions in the mechanism of action of a lignosulphonate used to modify the wettability of plastics for their separation by flotation. Minerals Engineering 13 (1): 53–63. https://doi.org/10.1016/S0892-6875(99)00149-1.
- Lee, H. and Mishra, B. (2018). Selective recovery and separation of copper and iron from fine materials of electronic waste processing. Minerals Engineering 123: 1–7. https://doi.org/10.1016/J.MINENG.2018.04.021.
- Lee, J.-K. and Shin, J.-H. (2002). Triboelectmstatic separation of PVC materials from mixed plastics waste plastic recycling. Korean Journal of Chemical Engineering 19 (2): 267–272.
- Lee, K.-H. (2007). Pyrolysis of municipal plastic wastes separated by difference of specific gravity. Journal of Analytical and Applied Pyrolysis 79 (1–2): 362–367. https://doi.org/10.1016/J.JAAP.2006.12.020.
- Li, J., Jiang, Y., and Xu, Z. (2017). Eddy current separation technology for recycling printed circuit boards from crushed cell phones. Journal of Cleaner Production 141: 1316–1323. https://doi.org/10.1016/J.JCLEPRO.2016.09.144.
- Li, J., Wu, G., and Xu, Z. (2015). Tribo-charging properties of waste plastic granules in process of tribo-electrostatic separation. Waste Management 35: 36–41. https://doi.org/10.1016/J.WASMAN.2014.10.001.
- Li, J., Xu, Z., and Zhou, Y. (2007). Application of corona discharge and electrostatic force to separate metals and nonmetals from crushed particles of waste printed circuit boards. Journal of Electrostatics 65 (4): 233–238. https://doi.org/10.1016/J.ELSTAT.2006.08.004.
- Liu, W., Liang, C., Qin, W., and Jiao, F. (2014). A new technology for recovery of metals from waste printed circuit boards. Applied Mechanics and Materials 675–677: 698–703. https://doi.org/10.4028/http://www.scientific.net/AMM.675-677.698.
- Luttrell, G.H., Honaker, R.Q., Bratton, R.C. et al. (2006). In-Plant Testing of High-Efficiency Hydraulic Separators. Virginia Polytechnic Institute and State University https://doi.org/10.2172/907775.
- Mäkinen, J., Bachér, J., Kaartinen, T. et al. (2015). The effect of flotation and parameters for bioleaching of printed circuit boards. Minerals Engineering 75: 26–31. https://doi.org/10.1016/J.MINENG.2015.01.009.
- Mankosa, M.J., Kohmuenc, J.N., and Honaker, R.Q. (2019). Fluidized-bed classifiers. In: SME Mineral Processing & Extractive Metallurgy Handbook (eds. S.K. Kawatra and C.A. Young), 611–624. Society for Mining, Metallurgy, and Exploration.
- Manser, R.J., Barley, R.W., and Wills, B.A. (1991). The shaking table concentrator – the influence of operating conditions and table parameters on mineral separation – the development of a mathematical model for normal operating conditions. Minerals Engineering 4 (3–4): 369–381. https://doi.org/10.1016/0892-6875(91)90142-I.
- Marques, G.A. and Tenório, J.A.S. (2000). Use of froth flotation to separate PVC/PET mixtures. Waste Management 20 (4): 265–269. https://doi.org/10.1016/S0956-053X(99)00333-5.
- Martin, N., Skvarla, J., and Sisol, M. (2011). A possibility of using the flotation process to separate plastics. International Journal of Engineering. https://www.researchgate.net/publication/283601296_A_Possibility_of_using_the_flotation_process_to_separate_plastics (accessed 18 March 2021) 9 (3): 275–278.
- Menad, N.-E. (2016). Physical separation processes in waste electrical and electronic equipment recycling. In: WEEE Recycling (eds. A. Chagnes, G. Cote, C. Ekberg, et al.), 53–74. Elsevier. https://doi.org/10.1016/B978-0-12-803363-0.00003-1.
- Meng, L., Zhong, Y., Guo, L. et al. (2018). Recovery of Cu and Zn from waste printed circuit boards using super-gravity separation. Waste Management 78: 559–565. https://doi.org/10.1016/J.WASMAN.2018.06.022.
- Miceli, H., Rossi, M.G., Neumann, R., and Tavares, L.M. (2017). Contaminant removal from manufactured fine aggregates by dry rare-earth magnetic separation. Minerals Engineering 113: 15–22. https://doi.org/10.1016/j.mineng.2017.07.017.
- Mohammadi-Jam, S., Burnett, D.J., and Waters, K.E. (2014). Surface energy of minerals – applications to flotation. Minerals Engineering 66–68: 112–118. https://doi.org/10.1016/J.MINENG.2014.05.002.
- Mohammadi-Jam, S. and Waters, K.E. (2016). Inverse gas chromatography analysis of minerals: pyrite wettability. Minerals Engineering 96–97: 130–134. https://doi.org/10.1016/J.MINENG.2016.05.007.
- Mou, P., Wa, L., Xiang, D. et al. (2004). A physical process for recycling and reusing waste printed circuit boards. IEEE International Symposium on Electronics and the Environment: 237–242. https://doi.org/10.1109/isee.2004.1299722.
- Namias, J. (2013). The Future of Electronic Waste Recycling in the United States: Obstacles and Domestic Solutions. New York, NY: Columbia University.
- Negari, M.S., Ostad Movahed, S., and Ahmadpour, A. (2018). Separation of polyvinylchloride (PVC), polystyrene (PS) and polyethylene terephthalate (PET) granules using various chemical agents by flotation technique. Separation and Purification Technology 194: 368–376. https://doi.org/10.1016/J.SEPPUR.2017.11.062.
- Nekouei, R.K., Pahlevani, F., Rajarao, R. et al. (2018). Two-step pre-processing enrichment of waste printed circuit boards: mechanical milling and physical separation. Journal of Cleaner Production 184: 1113–1124. https://doi.org/10.1016/J.JCLEPRO.2018.02.250.
- Ning, C., Lin, C.S.K., Hui, D.C.W., and McKay, G. (2017). Waste printed circuit board (PCB) recycling techniques. Topics in Current Chemistry 375 (2): 43.
- Ogunniyi, I.O. and Vermaak, M.K.G. (2009). Investigation of froth flotation for beneficiation of printed circuit board comminution fines. Minerals Engineering 22 (4): 378–385.
- Ogunniyi, I.O., Vermaak, M.K.G., and Groot, D.R. (2009). Chemical composition and liberation characterization of printed circuit board comminution fines for beneficiation investigations. Waste Management (New York, N.Y.) 29 (7): 2140–2146. https://doi.org/10.1016/j.wasman.2009.03.004.
- Olsen, L., & Carnes, B. (2016). Screen capacity calculation. Technical Paper T-JCI-201. https://www.911metallurgist.com/blog/wp-content/uploads/2016/07/Screen-Capacity.pdf (accessed 14 January 2021).
- Oruç, F., Özgen, S., and Sabah, E. (2010). An enhanced-gravity method to recover ultra-fine coal from tailings: Falcon concentrator. Fuel 89 (9): 2433–2437. https://doi.org/10.1016/J.FUEL.2010.04.009.
- Otsuki, A., Pereira Gonçalves, P., and Leroy, E. (2019). Selective milling and elemental assay of printed circuit board particles for their recycling purpose. Metals 9 (8): 899. https://doi.org/10.3390/met9080899.
- Pascoe, R.D. (2005). The use of selective depressants for the separation of ABS and HIPS by froth flotation. Minerals Engineering 18 (2): 233–237. https://doi.org/10.1016/J.MINENG.2004.07.006.
- Phengsaart, T., Ito, M., Hamaya, N. et al. (2018). Improvement of jig efficiency by shape separation, and a novel method to estimate the separation efficiency of metal wires in crushed electronic wastes using bending behavior and entanglement factor. Minerals Engineering 129: 54–62. https://doi.org/10.1016/J.MINENG.2018.09.015.
- Pita, F. and Castilho, A. (2016). Influence of shape and size of the particles on jigging separation of plastics mixture. Waste Management 48: 89–94. https://doi.org/10.1016/J.WASMAN.2015.10.034.
- Pita, F. and Castilho, A. (2017). Separation of plastics by froth flotation. The role of size, shape and density of the particles. Waste Management 60: 91–99. https://doi.org/10.1016/J.WASMAN.2016.07.041.
- Pita, F. and Castilho, A. (2018). Separation of copper from electric cable waste based on mineral processing methods: a case study. Minerals 8 (11): 517. https://doi.org/10.3390/min8110517.
- Pongstabodee, S., Kunachitpimol, N., and Damronglerd, S. (2008). Combination of three-stage sink–float method and selective flotation technique for separation of mixed post-consumer plastic waste. Waste Management 28 (3): 475–483. https://doi.org/10.1016/J.WASMAN.2007.03.005.
- Quan, C., Li, A., and Gao, N. (2012). Study on characteristics of printed circuit board liberation and its crushed products. Waste Management & Research 30 (11): 1178–1186. https://doi.org/10.1177/0734242X12457119.
- Ruan, J., Dong, L., Zheng, J. et al. (2017). Key factors of eddy current separation for recovering aluminum from crushed e-waste. Waste Management 60: 84–90. https://doi.org/10.1016/J.WASMAN.2016.08.018.
- Ruan, J. and Xu, Z. (2011). A new model of repulsive force in eddy current separation for recovering waste toner cartridges. Journal of Hazardous Materials 192 (1): 307–313. https://doi.org/10.1016/J.JHAZMAT.2011.05.025.
- Ruj, B., Pandey, V., Jash, P., and Srivastava, V.K. (2015). Sorting of plastic waste for effective recycling. Journal of Applied Sciences and Engineering Research 4. https://doi.org/10.6088.ijaser.04058 (4): 564–571.
- Saeki, M. (2008). Triboelectric separation of three-component plastic mixture. Particulate Science and Technology 26 (5): 494–506. https://doi.org/10.1080/02726350802367936.
- Saisinchai, S. (2014). Separation of PVC from PET/PVC mixtures using flotation by calcium lignosulfonate depressant. Engineering Journal 18 (1): 45–54. https://doi.org/10.4186/ej.2014.18.1.45.
- Saitoh, K., Nagano, I., and Izumi, S. (1976). New separation technique for waste plastics. Resource Recovery and Conservation 2 (2): 127–145. https://doi.org/10.1016/0304-3967(76)90004-4.
- Salerno, D., Jordão, H., La Marca, F., and Carvalho, M.T. (2018). Using factorial experimental design to evaluate the separation of plastics by froth flotation. Waste Management 73: 62–68. https://doi.org/10.1016/j.wasman.2017.12.001.
- Sarvar, M., Salarirad, M.M., and Shabani, M.A. (2015). Characterization and mechanical separation of metals from computer Printed Circuit Boards (PCBs) based on mineral processing methods. Waste Management 45: 246–257. https://doi.org/10.1016/J.WASMAN.2015.06.020.
- Schubert, G. and Hoberg, H. (1997). Comminution Techniques for the Recycling of Wastes. Littleton, CO: Society for Mining, Metallurgy and Exploration, Inc.
- SCHUTTE Hammer Mill. (2019). E-Scrap Grinding Hammer Mill. https://www.hammermills.com/equipment/e-cycler-series-hammer-mill/#tab-description (accessed 18 March 2021).
- SELFRAG. (2012). Application area | Recycling. http://www.selfrag.com/recycling-examples.php (accessed 18 March 2021).
- Senden, M. M. G. (1980). Performance of zigzag classifiers at low particle concentrations: a study of the effect of stage geometry variations. ASME 1980 National Waste Processing Conference.
- Serranti, S. and Bonifazi, G. (2019). Techniques for separation of plastic wastes. In: Use of Recycled Plastics in Eco-Efficient Concrete (eds. F. Pacheco-Torgal, J. Khatib, F. Colangelo and R. Tuladhar), 9–37. https://doi.org/10.1016/B978-0-08-102676-2.00002-5. Woodhead Publishing.
- Shariati, S., Ramadi, A., and Salsani, A. (2015). Beneficiation of low-grade phosphate deposits by a combination of calcination and shaking tables: Southwest Iran. Minerals 5 (3): 367–379. https://doi.org/10.3390/min5030367.
- Shen, H., Forssberg, E., and Pugh, R.J. (2001). Selective flotation separation of plastics by particle control. Resources, Conservation and Recycling 33 (1): 37–50. https://doi.org/10.1016/S0921-3449(01)00056-8.
- Shen, H., Pugh, R.J., and Forssberg, E. (2002). Floatability, selectivity and flotation separation of plastics by using a surfactant. Colloids and Surfaces A: Physicochemical and Engineering Aspects 196 (1): 63–70. https://doi.org/10.1016/S0927-7757(01)00706-3.
- Shi, F., Krishnan, N., von der Weid, F., van der Wielen, K., Zuo, W., & Manlapig, E. (2014). A potential application of high voltage pulse technology in a gold-copper ore grinding circuit. XXVII International Mineral Processing Congress, 68–77.
- Shibata, J., Matsumoto, S., Yamamoto, H. et al. (1996). Flotation separation of plastics using selective depressants. International Journal of Mineral Processing 48 (3–4): 127–134. https://doi.org/10.1016/S0301-7516(96)00021-X.
- Singh, B.P. (1998). Wetting mechanism in the flotation separation of plastics. Filtration & Separation 35 (6): 525–527. https://doi.org/10.1016/S0015-1882(98)80027-X.
- Smith, Y.R., Nagel, J.R., and Rajamani, R.K. (2019). Eddy current separation for recovery of non-ferrous metallic particles: a comprehensive review. Minerals Engineering 133: 149–159. https://doi.org/10.1016/J.MINENG.2018.12.025.
- Sun, Z.H.I., Xiao, Y., Sietsma, J. et al. (2015). Characterisation of metals in the electronic waste of complex mixtures of end-of-life ICT products for development of cleaner recovery technology. Waste Management 35: 227–235. https://doi.org/10.1016/J.WASMAN.2014.09.021.
- Takoungsakdakun, T. and Pongstabodee, S. (2007). Separation of mixed post-consumer PET–POM–PVC plastic waste using selective flotation. Separation and Purification Technology 54 (2): 248–252. https://doi.org/10.1016/J.SEPPUR.2006.09.011.
- Tripathy, S.K., Banerjee, P.K., and Suresh, N. (2014). Separation analysis of dry high intensity induced roll magnetic separator for concentration of hematite fines. Powder Technology 264: 527–535. https://doi.org/https://doi.org/10.1016/j.powtec.2014.05.065.
- UNTHA Shredding Technology. (2018). Electronic scrap. https://www.untha.com/en/applications/electronic-scrap_a12 (accessed 18 March 2021).
- Wielen, K. Van Der, Weh, A., Giese, H., & Käppeler, J. (2014). High voltage breakage: a review of theory and applications. XXVII International Mineral Processing Congress, 78–87.
- Vega-Garcia, D., Brito-Parada, P.R., and Cilliers, J.J. (2018). Optimising small hydrocyclone design using 3D printing and CFD simulations. Chemical Engineering Journal 350: 653–659. https://doi.org/10.1016/J.CEJ.2018.06.016.
- Veit, H.M., Diehl, T.R., Salami, A.P. et al. (2005). Utilization of magnetic and electrostatic separation in the recycling of printed circuit boards scrap. Waste Management 25 (1): 67–74. https://doi.org/10.1016/J.WASMAN.2004.09.009.
- Veit, H.M., Bernardes, A.M., Ferreira, J.Z. et al. (2006). Recovery of copper from printed circuit boards scraps by mechanical processing and electrometallurgy. Journal of Hazardous Materials 137 (3): 1704–1709. https://doi.org/10.1016/J.JHAZMAT.2006.05.010.
- Veit, H.M., de Juchneski, N.C., F., and Scherer, J. (2014). Use of gravity separation in metals concentration from printed circuit board scraps. Rem: Revista Escola de Minas 67 (1): 73–79. https://doi.org/10.1590/S0370-44672014000100011.
- Ventura, E., Futuro, A., Pinho, S.C. et al. (2018). Physical and thermal processing of waste printed circuit boards aiming for the recovery of gold and copper. Journal of Environmental Management 223: 297–305. https://doi.org/10.1016/J.JENVMAN.2018.06.019.
- Vesilind, P.A. (1980). The Rosin–Rammler particle size distribution. Resource Recovery and Conservation 5 (3): 275–277. https://doi.org/10.1016/0304-3967(80)90007-4.
- Vidyadhar, A., & Das, A. (2012). Kinetics and efficacy of froth flotation for the recovery of metal values from pulverized printed circuit boards. XXVI International Mineral Processing Congress, 236–243.
- Vidyadhar, A. and Das, A. (2013). Enrichment implication of froth flotation kinetics in the separation and recovery of metal values from printed circuit boards. Separation and Purification Technology 118: 305–312. https://doi.org/10.1016/J.SEPPUR.2013.07.027.
- Wang, H., Wang, C., and Fu, J. (2013). Floatability of polymer materials modulated by frothers. Waste Management 33 (12): 2623–2631. https://doi.org/10.1016/j.wasman.2013.09.003.
- Wang, H., Wang, C., Fu, J., and Gu, G. (2014). Flotability and flotation separation of polymer materials modulated by wetting agents. Waste Management 34 (2): 309–315. https://doi.org/10.1016/J.WASMAN.2013.11.007.
- Wen, X., Duan, C., Jiao, H., Zhao, Y., Zhou, X., & Song, S. (2005a). Study on metals recovery from discarded printed circuit boards by physical methods. IEEE International Symposium on Electronics and the Environment, 121–128. https://doi.org/10.1109/isee.2005.1437005
- Wen, X.F., Zhao, Y.M., Pan, Y.J. et al. (2005b). Metals recovery from fine printed circuit boards using falcon SB concentrator. Journal of China University of Mining and Technology 15 (4): 322–328.
- Wills, B.A. and Finch, J.A. (2016a). Crushers. In: Wills’ Mineral Processing Technology, 8e (eds. B.A. Wills and J.A. Finch), 123–146. Butterworth-Heinemann https://doi.org/https://doi.org/10.1016/B978-0-08-097053-0.00006-6.
- Wills, B.A. and Finch, J.A. (2016b). Classification. In: Wills’ Mineral Processing Technology, 199–221. Butterworth-Heinemann https://doi.org/10.1016/B978-0-08-097053-0.00009-1.
- Wills, B.A. and Finch, J.A. (2016c). Magnetic and electrical separation. In: Wills’ Mineral Processing Technology, 381–407. Butterworth-Heinemann https://doi.org/10.1016/B978-0-08-097053-0.00013-3.
- Wills, B.A. and Finch, J.A. (2016d). Sensor-based ore sorting. In: Wills’ Mineral Processing Technology, 409–416. Butterworth-Heinemann https://doi.org/10.1016/B978-0-08-097053-0.00014-5.
- Wu, C., Shi, G., and Yan, C. (2012). Study on wet treatment process of waste printed circuit boards. Advanced Materials Research 518–523: 3621–3626. https://doi.org/10.4028/http://www.scientific.net/AMR.518-523.3621.
- Xia, M.-C., Wang, Y.-P., Peng, T.-J. et al. (2017). Recycling of metals from pretreated waste printed circuit boards effectively in stirred tank reactor by a moderately thermophilic culture. Journal of Bioscience and Bioengineering 123 (6): 714–721. https://doi.org/10.1016/J.JBIOSC.2016.12.017.
- Xiao, C., Allen III L., Biddle, M. B., & Fisher, M. M. (2003). Electrostatic Separation and Recovery of Mixed Plastics.
- Yang, J., Wang, H., Zhang, G. et al. (2019). Recycling organics from non-metallic fraction of waste printed circuit boards by a novel conical surface triboelectric separator. Resources, Conservation and Recycling 146: 264–269. https://doi.org/10.1016/J.RESCONREC.2019.03.008.
- Yenial, Ü., Burat, F., Yüce, A.E. et al. (2013). Separation of PET and PVC by flotation technique without using alkaline treatment. Mineral Processing and Extractive Metallurgy Review 34 (6): 412–421. https://doi.org/10.1080/08827508.2012.702705.
- Yoo, J.-M., Jeong, J., Yoo, K. et al. (2009). Enrichment of the metallic components from waste printed circuit boards by a mechanical separation process using a stamp mill. Waste Management 29 (3): 1132–1137. https://doi.org/10.1016/J.WASMAN.2008.06.035.
- Yue-min, Z., Xue-feng, W., Hong-xia, S. et al. (2006). Study on metals recovery from −0.074 mm printed circuit boards by enhanced gravity separation. Chinese Journal of Process Engineering 6 (2): 201–204.
- Zelmat, M.E.M., Rizouga, M., Tilmatine, A. et al. (2013). Experimental comparative study of different tribocharging devices for triboelectric separation of insulating particles. IEEE Transactions on Industry Applications 49 (3): 1113–1118. https://doi.org/10.1109/TIA.2013.2251991.
- Zhang, G., Wang, H., He, Y. et al. (2017). Triboelectric separation technology for removing inorganics from non-metallic fraction of waste printed circuit boards: influence of size fraction and process optimization. Waste Management 60: 42–49. https://doi.org/10.1016/j.wasman.2016.08.010.
- Zhang, S. and Forssberg, E. (1999). Intelligent liberation and classification of electronic scrap. Powder Technology 105 (1–3): 295–301. https://doi.org/10.1016/S0032-5910(99)00151-5.
- Zhang, S., Forssberg, E., Arvidson, B., and Moss, W. (1998). Aluminum recovery from electronic scrap by High-Force® eddy-current separators. Resources, Conservation and Recycling 23 (4): 225–241. https://doi.org/10.1016/S0921-3449(98)00022-6.
- Zhang, Y., He, Y., Zhang, T. et al. (2018). Application of falcon centrifuge in the recycling of electrode materials from spent lithium ion batteries. Journal of Cleaner Production 202: 736–747. https://doi.org/10.1016/J.JCLEPRO.2018.08.133.
- Zhao, Y., Yang, S., Wen, H. et al. (2019). Adsorption behavior and selectivity mechanism of flotation reagents applied in ternary plastic mixtures. Waste Management 87: 565–576. https://doi.org/10.1016/J.WASMAN.2019.02.044.
- Zhao, Y.M., Duan, C.L., Wu, L.L. et al. (2012). The separation mechanism and application of a tapered diameter separation bed. International journal of Environmental Science and Technology 9 (4): 719–728. https://doi.org/10.1007/s13762-012-0105-z.
- Zhou, C., Pan, Y., Lu, M., and Yang, C. (2016). Liberation characteristics after cryogenic modification and air table separation of discarded printed circuit boards. Journal of Hazardous Materials 311: 203–209. https://doi.org/10.1016/J.JHAZMAT.2016.03.008.
- Zhou, X., Wang, X., Zhang, X., and Luo, X. (2012). The efficiency change of spiral classifier with different overflow discharge methods. Advanced Materials Research 412: 412–453. https://doi.org/10.4028/http://www.scientific.net/AMR.412.453.
- Zhu, X., Nie, C., Wang, S. et al. (2020). Cleaner approach to the recycling of metals in waste printed circuit boards by magnetic and gravity separation. Journal of Cleaner Production 248: 119235. https://doi.org/10.1016/J.JCLEPRO.2019.119235.
- Zhu, X., Nie, C., Zhang, H. et al. (2019). Recovery of metals in waste printed circuit boards by flotation technology with soap collector prepared by waste oil through saponification. Waste Management 89: 21–26. https://doi.org/10.1016/J.WASMAN.2019.03.061.