
Catalysts for Energy Management
Abstract
From the earliest days of human existence, energy has been critical for survival. Following the industrial revolution, great strides were made in expanding available supplies of energy and introducing many labor-saving or life-enhancing technological innovations that depended on the new sources of energy. The expanding use of energy, coupled with a growing global population, raises the twin concerns of resource depletion and environmental degradation. Governments increasingly turn to regulations to deal with these two concerns. There are compelling reasons why energy management and efficiency should be encouraged on a global scale.
Keywords
Energy availability; world energy resources; global energy use; regulations; drivers; benefits; nonenergy benefits
Introduction
The supply constraints resulting from the oil embargos of the 1970s were a significant catalyst for new energy policies and programs aimed at improving energy management worldwide. There were widespread efforts to reduce wasteful energy use and to develop energy efficient technologies, processes, and improved methods of supplying and managing energy. The efforts yielded substantial technology advancements and programmatic advances, effectively reducing the energy intensity of equipment and processes and slowing the global per capita rate of increase in annual energy use. These improvements continued to have momentum into the 1980s. However, in the 1990s, energy management improvements slowed for various reasons, perhaps due in part to a degree of complacency setting in. The energy management policy and programs simply were not as effective as their predecessors. In the 2000s, new (and renewed) concerns started to take hold again.1 Today, these concerns are still at the forefront of the energy industry’s collective consciousness. They contribute to a need, perhaps even an urgency, for better energy management as a means to effectively deal with future shortfalls in supply, rising costs, and the specter of global warming.
As in the 1970s and ’80s the drivers revolve around the increasing worldwide demand for energy and uncertainty in the availability of energy resources to supply that demand. This time around they include greater concerns over adverse environmental impacts, in particular, greenhouse gas emissions. Of course, the costs and regulatory implications associated with energy availability and environmental impacts also constitute important drivers. In this chapter, we describe these key drivers for energy management programs and discuss the many ways energy management improvements benefit end-users, energy companies, nations, and society in general.
Growing Demand for Energy2
What has recent history shown us? Overall, some remarkable changes have occurred in the 35 years since publication of the first edition of Energy Management Principles. At that time in 1980, the world was still recovering from the second oil shock, when the Shah of Iran was overthrown in 1979 and Iran cut oil production. Meanwhile, oil production in the U.S. had plateaued and was headed downward, making the country a net importer of oil. Today, 35 years later, the U.S. is a net exporter of oil, proven world reserves have increased by 60% in the last two decades, but unrest in the Middle East first pushed the price of oil to US$100 per barrel, only to have it plunge to US$50 per barrel as OPEC attempted to force other producers out of the market.
In 1980, there were dire concerns about natural gas shortages; those fears dissipated with new finds and a 50% increase in proven reserves between 1993 and 2013, despite the fact that consumption increased by nearly 30% over the same period. By 2013, the price per GJ (MBtu) of natural gas had dropped to about one-fifth that of oil.
During the same period, the price of coal see-sawed as environmental concerns and the recession impacted European and U.S. demand. In the Asia-Pacific region, production and consumption of coal doubled in the 10-year period 2003–2013, while North American consumption declined by 20%. China today accounts for 50% of global coal consumption and has a 4% annual growth rate.
Nuclear power, once considered an “inexhaustible energy resource” has fallen out of favor due to public concerns over safety and radioactive waste management. The Chernobyl disaster in 1986 and the Three-Mile Island accident both resulted from a loss of cooling, causing fuel meltdown and release of radioactive fission products. The consequences were quite different, however. In Chernobyl, the reactor lacked the containment building that is mandatory in modern Western nuclear plants. Consequently radioactivity was spread over broad area, causing the evacuation of residents and closing an area within a 20 mile radius of the plant. This area is still closed and the residents have not returned.
At the Three-Mile Island accident in 1979, the containment building kept radioactivity from escaping and the impact of the accident outside of the plant boundary was negligible. As a precautionary measure, residents living within a 20 mile radius of the plant were evacuated. They returned to their former homes within 3 weeks.
The 2011 Tōhoku earthquake and tsunami, the largest ever recorded to hit Japan, caused a meltdown in three reactors at the Fukushima nuclear power plant. The area within a 12 mile radius of the plant was evacuated. There have been no reported radiation deaths. The tsunami resulted in about 18,500 people dead or missing, most by drowning. This toll is far greater than the known deaths from radiation due to Three-Mile Island, Chernobyl, and Fukushima combined.
The World Health Organization, in a 2005 statement titled Chernobyl: The True Scale of the Accident, reported that a team of 100 experts in the field estimated that up to 4000 people might ultimately die as a result of radiation exposure from the Chernobyl incident. While radiation spread over broad area of Europe, the resulting levels were quite low in most places. Initial studies indicate that long-term exposure in Japan will be far less than experienced at Chernobyl, and radiation-induced deaths will be difficult to detect from those due to other causes.
There are great misconceptions regarding radioactive waste management, the first being that spent fuel “must be safeguarded for millions of years.” One hundred years is closer to the truth. Also, while the U.S. has spent billions in developing storage facilities that are still not accepted for use, France successfully manages its radioactive waste with little fanfare in a densely populated country slightly smaller in area than California and Nevada combined. France operates 58 nuclear power plants and generates 75% of its electricity from nuclear energy.
As a consequence of public perceptions of radiation risk, worldwide production of nuclear power peaked in 2010 and has been declining since then, except in the case of China and India. After Fukushima, some countries decided to close their nuclear power plants or not build new ones.
Hydropower increased by 40% in the decade 2003–2013, with one-half of the new hydro capacity originating in China. The supply of other renewable energy forms (solar, wind, geothermal, and biomass) increased over 400% in the decade, but still amounts to only 2% of total global energy usage, as shown in Table 2.1.3 Summing up, primary world energy usage remains dominated by fossil fuels.
Table 2.1
World primary energy use, by source, 2013
| Fuel | Million tonnes oil equivalent (106 TOE) | 109 GJ | Share of primary energy use (%) |
| Oil | 4,185 | 188 | 33 |
| Natural gas | 3,020 | 136 | 24 |
| Coal | 3,827 | 172 | 30 |
| Nuclear | 563 | 25 | 4 |
| Hydro | 856 | 38 | 7 |
| Renewables | 279 | 13 | 2 |
| Total | 12,730 | 572 | 100 |
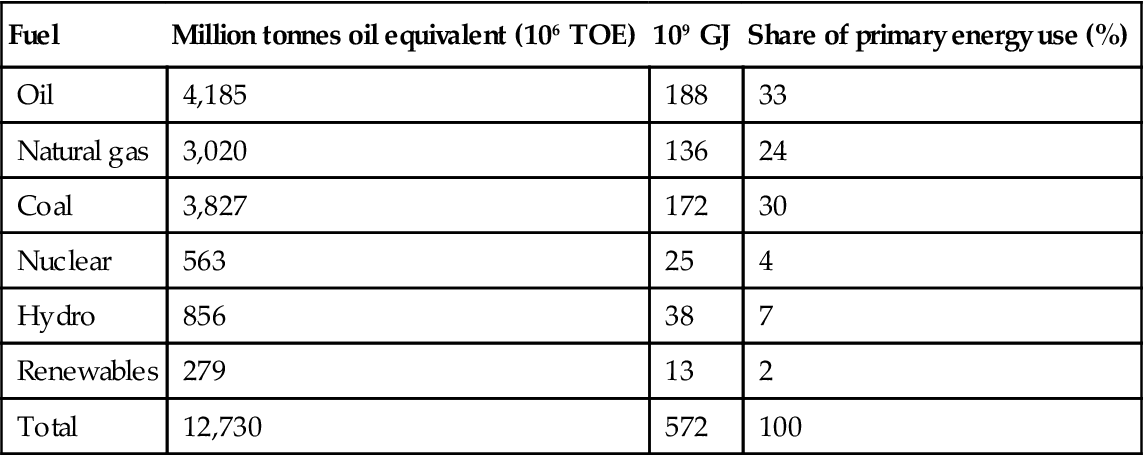
Source: BP Report.2
Total global energy use in 1975 was 200×109 GJ versus an estimated 572×109 GJ in 2013, an increase of 286%.4
Electricity is an energy form of growing importance worldwide. Table 2.2 shows growth trends for electricity. We note that an increasing share of energy use takes place in the form of electricity. The electricity growth rate is greater than other energy forms, but slowed considerably following the 2008 global recession.
Table 2.2
Approximate world electricity production
| Year | U.S. | Rest of world | Total in 106 MWh | Total in 109 GJ |
| 1961 | 878 | 1,575 | 2,453 | 8.8 |
| 1963 | 1,011 | 1,838 | 2,849 | 10.3 |
| 1965 | 1,157 | 2,183 | 3,340 | 12.0 |
| 1970 | 1,638 | 3,263 | 4,901 | 17.6 |
| 1973 | 1,947 | 4,095 | 6,042 | 21.8 |
| 1975 | 2,003 | 4,436 | 6,439 | 23.2 |
| Average annual % increase | 6.0% | 7.7% | 7.1% | |
| 2008 | 4,119 | 15,042 | 19,161 | 69.0 |
| 2009 | 3,950 | 15,112 | 19,062 | 68.6 |
| 2010 | 4,125 | 16,129 | 20,254 | 72.9 |
| 2011 | 4,100 | 16,980 | 21,080 | 75.9 |
| Average annual % increase | 0% | 3.2% | 2.5% | |
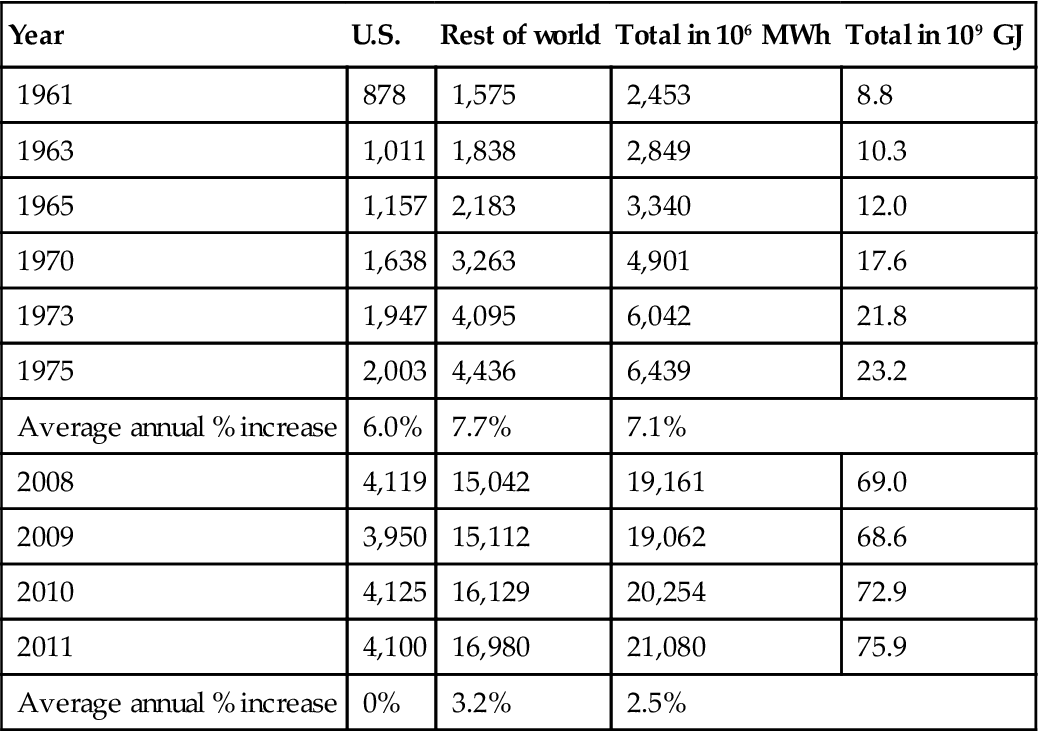
Sources: For years 1961-75, Smith, Craig B. (1981), Energy Management Principles 1st ed., p. 17; for years 2008–2011, U.S. Energy Information Administration, “International Energy Statistics,” can be found at: http://www.eia.gov/cfapps/ipdbproject/IEDIndex3.cfmhttp://www.eia.gov/cfapps/ipdbproject/IEDIndex3.cfm.
Historically, electricity production has grown about 28% faster (365% overall vs 286%) compared to all other energy forms during the four decades from 1975 to 2013. In the U.S., nearly 40% of all energy consumed is used to generate electricity. Of this total, nearly two-thirds is generated from coal and natural gas, with one-third coming from nuclear generation, hydropower, wind, solar, and biomass (2013 data). The big change here is the decline in coal and oil consumption, offset by an increase in natural gas and wind generation. In the case of coal and natural gas, it requires anywhere from 2.5 to 3.3 units of fuel to produce one unit of energy ultimately delivered as electricity. Consequently, the efficient use of electricity by end-users has a multiplied effect on savings for the national economy and a corresponding reduction in power plant atmospheric emissions.
Electricity is used in a variety of ways: for space conditioning, lighting, motive power, refrigeration, process heat, and for electrolysis. Chapters 8 and 9 describe applications of electricity to HVAC and lighting. Electricity use in transportation and industrial processes is discussed in Chapters 10 and 11.
The rapid increase in electricity production is due to the popularity of this energy form, which is preferred because of its flexibility, ease of transmission and control, and versatility of fuels that can be used to produce it. In the last several decades, myriad new applications have emerged for electricity, including now ubiquitous personal computers and related equipment, portable electronic devices, electric vehicles, and a long list of electric appliances, from ultrasonic toothbrushes to heat pump water heaters. In addition, there has been a surprising and unplanned increase in “vampire” electricity usage, all those glowing neon or LED indicator lights from cell phone chargers, cable TV boxes and dozens of other low power devices that operate 24 h/day, 7 days/week.
Energy Use by Sector
Roughly 2/3 of all energy use occurs in industrial and transportation sectors. The balance is used in the residential and commercial sectors, with a small portion committed to nonenergy uses, such as feedstocks for industrial processes (see Table 2.3).
Table 2.3
Energy use by sector, 2011 (109 GJ/year)
| Area | Industry | Transport | Residential | Commercial | Total |
| World | 281 | 109 | 97 | 65 | 552 |
| 50.9% | 19.7% | 17.6% | 11.9% | 100% | |
| U.S. | 32.3 | 28.6 | 22.8 | 19.0 | 102.7 |
| 31.4% | 27.9% | 22.2% | 18.5% | 100% |
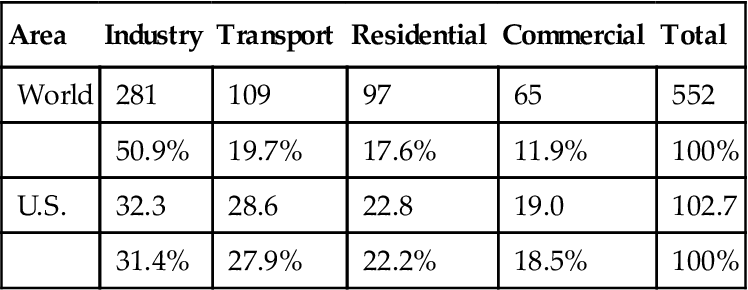
U.S. Data: U.S. Energy Information Administration/Annual Energy Review 2011, DOE/EIA-0384 (2011) September 2012.
Sources: World Data: U.S. Energy Information Administration, “International Energy Outlook 2013.”
Supply Constraints
History has shown that it is the availability of accessible and affordable energy that is critical for communities to flourish. Civilizations have risen and fallen for a multiplicity of causes, but energy availability may be surmised to be one of the major reasons.
During millions of years of human evolution, from the Stone Age to the industrial revolution, humankind depended primarily on solar energy for direct heat, food, and fuel. Civilizations flourished first where the availability of natural resources, water, fertile land, and food made it convenient, and later where the geography provided security and access to trade. When agricultural productivity decreased, or when the forests were stripped, the community moved on to another location or declined. Changing climatic condition caused human and other life forms to migrate, and often created deserts in its wake.
With the development of trade, transportation, and the first crude pumps and engines, establishment of permanent cities became feasible. Now, instead of being susceptible to climate changes and depending only on energy and food resources of the immediate vicinity, these necessities could be brought in from afar, creating a much broader resource base to support the community. This was accompanied by the discovery of cheap, transportable, and readily available fossil fuels, which made a dramatic difference in human energy use and is linked to the origins of the Industrial Revolution.
Today’s industrialized communities rely heavily on both domestic and foreign energy supplies, food, and other goods to thrive. We are accustomed to having exotic tropical fruits airlifted one-fourth of the way across the earth from Hawaii to brighten the breakfast of New Yorkers. We also expect the lights to turn on when we flip a switch and we expect to be able to purchase gasoline any day of the week.
Many of us take energy availability for granted. However, the energy resources we have come to depend on, both locally and internationally, are most certainly limited. Examples of these very real supply constraints range from the 1973 oil embargo when gasoline purchases were restricted, to the rolling electricity blackouts in California during the early 2000s when homes and businesses experienced disruptions to their electricity supply. Ensuring that we have access to energy when we need it is an important driver for energy management activities at the facility and community level.
World Fossil Fuel Resources
There are literally hundreds of books dealing with various estimates of world energy resources. Debate surges back and forth, with pessimists concluding that fossil fuels are nearly exhausted and optimists arguing that there are undiscovered resources many times greater than the amounts that have been used to date. The one point about which there has been some agreement is that fossil fuel resources are finite and sometime in the next century or so will be exhausted to the point where further uses as fuels is uneconomic.
This point was made convincingly by Hubbert in a classic study in which he calculated an upper limit on fossil fuel formation using various methods for estimating the maximum possible extent of coal, oil, and natural gas resources.5 Combining this with historical rates of extraction, he formulated graphs such as those shown in Figure 2.1. Hubbert’s work provided a useful technique for estimating a lifetime of remaining fossil fuels, even though his numbers are no longer current.
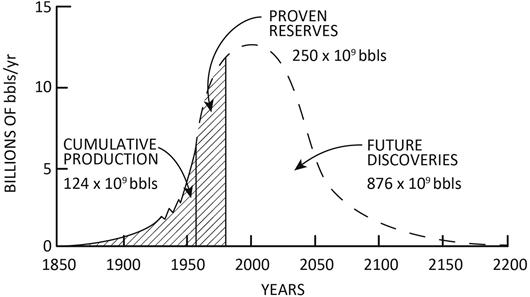
In reality, it is unlikely that fossil fuel resources will ever be exhausted. Instead, the cost of extracting or recovering resources having increasingly dilute concentrations will become prohibitive to the point where they will no longer be economical fuels.
McKelvey states:
The era of abundant, low-cost fossil fuels which has supported large increases in world population and material wealth over the past two centuries is approaching an end as exponential growth and demand proceeds to deplete remaining readily recoverable resources.6
Table 2.4 summarizes a current estimate of proven reserves of fossil fuels prepared by British Petroleum.7 Coal accounts for approximately 52% of proven reserves, followed by oil at 29% and natural gas at 19%.
Table 2.4
Estimated proven reserves of fossil fuels
| Fuel | Quantity | Unit | Approximate energy content (109 GJ) | Share of proven reserves (%) |
| Oil | 1,688 | 109 bbl | 10,339 | 29 |
| Natural gas | 6,558 | 1012 cubic feet | 6,925 | 19 |
| Coal | 891,531 | 106 metric ton | 18,529 | 52 |
| Total | 35,793 | 100 | ||
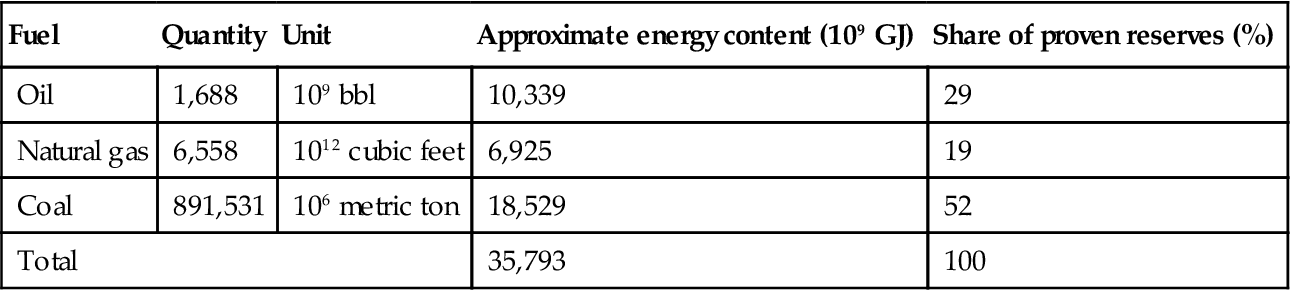
Source: BP Report.2
Table 2.1 showed that fossil fuel resources currently supply more than 85% of the worldwide demand, which was 572×109 GJ/year in 2013. Based on this recent level of world energy use, the estimated proven reserves in Table 2.4 constitute a pool that could last for slightly more than 60 years. However, energy use in much of the world has been increasing at an annual rate of 2–4% due to population growth and greater industrialization. If this rate of increase continues, all fossil fuel resources would be exhausted sometime in the next century. That is, assuming fossil fuel energy use increases at the current rate of growth, the current estimates of proven oil and natural gas reserves will last fifty-plus years, and coal, over 100 years.
Another significant issue with fossil fuel resources is where they are located. Petroleum and natural gas have high concentrations in the Middle East and Eastern Europe. Political instability is a great concern for countries that rely on imports, both from an economic and national security perspective.
There are also several unknowns to consider with respect to fossil fuel reserves. The first is, “What is the magnitude of the unproven fossil fuel resources?” Past history has shown that exploration continues to yield new gas and oil fields, albeit with greater recovery costs. Technological advances also can increase reserves. In Hubbert’s analysis, cited above, he postulated future oil discoveries would be 3.5 times as great as the proven reserves known at that time. The U.S. Energy Information Administration estimated in 2009 that U.S. unproven resources of oil and natural gas are 7–9 times greater than proven reserves.8 If those numbers are typical for global sources, fossil fuels would hypothetically last for several centuries. Of course this would only apply if the cost of recovery was within an economic range.
The next unknown is exponential growth. Herein lies another argument. How much more growth can be tolerated? Zero growth is intolerable, since this would imply no increase for the developing nations, or at best an increase at the expense of the industrial nations. Certainly a slowing of growth rate in the developed nations is possible, accompanied by the inevitable increases in energy use that must occur in the rest of the world. Still, it is difficult to imagine that this will not lead to an increased demand for energy over the next 25–50 years. To deny this is to deny the irresistible forces of liberty and nationalism which are in motion in the world today. So, growth rates in energy use are likely to increase.
The final, and perhaps most critical unknown, is “What will be the effect of dumping additional megatons of CO2 from combustion into the atmosphere?” This debate is beyond the scope of this book. Suffice it to say that we believe this extremely serious problem is not receiving sufficient attention by governments worldwide. It is this concern that drives our dedication to the efficient use of energy as one mitigating measure that the entire world can accept.
Other Energy Resources
There are three other major classes of energy resources in addition to fossil fuels:
• Nuclear fuels (uranium and thorium).
• Unconventional hydrocarbon fuels (tar sands, shale oil, gas entrapped in sandstone and shale, and geopressurized zones).
• Alternate energy sources, which include hydropower, solar energy, wind power, biofuels, geothermal energy, and ocean energy.
Scientists estimate worldwide nuclear fuel reserves, if used in conventional light water reactors, potentially have an energy content of the same order of magnitude as oil and gas reserves. Thus nuclear energy use in conventional reactors does not change the global picture greatly, although it could be an important economic modifier for certain countries if widely substituted for imported oil. Another potential advantage of nuclear energy is the beneficial aspect of eliminating CO2 released to the atmosphere as the result of combustion. However, as described previously, ongoing public concerns about nuclear power plant safety and radioactive waste management are significant barriers to more widespread use of conventional nuclear power.
Nuclear energy becomes potentially even more significant if the technical and social issues surrounding the use of alternative forms of nuclear energy are solved. For one, if breeder reactors were to become available, the future energy supply horizon would be extended perhaps another 500 years, even with increased rates of energy use. However, the practicality of this option is still in question and public concern over diversion of nuclear fuels for use as terrorist weapons is a formidable barrier. Another alternative form—fusion energy—despite years of research and huge investments, so far remains a feasible source only on the sun and, of course, in nuclear weapons.
Large amounts of energy are potentially available in the unconventional hydrocarbon resources. Early efforts to develop economical production did not meet with much success. However with the increased price of oil, renewed efforts at extracting shale oil and recovering oil and gas from depleted reserves have shown success. Remarkably, in a few short years, the U.S. has gone from being a net importer of oil to a net exporter, in part driven by hydraulic fracturing of shale (“fracking”) and other methods of resource recovery. Hydrogen may also prove to be an energy resource in the future, but producing, transporting, and storing it currently present significant economic, safety, and technical challenges.
Alternative energy sources such as hydropower and renewable resources were essential in the past and will be important in the future. Hydropower, in particular, accounts for a considerable share of worldwide energy use (7% in 2013), albeit this share is still small compared with fossil fuel use. Renewables such as solar, wind power, ocean energy, biofuels, and geothermal energy represent a small but growing share of energy use (collectively 2% in 2013).
As noted previously, solar energy has historically been the major human energy source. Huge amounts of it reach the earth; roughly 10 times the fossil resources shown in Table 2.4, or 3000×1012 GJ, are incident every year on the land and sea. Much of this is reradiated and therefore is unavailable for human use. Some is captured in the form of wind and wave power, and about 0.1% is stored annually by the biosphere. Renewables will be an important future source in any event; however, it will be of greatest interest if economical means can be developed to use solar and other alternate energy forms as substitutes for fossil fuels. This is technically and economically much more difficult to accomplish. Indeed, it is true, as McKelvey stated, that while solar energy may be free, it isn’t cheap.9 Nevertheless, there has been progress in replacing energy use for space heating, water heating, and low-temperature process heat with solar thermal systems. Solar photovoltaic systems for generating electricity have shown steady increase in efficiency and in cost reduction. Wind power installations have expanded around the world. Still, the applications have been limited, and the equipment relatively expensive.
The finite supplies of conventional fuels and the technical and economic challenges of alternative energy sources make supply constraints a significant driver for energy management.
Environmental Impacts
The environment is directly and indirectly affected by energy production and use. The impacts are too numerous to mention here, but examples include the following:
• Extraction of coal in mines causes a variety of health effects in miners, including pneumoconiosis (black lung).
• Oil spills from tankers damage marine and coastal environments.
• Release of sulfur dioxide and nitrogen oxides into the atmosphere from power plants causes acid rain, which is harmful to forests and pollutes streams and lakes.
• Greenhouse gas emissions from fossil fuel combustion are linked to climate change.
• Hydropower dams and turbines have negative impacts on wildlife.
• Severe damage to nuclear power plants can lead to radioactive contamination.
These few examples show that most, if not all, of the energy resources we depend on have environmental hazards, with some more destructive than others. Because of the relatively large share of fossil fuels feeding our energy supply today, combustion of fossil fuels is responsible for the most deleterious environmental effects. Mitigating these impacts by reducing demand for fossil fuels and seeking advancements in more environmentally sensitive alternative energy forms is therefore another important driver for energy management. This driver may originate from an individual concerned with protecting the environment, or from a corporate or government policy.
Policy and Regulatory Matters
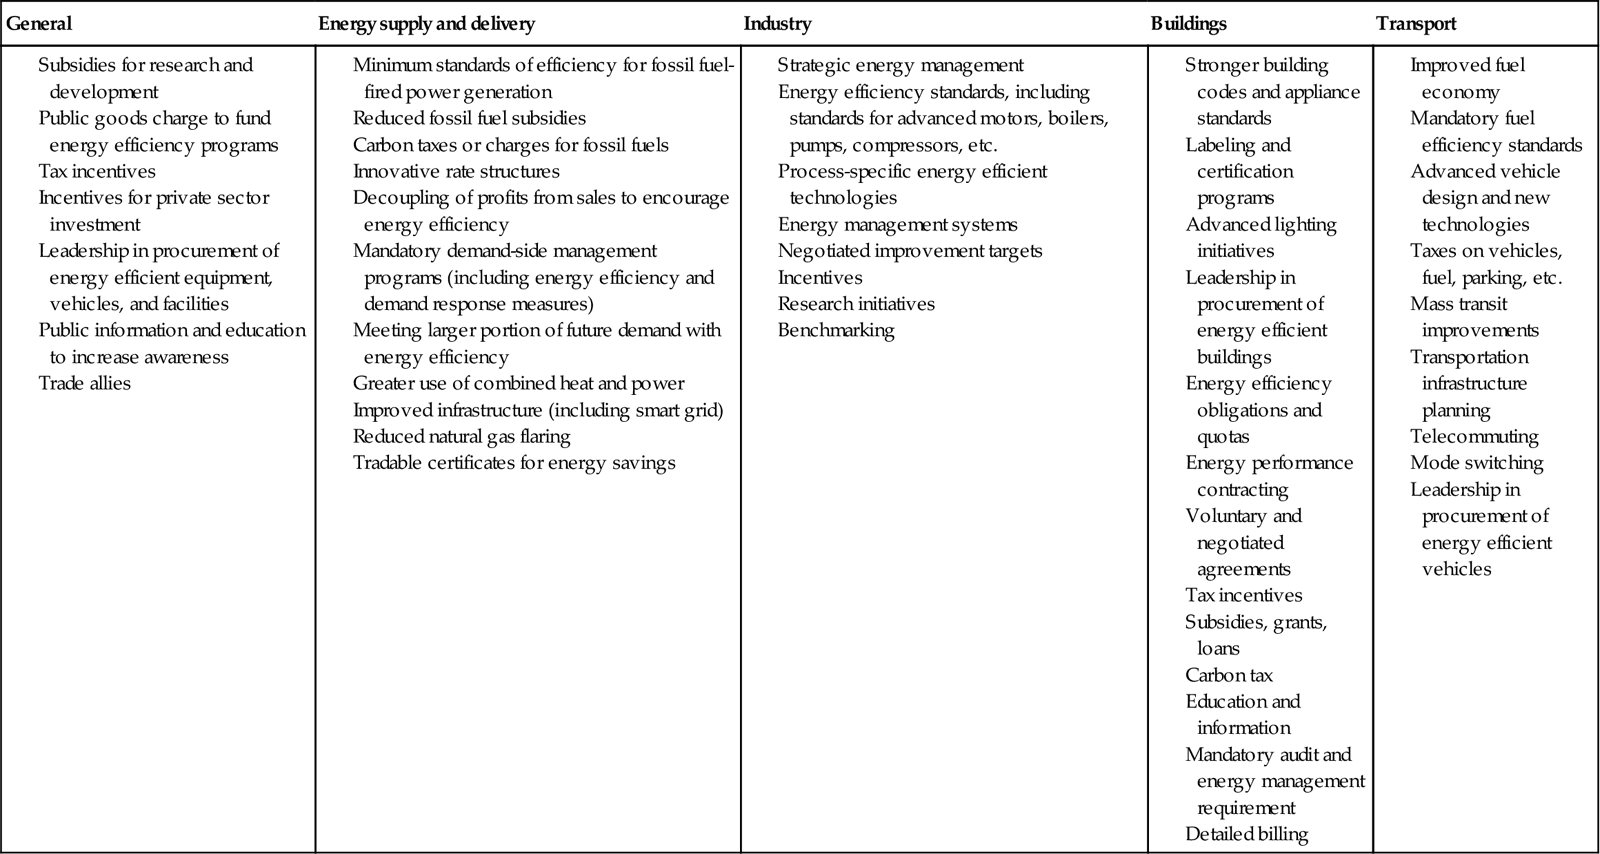
Numerous government and corporate actions are underway worldwide to affect patterns of energy use. Policies and programs exist at the international, national, state, local, and corporate levels, with leadership from government organizations, energy companies, regional coalitions, and heads of corporations. These actions address energy management improvements to the economy as a whole as well as in individual economic sectors, including energy supply and delivery, industry, residential and commercial buildings, and transportation. Table 2.5 lists examples of some of the types of policy and program instruments that have proven successful in improving energy management.10
Table 2.5
Examples of policies and programs for energy management
1. Realizing the Potential of Energy Efficiency, Targets, Policies, and Measures for G8 Countries, United Nations Foundation, Washington, DC: 2007.
2. Climate Change 2007: Mitigation, Contribution of Working Group III to the Fourth Assessment Report of the Intergovernmental Panel on Climate Change, B. Metz, O. R. Davidson, P. R. Bosch, R. Dave, L. A. Meyer (eds), Cambridge University Press, Cambridge, United Kingdom and New York, NY, U.S.: 2007.
3. Energy Use in the New Millennium: Trends in IEA Countries, International Energy Agency, Paris, France: 2007.
The move toward a strong energy efficiency push on the part of public utility commissions and other regulatory agencies represents a radical departure from the preoil embargo days. Utilities have a definite need for energy management technology that will enable them to serve their customers, providing both power and information concerning its efficient use. The end-user needs to have critical energy requirements met without interruption at a reasonable cost. Today, utility load growth does not lead to lower costs.
Carbon Policy
Worldwide there are many new regulations, policies, and actions aimed at reducing greenhouse gas emissions from fossil fuel combustion and other factors that contribute to global warming. Some countries are further along than others, with the U.S. relatively slow to adopt policies. In the Copenhagen Accord of the United Nations Framework Convention on Climate Change in December of 2011, the Obama administration put forward a target to lower greenhouse gas emissions in the U.S. to 2005 levels by 2020.11 The U.S. EPA has also begun to establish a framework under the Clean Air Act for regulating greenhouse gas emissions that includes rules requiring the largest industrial emitters to submit annual greenhouse gas emissions data and mandates that all sources emitting greenhouse gases above a certain threshold obtain permits.12 Most recently, on August 3, 2015 the Obama administration and U.S. EPA announced finalization of the Clean Power Plan, which is a rule to reduce carbon emissions from power plants.
However, several state carbon polices are ahead of federal regulations. For example, California is implementing a cap-and-trade program to ensure the state achieves its target of reducing emission levels to 1990 values by 2020. The entities covered in the cap-and-trade program consist of power plants, transportation fuels, refineries, cement manufacturing plants, and large industrial combustion sources.13 Cap-and-trade programs and the use of allowances and carbon offsets as compliance instruments are an innovative and somewhat controversial policy to reduce greenhouse gas emissions.
In addition to government policies, interesting incentive programs have emerged for carbon reductions; an example is contributing money for reforestation to offset air passenger miles. Corporate carbon policies are also on the rise, (i) because corporations want to improve public image and (ii) as a result of pressure from customers and shareholders. Indeed, numerous companies have been asked by shareholders to adopt emission reduction targets, to publish sustainability reports, or to tie executive compensation to sustainability goals.14
Energy Costs
The issues associated with all of the drivers discussed so far have implications on energy costs. Growing worldwide demand for energy amidst constraints in the availability of low-cost energy resources pushes energy costs upwards, particularly in locations with limited supplies. Even in areas where fuels and electricity are inexpensive, it is apparent that the efficient and judicious use of resources will benefit the user, his or her nation, and humankind in general. It also benefits energy companies, since better energy management delays capital expenditures for new power plants and associated infrastructure.
Saving money on energy use is usually the principal driver for end-users to pursue energy management actions. It is also one of the main benefits that users derive from energy management programs. Increases in energy prices affect household budgets, operating costs in commercial and industrial facilities, and ultimately the cost of manufactured goods, transportation, essential human services, and agriculture. For residential customers, lower energy costs mean more disposable income. For industrial and commercial users, energy management can mean cost savings, better utilization of existing capital equipment, or plant expansion (by using existing equipment more efficiently) without new capital expenditures (Text Box 2.1).
For energy utilities, properly conducted energy management programs can postpone the addition of new generating capacity at a time when sites are scarce, capital costs are high, and permitting is challenging, both from societal and environmental perspectives. Energy management is a highly cost-effective energy resource that is yet to be fully tapped.
Benefits of Energy Management
There is an inextricable link between the drivers of energy management and its benefits. It is impossible to have a discussion of one without the other. Energy management has widespread benefits to end-users, energy companies, nations, and society at large, many of which tie directly back to some of the key drivers—growing energy use and supply constraints, environmental impacts, and policies and regulations—and the increasing energy costs accompanying these issues. Invoking energy management actions and programs can address and mitigate these driving forces while delivering a wide variety of additional benefits, including nonenergy benefits.
Nonenergy Benefits
Also referred to as nonenergy impacts, ancillary benefits, co-benefits, and benefits “beyond the meter,” nonenergy benefits represent an important but often overlooked value proposition of energy management programs. These benefits vary depending on the beneficiary, whether it be the end-user (residential, commercial, or industrial), utilities, or society in general (see Table 2.6 for specific examples).15
Table 2.6
Nonenergy benefits of energy management programs
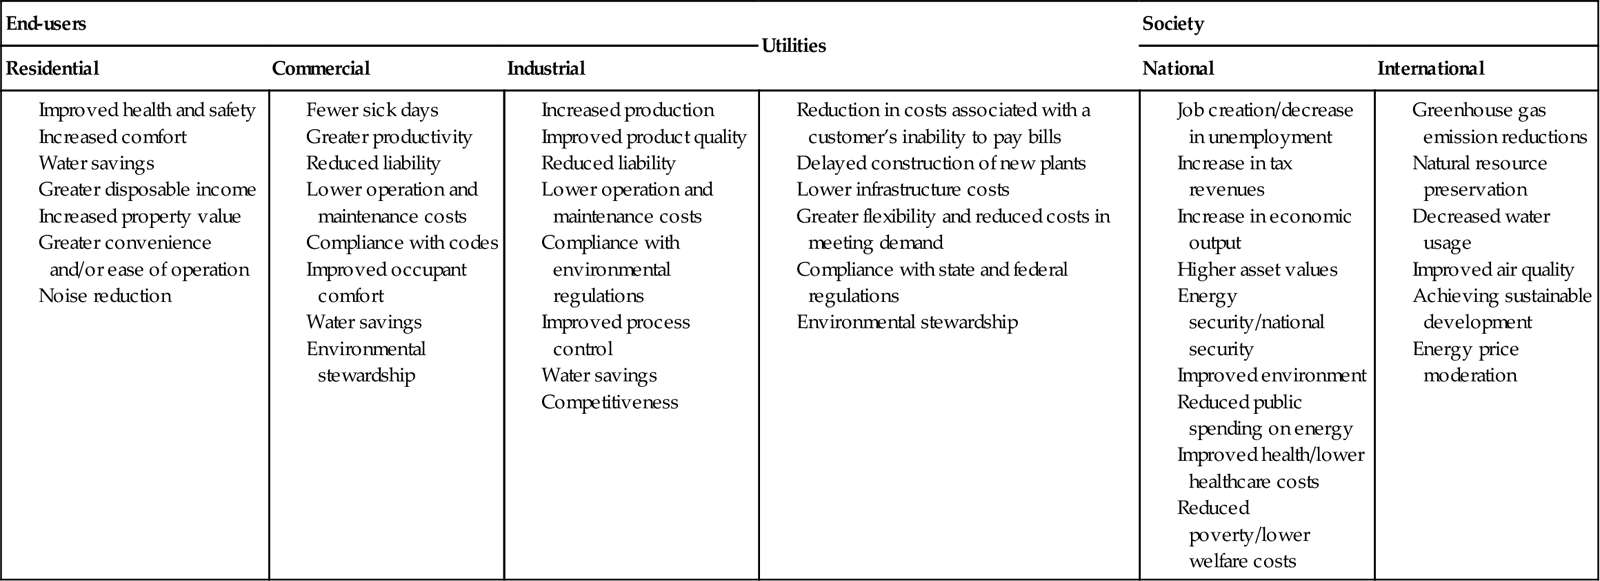
Residential users potentially realize benefits ranging from improved comfort (better weatherization reduces drafts and keeps interior environments at comfortable temperature) to increased property value (energy efficient improvements can equate to lower operating costs and better resale value). Commercial users may experience fewer sick days and greater productivity (improving lighting levels, temperature and humidity, and air quality lead to a healthier working environment) and lower operation and maintenance costs (some efficient technologies such as LED lighting last longer and require less maintenance). Energy management in industry can result in improved product quality (better tasting food, enhanced material properties), competitiveness (superior products for lower costs), and water savings (repairing steam leaks eliminates wasted water).
Utilities benefit from a reduction in billing costs related to collecting from customers who cannot afford to pay high energy bills, greater flexibility and reduced costs in meeting demand, and compliance with state and federal regulations. An effective energy management program is an important element in regulatory acceptance of utility forecasts, rate requests, and permit applications for new generating capacity. In the words of one utility executive, “an unexpected value of our energy management programs has been the improvement in our credibility that has resulted.”
Societal benefits range from socioeconomic to environmental to national security. For example, improved health and safety lowers healthcare costs; reduced poverty decreases welfare costs; and reduced greenhouse gas emissions that result from more efficient use of fossil fuels has huge implications for human welfare.
A Look Back
When the first edition of this book was published in 1980, world energy use had grown at an average annual rate of 4.4% during the period from 1961 to 1975. During the same time period, energy use in the U.S. had grown at an average annual rate of 3.3%, reaching 75.1×10⁹ GJ (71.2 quads) in 1975. Projections at that time foresaw energy use in the U.S. reaching 106×109 GJ (100 quads) by 1992; instead, it only reached 90×109 GJ (85 quads). The elusive mark of 106×109 GJ was reached in 2004 and again in 2005, but by 2013 energy use had dropped back to 103×109 GJ (97.8 quads).
Over the last two decades, 1995–2013, primary energy use in the U.S. increased from 96.0×10⁹ GJ (91.0 quads) to 103×109 GJ (97.8 quads), or by a total of 7%. Meanwhile, Gross Domestic Product (GDP) grew from US$10.16×10¹² to US$15.76×10¹², an increase of 55% during the same period. (Dollar values are “chained” to 2009.) What this signifies is that the input of energy per dollar of GDP declined by over 30% between 1995 and 2013. Some of this is no doubt due to the changing industry base in the U.S., but overall it represents a truly remarkable transition in energy efficiency.
What if this hadn’t happened? First, the energy component of the cost of goods would be 30% higher, affecting consumer spending and international competitiveness. Second, had a 3% annual growth rate of total energy use continued, the U.S. alone now would be using over 200×109 GJ (189 quads) of energy per year, a crippling amount from an economic and environmental perspective.16 During these years, the number of residential and commercial energy consumers has grown, as has the various ways they use energy. We are indeed fortunate that remarkable improvements in the energy efficiency of refrigerators, air conditioning units, lighting systems and other devices have offset the growth in demand. Besides huge economic savings to consumers, greater end use efficiency has meant less combustion, less greenhouse gases, and less environmental pollution. The era of energy management is a huge success story for humankind.
Conclusions
There are compelling reasons for efficient use of energy on a global scale. Besides the economic incentive (which in most countries is a sufficient cause in itself) the global resource picture is clouded. Readily available and low-cost fossil fuels that had been the mainstay of the past century are becoming increasingly costly and scarce. The processes required for mining, processing, transporting, and using these fuels will be subject to increasing environmental concerns as global usage doubles and then at least doubles again and possibly again in the future.
Nor can we expect major miracles in the form of new fuel sources. Experience has shown that new oil finds, such as those in the North Sea, Alaska, and West Africa, are not magical solutions to the problem. Instead, they are part of the fulfillment of the prophecy of “undiscovered recoverable reserves.” In fact, we must expect new major finds of this type every year or the global situation will be worse than described above.
Energy management, in addition to having important short-term economic benefits, buys time for the future. It provides time to make a transition to readily available fuels. It eases the transition to alternate fuels. Finally, it is the only near-term (2–5 years) way to get more “mileage” from existing fuels and energy sources. This is much quicker than the time needed to bring new wells and mines into production or the time required to build new power plants. Energy management also has many nonenergy benefits that are all too often overlooked when valuing energy management proposals.