
Management of Process Energy
Abstract
Industrial processes used for manufacturing, food production, pharmaceuticals, vehicles, and many other products have improved the standard of living. Industrial processes include diverse uses of energy, ranging from simple heating to the complex operations required to form, shape, and join materials. Great improvements in industrial energy use efficiency have been made in the last three decades. Specific energy use—i.e., the energy required to produce a unit of any industrial product—has declined in every sector. With rising energy costs that means more goods can be produced with less energy expense. More significant, it also means that less CO2 is produced per unit of production. There are still areas for substantial improvements in process energy use efficiency. Studies of “best available technology” indicate there is a gap between the average amount of energy needed to make specific products and the most efficient application.
Keywords
Boilers; furnaces and ovens; steam systems; water pumping and heating; electric motors; electric heating; electrolysis; compressed air
Introduction
Process energy is defined as energy required to process materials in order to provide goods or services. Examples readily come to mind: the heat required to cast or forge steel, electricity that powers welders and machine tools, and the fuels that operate furnaces and ovens. It consists of energy used in specialized production equipment, as well as in common support systems such as air compressors, motors, boilers, and refrigeration systems. Process energy is generally associated with the industrial sector and specifically with industrial manufacturing facilities.
About two-thirds of industrial energy use is in the form of process heat (roughly half as steam and the balance as direct heat); about one-fourth is in the form of electric energy (primarily electric drives); the balance of industrial energy use consists of miscellaneous uses and fuel used as feedstocks. It is apparent that process heat and steam are important considerations in industrial energy management. Electricity is important as well, as it is the fastest growing segment of industrial energy use.
For the global economy as a whole, industrial energy amounted to about half of the total in 2011 (refer to Table 2.3). Though industry still accounts for one-third of total energy use in the U.S. (31% in 2011), the situation is changing in some countries. In the United Kingdom, industry’s share of total energy use declined from 40% in 1970 to 16% in 2013. This decline is partly due to sectorial changes, but most importantly, energy intensity in industry fell by 70% during the same period, due to efficiency improvements.1 Contrast this trend to China, where industrial energy use accounts for about 70% of total energy usage, even though energy intensity has decreased by about 46% from 1996 to 2010.2 India represents another important player in global energy use. With “business as usual,” Indian industrial energy use is likely to double or triple over the next several decades.3
Industrial energy use, always important in the global economy, today has even greater importance as a key contributor to climate change. The five most energy-intensive industrial sectors (iron and steel; cement; chemicals and petrochemicals; pulp and paper; and aluminum) account for an estimated 77% of industrial direct CO2 emissions.4 While increased efficiency alone will not achieve the global reduction of greenhouse gas emissions considered necessary to address climate change, it is a vital first step.
In light of these statistics, it is clear that improving industrial energy management—specifically management of process energy—is increasingly important from a global perspective. However, it also has myriad benefits at the facility or corporation level, including reducing operating costs, increasing industrial productivity, and helping companies demonstrate environmental stewardship, all of which improve industrial competiveness. It can also help companies comply with carbon policies.
Scope of This Chapter
Though process energy is often associated with industrial manufacturing facilities, that is too restrictive a definition. For example, commercial laundries and restaurants use large amounts of energy in specialized processes, as do the agriculture and water and wastewater industries. Even though these market segments are not considered manufacturing industries, they do share the common thread that they process materials to provide a product or service. Therefore, the processes and associated energy management opportunities (EMOs) described in this chapter extend beyond the confines of industrial manufacturing plants.
The structure of this chapter follows the relative significance of process equipment energy use. In view of the importance of heat as a process energy form, we have placed a major emphasis on fuels, combustion, steam generation and distribution, direct- and indirect-fired furnaces and ovens, heat recovery, and electric heat. The next major area addressed is other electric process loads, namely transformers, electric motors and drives, pumps and fans, refrigeration and process cooling, and finally electrolytic processes including welding, plating and anodizing, and electrochemical machining. This chapter concludes with a discussion of a variety of other process energy forms, such as compressed air, machine tools and manufacturing processes, paint spraying, and energy storage and process controls.
General Principles for Process Energy Management
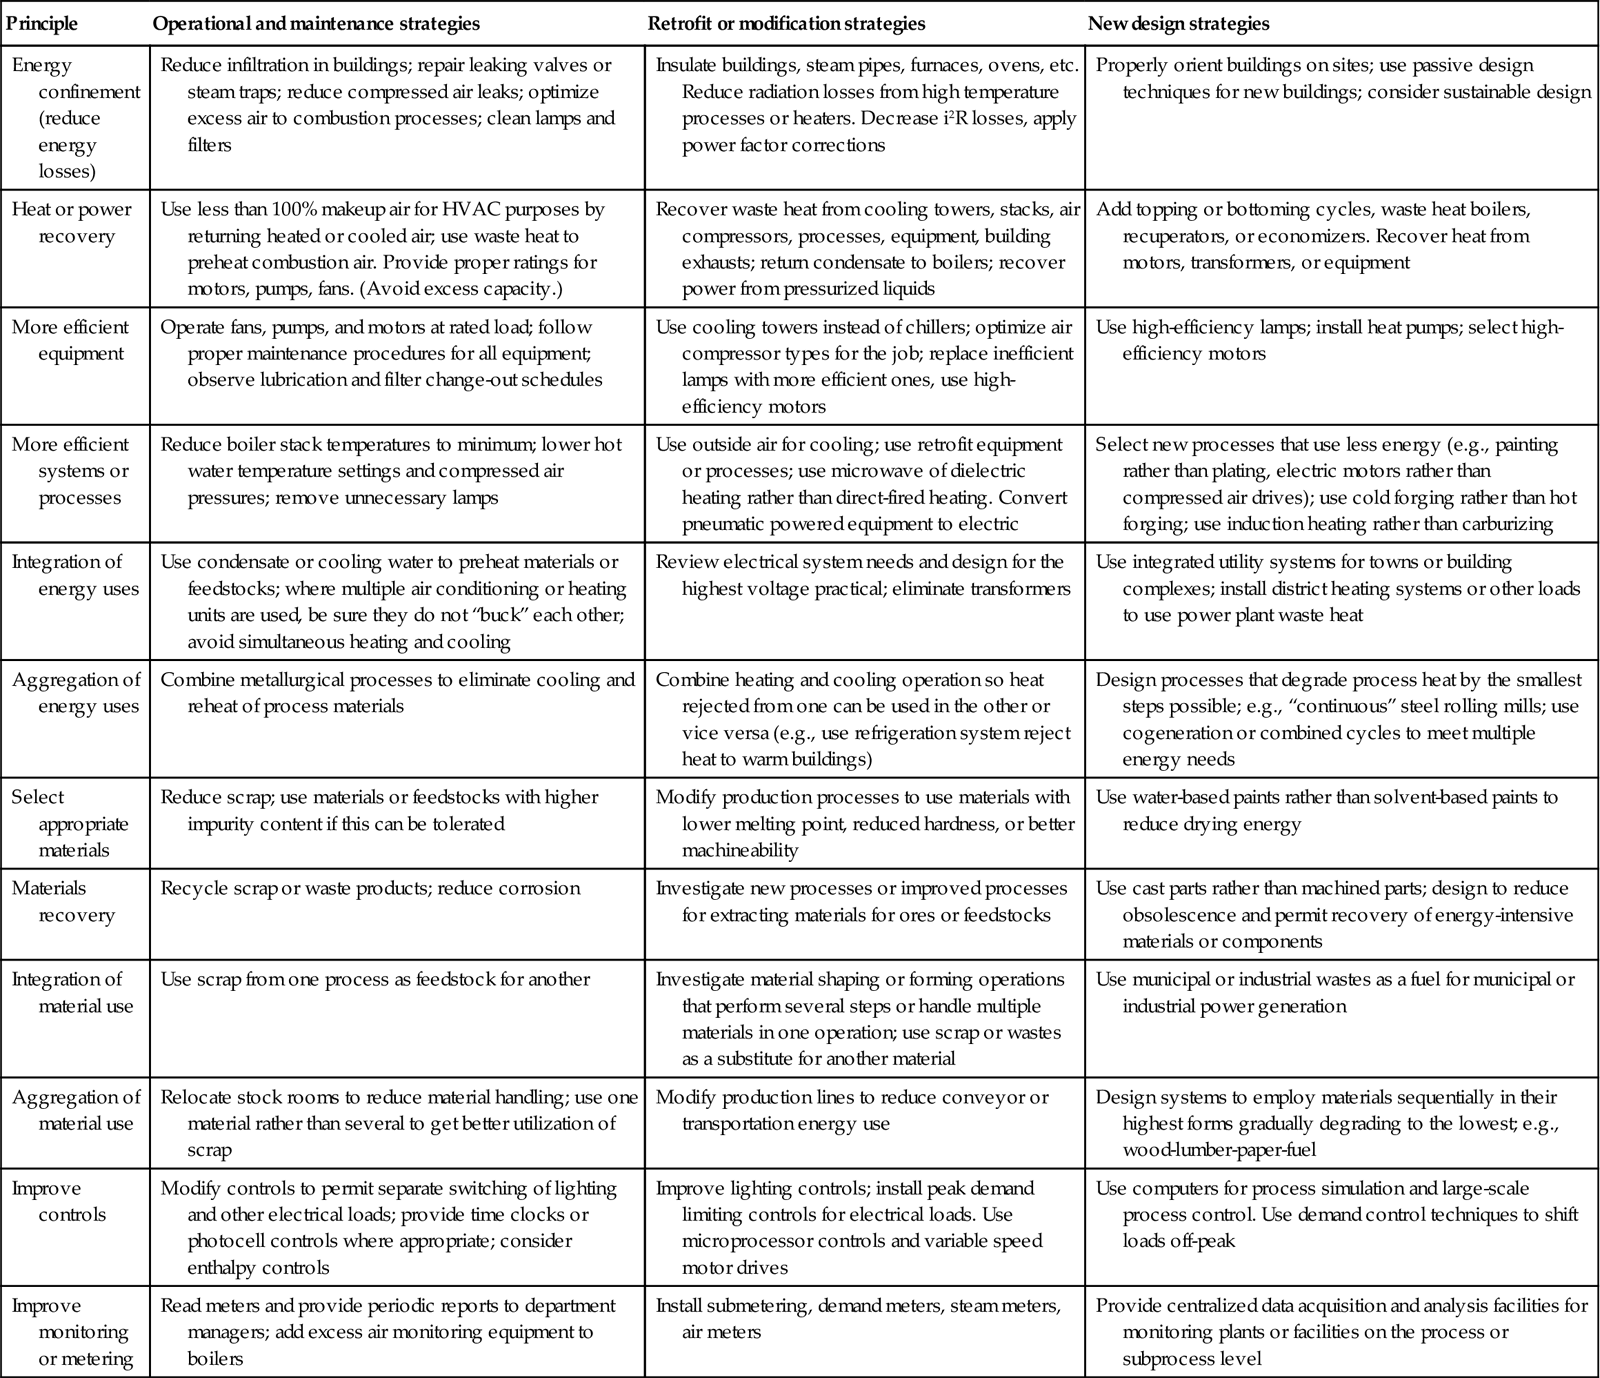
The general principles of energy management presented in Chapter 3 can be applied to the management of process energy use in a variety of ways. Table 11.1 lists the basic principles in approximate order of importance relative to process energy use and provides typical examples of the application of each principle. These principles can be applied to fuel and electricity. For example, process heating and cooling systems should be properly sized, avoiding excess capacity. Likewise, excess capacity in electric motors leads to inefficiencies of two types. First, motors are less efficient at partial load. Second, power factor decreases at low loads, causing the electrical distribution system to incur greater losses.
Table 11.1
Examples of principles for process energy management
| Principle | Operational and maintenance strategies | Retrofit or modification strategies | New design strategies |
| Energy confinement (reduce energy losses) | Reduce infiltration in buildings; repair leaking valves or steam traps; reduce compressed air leaks; optimize excess air to combustion processes; clean lamps and filters | Insulate buildings, steam pipes, furnaces, ovens, etc. Reduce radiation losses from high temperature processes or heaters. Decrease i2R losses, apply power factor corrections | Properly orient buildings on sites; use passive design techniques for new buildings; consider sustainable design |
| Heat or power recovery | Use less than 100% makeup air for HVAC purposes by returning heated or cooled air; use waste heat to preheat combustion air. Provide proper ratings for motors, pumps, fans. (Avoid excess capacity.) | Recover waste heat from cooling towers, stacks, air compressors, processes, equipment, building exhausts; return condensate to boilers; recover power from pressurized liquids | Add topping or bottoming cycles, waste heat boilers, recuperators, or economizers. Recover heat from motors, transformers, or equipment |
| More efficient equipment | Operate fans, pumps, and motors at rated load; follow proper maintenance procedures for all equipment; observe lubrication and filter change-out schedules | Use cooling towers instead of chillers; optimize air compressor types for the job; replace inefficient lamps with more efficient ones, use high-efficiency motors | Use high-efficiency lamps; install heat pumps; select high-efficiency motors |
| More efficient systems or processes | Reduce boiler stack temperatures to minimum; lower hot water temperature settings and compressed air pressures; remove unnecessary lamps | Use outside air for cooling; use retrofit equipment or processes; use microwave of dielectric heating rather than direct-fired heating. Convert pneumatic powered equipment to electric | Select new processes that use less energy (e.g., painting rather than plating, electric motors rather than compressed air drives); use cold forging rather than hot forging; use induction heating rather than carburizing |
| Integration of energy uses | Use condensate or cooling water to preheat materials or feedstocks; where multiple air conditioning or heating units are used, be sure they do not “buck” each other; avoid simultaneous heating and cooling | Review electrical system needs and design for the highest voltage practical; eliminate transformers | Use integrated utility systems for towns or building complexes; install district heating systems or other loads to use power plant waste heat |
| Aggregation of energy uses | Combine metallurgical processes to eliminate cooling and reheat of process materials | Combine heating and cooling operation so heat rejected from one can be used in the other or vice versa (e.g., use refrigeration system reject heat to warm buildings) | Design processes that degrade process heat by the smallest steps possible; e.g., “continuous” steel rolling mills; use cogeneration or combined cycles to meet multiple energy needs |
| Select appropriate materials | Reduce scrap; use materials or feedstocks with higher impurity content if this can be tolerated | Modify production processes to use materials with lower melting point, reduced hardness, or better machineability | Use water-based paints rather than solvent-based paints to reduce drying energy |
| Materials recovery | Recycle scrap or waste products; reduce corrosion | Investigate new processes or improved processes for extracting materials for ores or feedstocks | Use cast parts rather than machined parts; design to reduce obsolescence and permit recovery of energy-intensive materials or components |
| Integration of material use | Use scrap from one process as feedstock for another | Investigate material shaping or forming operations that perform several steps or handle multiple materials in one operation; use scrap or wastes as a substitute for another material | Use municipal or industrial wastes as a fuel for municipal or industrial power generation |
| Aggregation of material use | Relocate stock rooms to reduce material handling; use one material rather than several to get better utilization of scrap | Modify production lines to reduce conveyor or transportation energy use | Design systems to employ materials sequentially in their highest forms gradually degrading to the lowest; e.g., wood-lumber-paper-fuel |
| Improve controls | Modify controls to permit separate switching of lighting and other electrical loads; provide time clocks or photocell controls where appropriate; consider enthalpy controls | Improve lighting controls; install peak demand limiting controls for electrical loads. Use microprocessor controls and variable speed motor drives | Use computers for process simulation and large-scale process control. Use demand control techniques to shift loads off-peak |
| Improve monitoring or metering | Read meters and provide periodic reports to department managers; add excess air monitoring equipment to boilers | Install submetering, demand meters, steam meters, air meters | Provide centralized data acquisition and analysis facilities for monitoring plants or facilities on the process or subprocess level |
Approach
In the discussion that follows, we assume that the preliminary steps outlined in Chapter 4 have been accomplished, including the initiation and planning phase and the historical review. For the process under consideration, the basic facts are presumed known, either by energy audits, calculations, or measurements. The basic items required are the various energy forms (fuel, electricity, steam, compressed air, etc.), quantities (liters, kilowatt hours, kilograms per hour), and states (residual oil, 480 V, three phase, 235°C at 1.5 MN/m2 pressure, etc.), both entering and leaving the process. The process itself must be understood so the need for these various energy forms can be evaluated.
With this as background, our goal now is to determine how to manage process energy in the most efficient way and still get the job done.
The field of process energy use is so broad that it would take volumes to cover it in a comprehensive manner. In fact, entire books have been written about specific processes, e.g., energy use in foundries or plating operations. Therefore, our approach will be to review the fundamental aspects of some major areas, providing illustrative examples, and note sources of additional information where appropriate.
Potential Savings and Benchmarking
There have been a number of international studies to evaluate “best practices” in major segments of industrial energy use.5,6 These studies examine specific energy use in various industrial applications (such as glass manufacture, petroleum refining, and iron and steel mills) at different plants in different countries. From these data, the most efficient plants are used to establish a “best practice,” or best available technology for each end use. Then, by comparing the best practice to the average specific energy required for that end use, an estimate of the savings possible by deploying the best practice can be made. Compilations of such data provide an “efficiency benchmark” for individual companies to compare their process performance against others in the same industry.
These studies indicate that savings in the range of 20–26% of current industrial energy use are possible.
Today there are many tools available to the energy manager to analyze or evaluate specific industrial processes. An example is the U.S. Department of Energy’s Advanced Manufacturing Office (AMO), formerly the Office of Industrial Technology. This office provides many information sources, case studies, and tools for improving industrial process energy efficiency. Some of the specific types of equipment addressed are boilers and steam systems, air compressors, motors, fans, pumps, and process heat technologies. The website is www.energy.gov/eere/amo/information-resources. Besides free tools that help energy managers assess the efficiency of various industrial processes, the website has links to other sources of information. Another example is a website hosted by the European Community at http://iet.jrc.ec.europa.eu/energyefficiency. Technical guides, training courses, manuals, and other documents can be accessed at this site in various languages.
Caution must be exercised in applying any of the principles that follow on a general basis. Process energy use tends to be site- and process-specific. What is appropriate for one process and one plant may not be appropriate for a similar process in another plant, depending on fuel types and costs, weather patterns, variations in material properties, and a host of other variables. Judgment, careful analysis, and sound engineering are prerequisite for any successful energy management program.
Process Heat
Process heating applications range from the simple functions of heating water or generating steam to industry-specific applications such as drying, melting, curing, annealing, cooking, distilling, softening, and fusing various products and materials. Process heating technologies are also quite varied. The most common types are boilers, furnaces, ovens, and kilns, but there are also many specialty process heating technologies for specific applications. Some of the technologies for process heating overlap with those used for space heating (see Chapter 8), such as boilers, furnaces, and heat pumps. Both process heating and space heating systems are significant energy users.
The discussion below first describes the mechanisms of heat transfer and loss in process heating systems. It then provides an overview of energy use and management in five key areas of process heat: combustion, steam, hot water, furnaces and ovens, and electric heat.
Heat Transfer Mechanisms
To reduce heat losses, it is important to recognize that heat is transferred (and lost) through three mechanisms: conduction, convection, and radiation. Refer to Figure 11.1 in connection with the following equations:
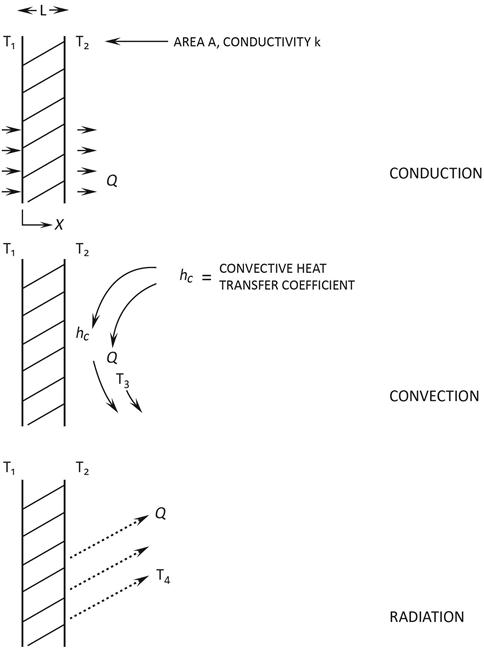
Conduction. Consider a section of material thickness ![]() , area
, area ![]() , thermal conductivity
, thermal conductivity ![]() , and exposed to temperature
, and exposed to temperature ![]() at one side and
at one side and ![]() at the other, such that:
at the other, such that: ![]() . The heat flow conducted through this material is
. The heat flow conducted through this material is
[11.1]
(see Table 12.2 for typical values of thermal conductivity, k.)
Equation 11.1 can be rewritten as
[11.2]
Thus, all other parameters being equal, the driving force for conduction heat losses is thermal conductivity and ![]() .
.
Convection. Convective heat losses are described by a similar equation:
[11.3]
![]() = convection heat transfer coefficient (also called film coefficient), W/m2·K
= convection heat transfer coefficient (also called film coefficient), W/m2·K
![]() = temperature difference between the surface and convection fluid, K
= temperature difference between the surface and convection fluid, K
Radiation. The third method for heat loss is radiation, given by this equation for a relatively small body in a large enclosure or space:
[11.4]
![]() = Stefan-Boltzmann constant, 5.67×10⁻⁸ W/m2·K4
= Stefan-Boltzmann constant, 5.67×10⁻⁸ W/m2·K4
![]() = temperature of surroundings, K
= temperature of surroundings, K
Reducing heat loss. With Equations 11.1–11.4, it is possible to see how to reduce heat losses and to evaluate the benefits from doing so.
For a given situation, the driving force for conduction heat loss is the thermal conductivity of an insulating material and the temperature difference across its thickness. In the case of convection, the loss depends on the temperature difference between the surface of a heated material and the ambient temperature, as well as the transfer area (in m2) and the convection heat transfer coefficient (in W/m2 K). Radiation heat loss is influenced by the area radiating heat, its emissivity, its temperature, and the temperature of its surroundings, where the temperatures are in Kelvin raised to the fourth power. At low temperatures, conduction and/or convection heat losses typically will dominate, while at high temperatures radiation becomes important.
To reduce conduction losses, either more or better insulation is required to increase insulation thickness and decrease thermal conductivity. To reduce convection losses, e.g., from a tank containing a hot fluid, an insulating cover should be added to reduce the convection heat transfer coefficient and the temperature difference. This would also reduce radiation losses. Radiation losses can also be reduced by adding radiation shields.
Combustion
Combustion is the starting point for almost all non-electric forms of process heat except nuclear or solar, neither of which is currently of great importance for manufacturing processes. In direct-fired operations, process heating is caused by radiant energy or is transferred by the products of combustion. In indirectly heated operations, the heat of combustion is first transferred to a working fluid (such as steam) that does the heating or that produces the electricity that does the heating. Thus, combustion is the first area to examine when considering energy management options.
Fuels can be rated according to their heating value, which is a measure of the available work they possess (see Appendices for typical values). In theory, nearly all the fuel’s potential to do work should be recoverable; however, due to practical limitations, there are losses due to the thermodynamics of combustion. The only current prospect for avoiding these losses is through the use of fuel cells that extract fuel energy without combustion. Size, economic, and lifetime constraints limit fuel cell applications for process energy use at present.
The next loss of available work in the combustion process results from the decrease in temperature from the flame temperature (on the order of 2000°C) to the process temperature. In the case of a steam cycle, the process temperature might be in the range of 200–500°C. In concept, efficiency could be improved if hot combustion products could be utilized at as high a temperature as possible, subject to the limitations imposed by useful engineering materials. Turbine technology permits temperatures of about 1100°C; this suggests that one improvement would be to use a topping cycle involving a direct-fired turbine to extract work. The turbine exhaust (typically at 600–650°C) could then be applied to a waste heat boiler to generate steam. The usual approach, to generate steam directly from fuel combustion, requires a drop in temperature from 2000°C to about 550°C due to material and corrosion limitations. This leads to a decrease in available work before the energy is even applied to a process.
While a combined cycle probably will not be feasible in an existing plant, there are several other EMOs that can be considered to improve combustion efficiency:
• Monitor fuel quality and improve if required.
• Provide correct amounts of excess air.
• Add or improve automatic controls or monitoring equipment.
• Establish and follow burner maintenance procedures.
• Use waste heat to preheat combustion air.
• Consider mixing combustible waste with fuel (solid waste with coal, waste lubricating oils with fuel oil, etc.).
We discuss these opportunities below as well as in Chapter 8.
Fuel Quality and Excess Air
Fuel should be analyzed periodically to determine that it still meets requirements. For example, excess fines (small coal particles) in coal could lead to improper operation, including too much excess air, which in turn leads to energy losses up the stack. Excess air is best controlled by monitoring flue gas oxygen content, either by periodic measurements, or better yet, by permanently installed instrumentation. The proper setting for the type of fuel can be established by testing. Fuel savings of 2–19% are possible from correcting excess air. Reviewing the combustion process helps explains the science behind the excess air issue.
Combustion of carbonaceous fuels requires oxygen. Oxygen is normally supplied from atmospheric air, which has the following standard properties:
Volumetric composition: N2: 78.1%; O2: 21%.
Mass composition: N2: 75.5%; O2: 23.2%.
Molecular weight: air: 29; N2: 28.02; O2: 32.0.
Mole ratio: 3.76 moles N2 per mole O2.
Moisture content: 60% RH, 0.013 kg water vapor per kilogram of dry air (26.7°C dry bulb temperature).
The combustion process may be outlined schematically as shown in Figure 11.2.

The following notation applies:
Subscripts have the following meanings:
| a = dry air | S = sulfur |
| w = water vapor | T = trace elements |
| C = carbon | dg = dry gases |
| H = hydrogen | A = ash |
| O = oxygen |
If the theoretical amount of oxygen required for complete combustion is calculated, one obtains (for any fuel):
[11.5]
The weight fractions for the various constituents in the fuel would normally be provided by the supplier or obtained by ultimate fuel analysis.
Using the properties of air, Equation 11.5 can be converted to an air basis:
[11.6]
This is obtained by recognizing that O2 is 23.2% (by weight) of air.
Combustion air calculations can be made on a mass basis, volume basis, or molar basis. The data in Table 11.2 are useful for such calculations.
Table 11.2
| Material | Chemical formula | Molecular mass ratio | Density, 15.6°C, 1.0 atmosphere (lb/ft3) | Density, 15.6°C, 1.0 atmosphere (kg/m3) | Heating value (Btu/lb) | Heating value (MJ/kg) |
| Carbon | C | 12.00 | – | – | 14,544 | 33.8 |
| Hydrogen | H2 | 2.02 | 0.0053 | 0.085 | 62,028 | 144 |
| Sulfur | S | 32.7 | – | – | 4050 | 9.4 |
| Carbon monoxide | CO | 28.00 | 0.0739 | 1.18 | 4380 | 10.2 |
| Methane | CH4 | 16.03 | 0.0423 | 0.68 | 23,670 | 55 |
| Oxygen | O2 | 32.02 | 0.0844 | 1.35 | ||
| Nitrogen | N2 | 28.02 | 0.0739 | 1.18 | ||
| Air | – | 29 | 0.0765 | 1.23 | ||
| Carbon dioxide | CO2 | 44.00 | 0.1145 | 1.83 | ||
| Sulfur dioxide | SO2 | 64.07 | 0.1692 | 2.71 | ||
| Water vapor | H2O | 18.02 | – | – |

Using the data in Table 11.2 and Equation 11.6 will provide the minimum amount of air (or oxygen) required for complete combustion of a given fuel. In reality, more air than this must be supplied, since some excess air is required for complete combustion. The amount of excess air depends on the particular system and fuel type. For natural gas, an efficient boiler might use about 15% excess air or roughly 19 kg per kg of fuel. Since this is 75.5% by weight N2, it means that for every kilogram of fuel, there is nearly 15 kg of N2 flowing through the boiler, being heated from ambient temperature to combustion temperature, and eventually carrying heat up the stack without bringing any benefit to the process!
Complete combustion requires that the following conditions be satisfied:
• An adequate air (oxygen) supply.
• Appropriate combustor temperature for fuel ignition.
• Adequate combustor residence time for complete combustion.
Too much airflow (excess air) leads to fuel waste by increasing the energy loss up the stack, while not enough air will lead to incomplete combustion.
Figure 11.3 schematically illustrates the relationship between heat loss and excess air. As the figure indicates, when the amount of excess air increases, the stack losses increase. For typical industrial type boilers, the correct amount of excess air is best determined by analyzing flue gas oxygen or carbon dioxide concentrations. Table 11.3 shows typical data for a natural gas-fired boiler.

Table 11.3
Combustion efficiency for natural gas
| Excess % | Combustion efficiency | |||||
| Flue gas temperature minus combustion air temperature (°F) | ||||||
| Air | Oxygen | 200°F | 300°F | 400°F | 500°F | 600°F |
| 9.5 | 2.0 | 85.4 | 83.1 | 80.8 | 78.4 | 76.0 |
| 15.0 | 3.0 | 85.2 | 82.8 | 80.4 | 77.9 | 75.4 |
| 28.1 | 5.0 | 84.7 | 82.1 | 79.5 | 76.7 | 74.0 |
| 44.9 | 7.0 | 84.1 | 81.2 | 78.2 | 75.2 | 72.1 |
| 81.6 | 10.0 | 82.8 | 79.3 | 75.6 | 71.9 | 68.2 |

Assumes complete combustion with no water vapor in the combustion air.
Source: U.S. DOE, Energy Efficiency and Renewable Energy program, Steam Tip Sheet #4.
On well-designed natural gas-fired systems, an excess air level of 10–15% is attainable. Higher amounts (e.g., 45%) will reduce boiler efficiency by 1–4%, depending on the stack temperature (Table 11.3).
Combustion Monitoring Equipment
On-going monitoring of combustion parameters will help identify and correct issues with the air-to-fuel ratio and will allow for assessment of the combustion efficiency. Measurements include the amount of O2, CO2, CO, and unburned hydrocarbons in the flue gas and combustion air and flue gas temperatures.
The O2 measurements indicate levels of excess air and the CO measurements indicate incomplete combustion. The proper ratio of air and fuel can be maintained manually by an operator if care is taken. However, electronic combustion analyzers and controls can automatically maintain efficient operation. If not already installed, such a system would likely pay for itself in a very short period of time, even by reducing fuel consumption by as little as 5%.
The combustion products (O2 and/or CO2) and net exhaust gas temperature can be used to assess the combustion efficiency for a given type of fuel and burner using manufacturer’s literature or combustion efficiency curves and tables in handbooks. The net exhaust gas temperature is defined as the flue gas temperature minus the combustion air temperature (ambient temperature) if no air preheater or economizer is installed. If there is an air preheater or economizer, determine the temperature at its outlet. The combustion air temperature should be measured at the forced draft fan inlet.
Burner Maintenance Procedures
Proper maintenance and operation of burners, stokers, and other combustion equipment is important. For example, deposits on burners can reduce burner efficiency and, in oil-fired systems, the temperature at which oil is delivered to the burners contributes to proper atomization and combustion.
Waste Heat for Preheating Combustion Air and Feedwater
Efficiency also improves with increasing combustion air and feedwater temperature, since less energy has to be supplied to heat them. In some instances, waste heat from stacks can be recovered and used to heat the incoming air. Preheating combustion air from ambient temperatures up to several hundred degrees centigrade can save as much as 5–10% of fuel consumption. It may be feasible to use heat recovery to preheat feedwater.
Steam Generation and Distribution
Improvements in steam systems fall into two broad categories. The first applies to the steam system itself, while the second applies to the end uses of steam. For steam systems, consider:
• Steam leaks from lines and valves.
• Proper sizing and maintenance of distribution systems, including insulation.
For steam end uses such as process heating, operating steam driven equipment, or heating buildings, some EMOs include the following:
• Supply steam at the lowest pressure possible.
• Review steam uses to see if more efficient alternatives exist.
The subsections below summarize these boiler and steam system EMOs. See Chapter 8 for additional opportunities.
Steam leaks and defective steam traps. Small steam leaks resulting from defective traps or valves can lead to surprisingly large energy waste, as shown in Figure 11.4. These types of leaks may also cause significant loss of water, which is an increasingly expensive and scarce commodity particularly in drier climates.

Sizing and maintenance of distribution systems. As steam loads change over time, the distribution system may be used for purposes other than those for which it was originally designed. If the lines are too small, pressure drops may be excessive. If they are too large—i.e., supplying small loads—the losses may be disproportionately large. In addition, the importance of proper steam line insulation cannot be overemphasized. Figure 11.5 illustrates the magnitude of heat loss from uninsulated lines.

Management of condensate return. In many processes, after use, steam is condensed and the resulting fluid is returned to the feedwater supply to the boiler. Otherwise, lost feedwater must be replaced and heated to provide a constant supply of steam. Condensate return saves energy in a number of ways. Not only is less energy needed to heat feedwater, but also less energy will be expended in pumping and chemically treating makeup water. Condensate return also saves water.
Example. Benefit of condensate return. Consider a boiler producing 25,000 kg/h steam. The feedwater temperature is 15°C and the condensate temperature is 50°C. With no condensate return, the energy input to heat feedwater is 8.9 GJ/h. With 100% condensate return, the energy input to heat feedwater is 5.2 GJ/h or a savings of 3.7 GJ/h. Suppose the fuel is oil rated at 5.8 GJ/bbl and the boiler thermal efficiency is 70%. The theoretical savings is nearly one barrel of fuel per hour. In reality, this is an upper limit, since 100% condensate return is unlikely.
In addition to using condensate return to recover energy, if there is some other source of waste heat, a heat exchanger can be provided to preheat feedwater to the extent possible.
Maintenance of steam tracing systems. Steam tracing systems (used to heat pipes, tanks, etc.) can waste energy if not maintained properly. An obvious caution is to turn them off when not needed.
Steam supply pressure. Steam usually will be supplied at the pressure of the highest load. In industrial operations, this may be 1–3 MN/m2 if steam turbine driven equipment is used. Steam is also used to transfer fluids by means of steam jets. For heating purposes, pressures are more typically in the range of 0.1–0.3 MN/m2. If most of the loads are at lower pressure, steam should not be supplied at high pressure. Instead, a substitute energy source could be found for high-pressure loads.
Efficient alternatives to steam systems. In some cases, electric motors or some alternative drive system will be more efficient than steam turbines. This would be true in cases where the steam loads are small or are distant from the steam plant. Electricity might even be better for heating in a particular case, if line losses and the effect of more precise temperature control are included.
Cascading of steam use. Sometimes steam must be provided at high pressure. Instead of using pressure-reducing valves, look for opportunities to cascade steam use, within acceptable limits on steam pressure, temperature, and quality. For example, high-pressure steam can first be expanded through a noncondensing turbine to do useful work, and then the turbine exhaust steam can be used for process or building heating.
Hot Water and Water Pumping
The heating and transport of water and other fluids requires utilization of energy to raise the water temperature, to make up heat losses from pipelines and storage tanks, to pressurize fluids, and to overcome the resistance to fluid flow of pipelines. There are EMOs associated with each of these energy requirements.
Water heating. The energy input necessary to raise the temperature of water (or another liquid) is given by
[11.7]
This can also be expressed as a rate in J/s by using a mass flow rate in kg/s.
Therefore, for a given quantity of water, the main opportunities to save energy in the water heating process are to increase the efficiency of the heating technology or lower the required temperature rise. There are several types of technology advancements that heat water more efficiently, including condensing boilers, heat pump water heaters, solar water heaters, or tankless water heaters. There may also be opportunities to lower the temperature rise by using waste heat recovery to preheat the feedwater or to only heat water to the temperature absolutely necessary for the given application.
Water heaters range from small 50 gallon storage units found in residences to large boiler-fired systems found in commercial establishments and industry. Today, for residential and small commercial applications, tankless water heaters are available with flow rates of up to 10 gpm. Tankless water heaters have an “instant on” feature that avoids standby losses typical of storage tank units (see Figure 11.6).

Example. A seafood restaurant used hot water for cleaning, rest rooms, and to preheat water used in large 60 and 80 gallon kettles. (Preheated water would come to boiling temperature more quickly—important during the rush hour.) The conventional 150 gallon water heater proved to be unreliable so the restaurant installed three tankless units. Two served the restaurant loads and one was dedicated to the large kettles in the kitchen. Other restaurant applications have reported gas savings with tankless water heaters of as much as 40–50% compared to storage units.
When considering the hot water system as a whole, it is also important to reduce losses. Losses due to heat transfer to the environment can be reduced by the following steps:
A major source of loss in hot water systems is the standby losses that occur when tanks are continuously maintained at elevated temperatures or they are not well insulated. Water heaters should be maintained at the minimum required temperature. Lowering the water temperature setting 5–6°C will reduce annual fuel cost by 4–5%. For smaller applications, consider investing in high-quality units with extra insulation and anode protection to prevent tank corrosion. Water heater “jackets” or “blankets” are also available to reduce heat loss in existing systems. In addition, insulate all hot water pipes to prevent heat loss and install insulating lids on any open tanks containing hot water (or other liquids) to prevent both heat loss and liquid losses. Additional benefits of preventing these types of heat losses in conditioned spaces are reduced load on HVAC equipment and improved occupant comfort and safety.
As noted previously, heat recovery is another useful technique that can be used in industry. Waste process heat (e.g., refrigeration compressor cooling water) can often be reclaimed to heat or preheat water.
Water pumping. The power required to move an incompressible fluid through a piping system is given by
This may be written as
[11.8]
Or, in more convenient form, the power expended in pumping a fluid is related to the volume pumped:
[11.9]
We also derived Equation 11.9 in Chapter 8 using the concept of head developed by a pump (see Equation 8.4).
The pressure drop depends on the system (pipes, channels, orifices, bends, etc.) and must be determined for each case. In the case of round pipes, it is given by the following equation:
[11.10]
![]() = friction factor, dimensionless
= friction factor, dimensionless
![]() = pipe diameter, m
= pipe diameter, m
The losses through bends, enlargements and contractions, and valves and fittings are similarly proportional to velocity squared.
For incompressible fluids, the volume flow rate ![]() is related to the velocity
is related to the velocity ![]() by
by
[11.11]
solving
[11.12]
Substituting these results in the equation for pumping power, we obtain
[11.13]
This is a very important and fundamental result. It indicates that once a pipe size is fixed, the power required for pumping increases as the cube of the volumetric flow rate. The practical significance is that if the flow rate is reduced 20%, the pumping power is cut in half. Conversely, for a fixed flow rate, the pumping power decreases in proportion to the fifth power of the diameter.
For a wide range of Reynolds numbers, f=0.022 for clean, commercial steel pipe. This holds true in either American/British or SI units, since f is a dimensionless ratio having units of length/length. If American/British units are used, a conversion factor (g=32.2 ft/s2) must be inserted in the denominator of the pumping power equation.
Pressure drops for complete piping systems require determination of losses through all components. This analysis is most easily performed with computer simulation models. Alternatively, handbooks provide data that convert flow resistance of typical pipe fittings to equivalent lengths of pipe.
Major pumping system EMOs can be summarized as follows:
• Reduce friction losses (increase pipe size, eliminate pressure-reducing valves).
• Use storage tanks or accumulator so pumps can be shut down. part-time or operated off-peak.
• Operate pumps at full load when possible.
It is a common practice to provide water at the pressure required to meet the highest pressure load. An alternate approach that will sometimes save energy is to provide water at the pressure needed by most of the load and provide booster pumps for high-pressure loads.
For additional energy management resources for pump systems, refer to the U.S. Department of Energy’s webpage: http://www.energy.gov/eere/amo/pump-systems.
Direct- and Indirect-Fired Furnaces and Ovens
Furnaces, ovens, dryers, and kilns have many similar attributes in terms of their basic heating functions as well as in their opportunities for energy management. For simplicity, we refer to this family of technologies collectively as furnaces and ovens. Direct-fired furnaces and ovens rely on heating directly by the products of combustion (fuel-fired) or by electric heating elements. Indirect-fired furnaces and ovens involve some type of heat exchanger for transferring heat from the heat source (e.g., steam or hot water) to the process. The majority of process heat is from combustible sources, although the share of electric process heat systems is likely to increase because of advantages related to ease of control, no emissions at the point of use, safety, smaller footprint, and widespread applicability.7,8
There are three basic approaches for managing efficient use of process heat (Table 11.4):
Table 11.4

The discussion below explains each type of opportunity in greater detail. (Refer also to Chapter 8 for the special case of heat recovery in HVAC systems.)
Reduce heat losses. Earlier in this chapter, we described three modes of heat transfer—conduction, convection, and radiation—and explained general ways to minimize heat loss through these mechanisms. Those general approaches apply to furnaces and ovens. Reduction of losses can be accomplished by insulation, reflective shielding, use of curtains, other methods to contain heat and isolate it from conditioned spaces, reduced temperatures, maintenance of heat transfer services, equipment shutdown when not in use, or improved designs. Generally, the economically optimal amount of insulation or other heat containment methods for furnaces and ovens (and associated piping or ductwork) depends on the temperature range and fuel costs, so there is no simple rule of thumb. Each case will usually have to be analyzed on its own merits.
Example. Improve insulation. A useful approach is to consider an analysis on a unit area basis. Consider an electrically heated oven or tank that loses 3.5 kW/m2 from its uninsulated walls under normal operating conditions. Analysis indicates that this could be reduced to 0.7 kW/m2 by adding 2.5 cm of Rockwool insulation. Energy costs are $28/GJ and annual operation is 2000 hours per year. Management requires a 1-year payback. The analysis indicates:
Unit energy loss without insulation:
Unit energy loss with insulation:
Energy savings:
Cost savings:
Therefore, if the installed cost of the insulation is equal to or less than $564 per square meter, a 1-year payback will be obtained.
Other forms of heat losses that should be evaluated include:
• Heat absorbed by the work or product and lost as the work cools.
• Heat absorbed by auxiliary equipment (conveyors, trays, etc.).
More efficient equipment and processes. Some process heating applications may benefit from equipment retrofits or replacements to improve efficiency. The literature in this area is extensive and growing. Examples include improved controls for better regulating process temperatures and other parameters, and new more efficient equipment designs. More efficient equipment designs generally require improved heat transfer capability, although sometimes installing an entirely different process will lead to savings.
One thing to consider in improving a process is how to approach the theoretical maximum efficiency for accomplishing a task. Consider the drying process. Much of the energy used in drying is to remove water. Given that the specific heat of water is 4,180 J/kg·K, and since the heat of vaporization is 2.26 MJ/kg, the minimum theoretical energy input to evaporate water originally at room temperature (20°C) is 2594 kJ/kg. Real processes will not do as well, since some energy is lost, is used to heat other materials, or heats the container or dryer. However, since a great many heating processes involve drying, distillation, or related end uses, more efficient ways of accomplishing these tasks are of great interest.
There are so many potential possibilities for new designs that it is impossible to enumerate them here. Instead we provide few examples. The general approach should be to carefully examine the specific needs of the process and then attempt to provide heat only when and where its use is essential.
Example. Jet impingement heating. A unique approach is jet impingement heating, used in the metals industry.9 This allows the heat to directly impinge on the object being heated, thereby penetrating the surface film barrier and increasing heat transfer efficiency by as much as a factor of 3. Incidentally, the same technique can be used for cooling, as in gas turbines.
Process heat savings also result from converting batch-type processes to continuous operation. This conserves fuel by eliminating or reducing heat-up and cool-down periods. It often increases productivity as well.
Example. Continuous operation. One company replaced a group of batch-type kilns with a gas-fired walking beam kiln, and found the new kiln operated with 20% less fuel, and had 2.5 times the product throughput. Labor savings also resulted, since only two personnel (rather than ten) were required to operate the new unit.
Another process improvement relates to excess air. Excess air is provided to certain types of ovens for diluting the exhaust air. For example, in solvent drying ovens, air is introduced to create an air–gas mixture that is below the lower explosive limit (LEL). Many ovens use excessive amounts of dilution air, thereby wasting heat and fuel.
Typical industry practice is to operate in the range of up to 25% LEL concentrations. With automatic controls, operation up to 50% LEL limits is possible. Many ovens operate below 25% LEL and may be operating as low as 5 or 10% LEL. This is equivalent to about four times the excess air actually needed, or about twice the energy use actually required.
Refer to the “Electric Heat” section for examples of some promising electric process heat alternatives.
Heat recovery. As noted throughout this book, heat recovery is an important tool for the energy manager. Following the 1970s oil embargo, great emphasis was placed on identifying new methods to reclaim heat. Long practiced in industry, heat recovery is now being extended to agriculture and commerce. The technology can be applied to many waste energy streams, including hot gases, hot air, hot water, hot chemicals, and other hot process streams. The variables that determine the feasibility of heat recovery include the value of the heat, when it is available, the cost of installation, and the uses to which it can be put.
Typical uses for recovered heat include process heating and drying, preheating fuels or materials, space heating, and hot water. Sometimes heat recovery leads to other economies, such as reducing fan or pump operation, or permitting cooling tower operation to be reduced. The potential list of applications for this technique for process heating is too long to include here, but representative examples included throughout this book will illustrate the possibilities. A few examples include the following:
• Recover heat from building exhaust air using run-around systems.
• Recover heat from milk and dairy operations using heat exchangers or heat pumps.
• Recover heat from air compressor cooling water and preheat hot water with it.
• Recover heat from steam condensate or boiler blowdown and use it to preheat feedwater.
• Recover heat from chillers and use for hot water or space heating.
• Recover heat from flue gases to preheat combustion air.
• Recover heat from hot process streams, exhaust, or stacks.
In evaluating heat recovery possibilities, the first step is to evaluate the temperature of and the quantity of heat available. If it is available at low temperatures (50–100°C) there is generally a use for it, if only for heating water and spaces. In the moderate temperature range of 100–200°C, there are many possibilities, including raising steam. Above 200°C, cogeneration and other high temperature applications begin to look attractive.
Example. Assume that 1.0 GJ of heat costs $10 in the form of steam. Thus for each 1.0 GJ of heat recovered per year, one could justify an investment of say $10 if a 1-year payback was required. Depending on local tax codes and credits, utility pricing and incentives, fuel cost escalation, and the cost of money, the allowable investment might be higher, say $15 or $20. After this determination is made, the next step would be to determine the cost of purchasing and installing heat recovery equipment capable of recovering 1.0 GJ/yr (nominal). From this analysis, a decision could be made as to whether or not the investment was justified.
Often the heat exchange equipment is a critical item, depending on the temperature range and corrosiveness of the hot effluent streams. The selection of the optimum heat recovery system size involves a balancing of the cost of the equipment compared to the benefit of recovering still more heat.
See Chapter 8 for more information on heat recovery applications and technologies for recovering heat, such as regenerative and recuperative systems as well as heat pumps.
Electric Heat Applications
Due to its relatively higher cost, electricity is not used extensively for process heat. However, there are some types of applications where electricity offers advantages for heating. Electric heat can take several forms:
Resistance heating. Resistance heating makes use of the i2R law; i.e., power dissipated is proportional to the square of the current times resistance. An example of this is a conventional residential electric water heater, which has two resistance heating elements, nominally rated at 3800 W and 240 V, single phase. This form of resistance heating has a high first law efficiency because all the heat is transferred to the material being heated; i.e., the water. Losses result from conduction through the tank walls and distribution piping.
Induction heating. Induction heating is similar to resistance heating in that the actual heating is caused by current flowing through resistance. However, in the induction heater, the heating current is induced in the work piece. An example is the heating of transformers, cores, and motor windings. Even though they are laminated to produce high resistance to the flow of such currents, transformers are in effect inductance heaters.
In an induction furnace, a coil surrounds the work piece, which must be a conductor. A variable frequency power source (oscillator) is connected to this coil, inducing eddy currents that in turn heat the work piece. The eddy currents exhibit a “screening” effect; i.e., the current density at the surface of the work piece is maximum and decreases exponentially with depth. A “penetration” depth can be defined, wherein the current has decreased to about 37% of the surface value. Approximately 90% of the heating occurs within the penetration depth. Since the penetration depth is inversely proportional to frequency, a low frequency would be used for heating a large piece and a high frequency for a smaller size.
Example. A forge heater. Billets of steel are brought by a conveying system into a water-cooled copper coil. The frequency is in the range of 1–10 kHz; specific power is about 300 kWh/ton. Advantages of induction heating include excellent temperature control and no surface decarburization. The disadvantage is a low power factor (typically 0.1–0.5), which can be corrected with capacitors.
Dielectric heating. Dielectric heating refers to the heating of nonconducting materials by an electric field. Basically, this is similar to the heating that occurs in the dielectric of a capacitor on which a high-frequency voltage is impressed. The electromagnetic fields excite the molecular makeup of material, thereby generating heat within the material. As a result, the heat is distributed uniformly throughout the work piece. Dielectric heating can be applied to wood, paper, food, ceramics, rubber, glues, and resins. The heating effect is proportional to the dielectric loss factor, the applied frequency, and the electric field strength.
Dielectric systems can be divided into two types: RF (radio frequency) and microwave. RF systems operate in the 1–100 MHz range, and microwave systems operate in the 100–10,000 MHz range. RF systems are less expensive and are capable of larger penetration depths because of their lower frequencies and longer wavelengths than microwave systems, but they are not as well suited for materials or products with irregular shapes. Both types of dielectric processes are good for applications in which the surface to volume ratio is small. In these cases, heating processes that rely on conductive, radiative, and convective heat transfer are less efficient.
Most industrial applications are below 200 MHz. Depending on the frequency, care must be given to design the system to avoid interference with telecommunication.
Electric arc furnace. The electric arc furnace has three electrodes connected to the secondary windings of a three-phase transformer. The principle is the same as in electric arc welding. When an arc is struck, the nearby gas is raised to such a high temperature (in excess of 5000°C) that it becomes highly ionized. In this state, it is a sufficiently good conductor to be maintained at high temperature by the resistive heating produced by the current. The high temperature of the plasma permits very efficient heat transfer. Arc furnaces with capacities in the range of a few tons to hundreds of tons are in use. The primary application of electric arc furnaces is for melting and processing recycled steel.
Microwave heating. Microwave heating (a form of dielectric heating) is a highly efficient technique for heating by high-frequency electromagnetic radiation. Typically, frequency bands are 896 or 915 MHz and 2450 MHz, corresponding to wavelengths of about 0.33 and 0.12 m. Energy is deposited in the work piece according to the same principles as the dielectric heater described above.
Furnaces can be designed to be resonant or nonresonant. The microwave oven found in many homes is an example of a resonant cavity device. Resonant systems have efficiencies generally in excess of 50%. Again, because the heat is deposited in the work piece, losses are minimized.
Infrared heating. Infrared heating is generated by i2R losses in heating lamps or devices, and this is a special case of resistance heating. The difference, however, is that infrared energy can be generated in a narrow bandwidth. This can be applied more efficiently in some cases than combustion energy that spans a broader bandwidth. To be most efficient, infrared heaters should concentrate their output at the peak of the absorption spectrum for the material being heated. For water, this corresponds to a wavelength of about 2.8×10⁻⁶ m. There are applications in papermaking, drying paints and enamels, and production of chemicals and drugs. Intensities in the range of 10–40 kW/m2 are possible.
Heat pump. The heat pump is basically a refrigerator operating in reverse. An evaporator receives heat from a low temperature heat source (the air, waste heat, ground, water, etc.). This causes evaporation of the working fluid; the vapor is then compressed by the compressor. In the condenser, it gives up the heat collected at the evaporator as well as the heat of compression. As this heat is delivered, the vapor condenses, and the hot condensate passes through the expansion valve.
Heat pumps fall into the several categories, depending on the type of heating and the purpose. Those used for residential HVAC and water heating are primarily air-source or ground-source heat pumps, meaning they extract heat either from the air or from underground pipes. Therefore they use air-to-air or liquid-to-air heat transfer. Larger units for commercial and industrial applications employ liquid-to-liquid heat transfer.
Example. Potential for reduction in CO2 emissions. We conducted a study for EPRI on the potential to reduce greenhouse gas emissions in the U.S. by 2030 by expanding end-use applications of electricity in the residential, commercial, and industrial sectors.10 For the industrial sector, we identified five electric process heating technologies capable of yielding net reductions in CO2 emissions relative to their fossil-fueled alternatives, even considering losses due to electricity generation, transmission, and distribution. The technologies in order of highest to lowest potential for energy savings and CO2 reductions are
The study timeframe was 2005–2030 and was based on the actual and projected generation mix in the U.S. for the four census regions (West, South, Midwest, and Northeast), as forecasted in the Energy Information Administration’s 2008 Annual Energy Outlook’s reference case scenario.
The results yielded a realistic potential of achieving CO2 reductions of 45.1 million metric tons per year by steadily expanding use of these five technologies by 2030 across the U.S. The estimated technical potential was 73.1 million metric tons per year; however, the technical potential does not take into account cost-effectiveness or market acceptance, while the realistic potential attempts to factor in those key market barriers. The South and Midwest census regions had the highest potential for reductions because their generation mixes are more carbon intensive than the West and Northeast census regions.
This example helps highlight some of the benefits of electric process heating alternatives. In addition to electricity’s advantages in delivering heat when and where it is needed, as well as in its ability to extract heat from lower temperature sources (i.e., using heat pumps), some electric process heat technologies save considerable energy in certain applications compared to fossil-fueled counterparts—so much so that they lead to lower overall greenhouse gas emissions, even when generation, transmission, and distribution losses are factored in.
Transformers and Electrical Distribution Systems
Three-Phase AC Circuits
Virtually all heavy industrial power is provided via three-phase circuits. The reason for this is one of size and economy. Larger blocks of power can be transmitted more efficiently and machinery can be more compact with three-phase systems.
Since copper and other metals have an important effect on capital costs of large equipment, there is also a trend to increase voltage, permitting lower currents, smaller size conductors, and lower i2R losses as well.
Three-phase voltages are generated with a generator having three sets of windings. Transformers likewise have three sets of windings. In a three-phase circuit, there are two types of connections: the wye and the delta. For either configuration, three-phase power is given by
[11.14]
Common nominal line-to-line three-phase voltages are 208, 230, 460, 575, and 2300 V.
Electric System Losses
Motors, transformers, and other electromotive and conversion devices make use of magnetic and electric fields for energy conversion. Mechanical energy is produced because of the fact that a conductor of length l carrying a current i in a magnetic field B experiences a force equal to
[11.15]
Transformers, motors, and other all electrical mechanical devices lose energy through various mechanisms, including
Internal resistance may be characterized as the losses caused by conductors (i2R losses). Hysteresis losses are those that are inherent to magnetic fields. When the magnetizing force is removed, not all the stored energy is recovered. An empirical relation for hysteresis losses is given by
[11.16]
Eddy currents are losses that occur because the magnetic core material itself consists of materials that conduct electricity; as voltages are induced in this material by alternating magnetic fields, currents called eddy currents are produced. An approximate expression for these losses is given by
[11.17]
When all types of losses are considered, the large transformers used in industrial processes typically have efficiencies at the high end of the 90+ percent range.
The energy lost in electrical distribution systems at voltages typical of industrial processes is predominantly in the form of i2R losses. These losses can be determined by knowing the length of the conductor, the conductor material and cross-sectional area, and its resistivity per unit length. With these conductor properties known, the losses can be calculated as follows:
[11.18]
At very high voltages (experienced in transmission lines, but generally not in industrial applications), there are two additional sources of losses: radiation and dielectric heating. Radiation losses occur when the voltage is sufficiently high that the line acts as an antenna and radiates energy. Dielectric heating occurs when voltages are induced in insulating materials.
A secondary effect of transmission and distribution systems is voltage drop. Conductors need to be sized to minimize the voltage drop. There is a trade-off between the capital costs of larger conductors and reduced performance of equipment installed at the end of a long distribution line, where voltage drop causes the equipment to operate at a lower than specified voltage.
Electric Motors and Drives
Electric motors and drives account for a substantial share of electricity use in the commercial and industrial sectors. In fact, in many industries they are the largest end-use of electricity, followed by nonprocess uses (such as lighting and HVAC, which also uses motors) and electric process heat. Therefore, improving energy management has the potential for significant energy savings.
The same factors that cause energy loss in transformers act in motors as well, contributing to losses in the stator, rotor, and windings. There will be i2R losses in both the stator and rotor windings. Hysteresis and eddy current losses will occur in the stator and rotor core materials. Furthermore, there are at least two other sources of losses: friction and windage losses caused by the bearings and the motor fan, and stray losses, due to electrical harmonics and stray currents.
There is a great variety of motor types, including DC motors (less common in industry) and induction and synchronous AC motors. Induction motors can be further subdivided into squirrel cage and wound rotor types. Each of these exists in both single-phase and three-phase motors.
Although larger motors are inherently efficient, they are often used inefficiently. Oversized motors operating at less than full load have lower efficiencies and in addition have a lower power factor. Good motor maintenance (lubrication, proper cooling, etc.) are also essential to efficient operation. The selection of the motor type can have an impact on energy efficiency. Efficiency in motors basically depends on good design and use of high-quality materials. There is a wide variation in motor efficiency, ranging from 70% to 94% or higher for large (>200 hp) industrial motors. The National Electrical Manufacturers Association (NEMA) publishes specifications for electric motor efficiency. The latest is the “NEMA Premium.”11 It outlines the minimum requirements for three-phase AC induction motors applied to municipal and industrial applications for operation on voltages 5000 V or less, rated 2500 hp or less, operating more than 2000 hours per year at >75% of full load. In addition to the type and size, efficiency is also affected by motor load. Electric motors are most efficient when operated at or near full load. Refer to Table 7.1 for typical motor efficiencies.
Conversion of Electrical Energy to Mechanical Energy
Electric motors are generally found as components of larger systems, e.g., pumps, fans, process cooling systems, air compressors, conveyors, elevators, and assorted equipment for crushing, grinding, stamping, trimming, mixing, cutting, and milling operations. In each of these systems, there are other losses in addition to those in the motor. These may be broadly summarized as follows:
The efficiencies of mechanical components such as clutches, gears, belts, and chains are typically high, in the range of 80–98% if used properly. However, when there are several of these components in the machine, the combined efficiency can be low. The wasted energy is primarily expended overcoming frictional losses and is eventually dissipated as heat. In some circumstances, this is useful. In air-conditioned spaces, this heat will add to the total air conditioning load.
Variable Speed Drives
Variable speed drives (VSDs), also called variable frequency drives, are a valuable tool for the energy manager. Typically the VSD system consists of a three-phase AC induction motor and a variable frequency power supply. The variable frequency power supply uses solid state components to produce a pulse-width modulated current that varies the power and frequency supplied to the motor. This enables accurate control of the motor speed over a broad range. VSDs are used in connection with pump and fan applications to vary the pump or fan speed according to demand, often with large savings in energy use.
EMOs with Motors
Table 11.5 summarizes EMOs with motors. The table lists a series of actions that users can employ to reduce energy use. (Note that many electric utilities offer incentives for installing efficient motors and VSDs.)

It is clear that there is not much one can do with an existing motor, so long as it is operated efficiently. The inherent i2R losses in the stator and rotor cannot be reduced without rewinding the motor or purchasing a new one. However, by understanding how these losses occur, the user can optimize motor use. Since running at no load wastes energy and results in a low power factor, it should be avoided. Operating motors as close to the fully loaded condition as possible will improve efficiency and power factor. If the power factor is very low (say less than 80% for a large motor or group of motors), it may be economically advantageous to install capacitors to correct it.
In the limited space available in this book, it is not possible to discuss all of the many applications of electric motors, so here (or in Chapter 8) we have focused on pumps and fans, refrigeration and process cooling, and compressed air systems. Additional details may be found in the references cited in this chapter.
Pumps and Fans
Pumps are of three types: centrifugal, axial-flow, or positive displacement. Optimum pump performance requires that it operate at its point of maximum efficiency. As noted above (see Equation 11.13), pumping power is related to the cube of the volumetric flow rate. Thus small changes in flow have an important effect on power requirement. The same is true of fans. Pumps and their EMOs are discussed in more detail in an earlier section of this chapter and in Chapter 8. Fans are covered in Chapter 8.
Refrigeration and Process Cooling
Commercial and industrial refrigeration systems and process cooling technologies function in much the same way as the space cooling systems described in Chapter 8. The primary difference is the application. Instead of providing space cooling for occupant comfort, they serve functions such as the following:
• Refrigerating food and other products with commercial refrigeration systems.
• Providing cooling to food and beverage processing applications.
• Cooling refrigerated warehouses.
Great advances have been made in the energy efficiency of refrigeration and process cooling systems during the last several decades. (For an example that we can all relate to, today’s refrigerators use only about 25% as much energy as those sold when the first edition of this book was published!) As another example, ammonia refrigeration systems have increased in popularity for industrial applications due to restrictions and phase out of chlorofluorocarbon, hydrochlorofluorocarbon, and hydrofluorocarbon refrigerants because they damage the ozone layer. Ammonia is a very effective refrigerant and is not ozone-depleting, nor does it directly contribute to greenhouse gas emissions.
The list below contains examples of EMOs with refrigeration and process cooling systems:
• Set the operating temperature in the proper range.
• For refrigerators or cold storage areas, avoid excessive opening and shutting of the doors.
• Install strip curtains for better containment.
• Place cooling equipment in a “cool” location, i.e., not next to a source of heat.
• Optimize set points and controls.
• Floating head pressure controls.
• Demand-based evaporator defrost schedules.
• Maintain condensers (remove scale; maintain water quality).
• Reduce lighting and other building loads to minimize load on cooling system.
• Install more efficient fan motors.
• Install VSDs on compressors, condenser fans, evaporator fans, pumps, as applicable.
• Consider two-stage versus single-stage compression for low temperature refrigeration.
• Consider applications of thermal energy storage or heat recovery.
Refer to the literature for detailed descriptions of these and other opportunities.12
Example. Efficient process cooling and heating in a cheese and whey manufacturing facility. A cheese manufacturer in the northwestern U.S. uses heat recovery between milk and whey process lines to reduce heating and cooling energy requirements. The process works as follows. Milk collected from dairies is trucked to the plant 24 hours per day at 7°C (45°F) and stored in refrigerated silos. During processing, the milk is pumped from the silos and converted into cheese for 21 hours per day; the cheese making equipment is cleaned-in-place (CIP) during the other 3 hours per day. The first step in the cheese making process is pasteurization, where the milk is raised to a temperature of 74°C (165°F) for 15 s. Subsequent cheese making steps produce hot whey which must be cooled prior to further processing. Whey processing occurs 24 hours per day; during the 21 h of overlap between the milk and whey processing, the cold milk from the silos is routed through a plate and frame heat exchanger to precool the whey and preheat the milk. The manufacturing facility uses a refrigerated glycol loop to provide the additional cooling necessary to reach a whey processing temperature of about 16°C (60°F). The heat recovery that occurs in the milk-whey heat exchanger optimizes energy use in two ways: (i) precooling the whey with the cold milk lowers refrigeration (electricity) requirements and (ii) preheating the milk with the hot whey reduces steam (natural gas) requirements for milk pasteurization.
In a recent project, the facility explored energy-efficient and cost-effective options to increase the capacity of its whey cooling system. One concern with the previous system was that the glycol loop lacked sufficient capacity to meet all cooling needs of the whey stream during the 3 hours of CIP (when the milk was not available for precooling). The facility installed a fluid cooler to augment the existing cooling system during those 3 h instead of increasing the capacity of the glycol-cooled refrigeration system. The fluid cooler is essentially a cooling tower that uses noncontact cooling water to cool the whey, whereas the glycol-cooled refrigeration system relies on a more energy-intensive refrigeration cycle. The facility still uses the glycol system to get the whey to the correct temperature, but instead of using the glycol system to bring the whey from about 74°C to 16°C (165–60°F) during those 3 h, the plant uses it to bring the whey from about 32°C to 16°C (90–60°F).
According to energy analysis estimates, installation of the fluid cooler saves the facility over 900,000 kWh per year. This level of savings equates to energy cost savings of roughly US$46,000 annually. The facility received an incentive of over US$110,000 for the project from the local utility, which covered approximately one-fourth of the fluid cooler cost. Other improvements made to steam use on the milk pasteurization side of the process save an estimated 6770 GJ (6420 million Btu) per year in addition to the fluid cooler electricity savings.
Electrolytic Systems
Electrolysis involves movement of positively- or negatively-charged ions within an electrolyte between an anode (positively-charged electrode) and a cathode (negatively-charged electrode). These familiar processes involve electrolysis:
• Electrowinning (refining of metals such as aluminum).
Example. A lead–acid storage battery. In this battery, a plate of metallic lead is attached to the negative terminal. The positive terminal is connected to a plate consisting primarily of porous lead dioxide paste in a matrix. In between the plates is a solution of concentrated sulfuric acid. As the battery discharges, the reaction produces positive ions that drift away from the negative terminal, leaving behind electrons. During discharge, acid is consumed and water is formed, decreasing the specific gravity of the fluid in the battery. When recharging, water is consumed and acid is produced. Under fully charged conditions, the potential of a single cell is slightly more than 2 V. Six cells are required to produce a 12 V battery.
Faraday’s Laws
Faraday’s laws form the basis for electrolysis. Briefly stated, Faraday discovered that 1.0 Faraday (26.8 ampere-hrs or 96,494 coulombs) would liberate one gram-equivalent of an element at an electrode during electrolysis.
Using Faraday’s law, it can be shown that only a small fraction of total mass of the storage battery reacts during charging/discharging (about 4 g equivalents for a typical automobile battery or about 0.4 kg).
Corrosion
Corrosion occurs as a result of oxidation–reduction reactions between a metal or alloy and a corroding agent. Corrosion can occur as a result of chemical reactions, which usually require high temperatures and a corrosive environment, or due to electrochemical reactions, which are more common. Note that corrosion is an important indirect use of energy.
The electrochemical reactions resemble the processes that take place in a battery. They can arise when dissimilar metals occur in the presence of an electrolyte or in the presence of external electric currents. A common electrolyte is water with trace amounts of dissolved salts, acids, or alkalis. The rates of corrosion reactions are dependent on the concentration of salts, acids, or alkalis in the electrolyte, and on the surface, temperature, and chemical constituents of the corroding metal.
Welding
Where possible, AC welders are preferred as they offer a better power factor and more economical operation. Automated systems reduce standby power losses compared to manual welding because they place the weld bead more consistently (less start/stop).
Electrowinning
An important use of electrolysis is the refining of metals such as aluminum. Basically the original process involved the electrolysis of a solution of aluminum oxide in molten cryolite, using carbon anodes and electrodes. In the electrolyte solution, aluminum oxide disassociates into aluminum and oxygen ions. As currents on the order of 105 amperes pass through the cells (at potentials of 5.0–5.4 V), the aluminum ions migrate to the cell lining (cathode) where they are reduced to metallic aluminum. This process required 15–20 kWh per kg of electricity. New processes have been developed that reduce the amount of electricity required.
Plating and Anodizing
An electric current flows in a tank where the object to be plated or anodized serves as one of the electrodes. In plating, the plated object serves as the cathode and the anode has the material to be electrodeposited. Alternatively, the anode may be nonconsumable carbon and the plating material may be drawn from the bath. In anodizing (typical for aluminum), the object to be anodized is the anode and a direct current produces a buildup of aluminum oxide on the surface. By use of various organic acids, colored finishes can be produced.
Electroforming, Electrochemical Machining
Electroforming is a process whereby a thin layer of metal is deposited on an object to be coated or on a mold that is later removed. The classic example is copper plated baby shoes! Electrochemical machining is the reverse of plating; a high current is passed between an electrolyte and the part, removing metal. This process is used for fine, intricate parts or hard, difficult-to-machine metals.
EMOs in Electrolytic Processes
Table 11.6 summarizes typical energy management possibilities for electrolytic processes. The greatest users of energy in this field (aside from the large indirect use caused by corrosion) are in primary metals production, particularly aluminum and magnesium.

Compressed Air
Compressed air is a major form of process energy and is used in a variety of applications, such as to drive power tools and machinery, for conveyance, for spraying and painting applications, to operate controls, in injection molding, and in drying and cleaning processes. Compressors are either fuel-fired (engines) or electric motor driven.
Example. Replacing an air compressor with a variable frequency drive (VFD) air compressor. In a candy factory on the East Coast of the U.S., process air was supplied by a 150-hp air compressor that was considered oversized for the load. The air compressor operated for 24 h, 5 weekdays per week, off on Sunday, and on for part day Saturday. Measurements indicated that the original air compressor used 515,269 kWh per year. The decision was to replace it with a “right-sized” 100 hp unit with a VFD. Figure 11.7 shows the measured performance of the new unit during a typical weekday. Based on the load measurements, the VFD compressor used 174,101 kWh per year, so the project energy savings were estimated to be 341,168 kWh per year with coincident peak demand savings of 17 kW (summer) and 28 kW (winter). The project cost was US$116,000 with a utility rebate of US$45,000. The average electricity cost (demand and energy charges combined) was US$0.16, so the savings was US$54,587 per year. This savings, when added to the rebate, resulted in an attractive simple payback of 14 months for this project.
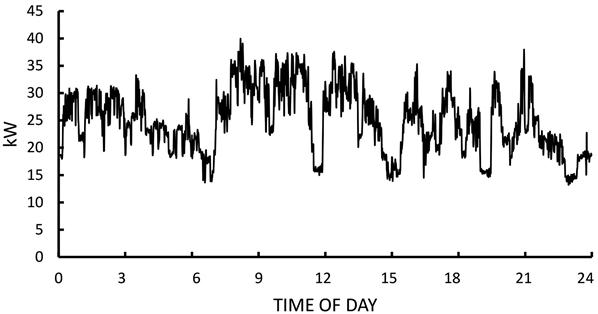
Whether fuel-fired or electric motor driven, the energy required depends on the efficiency of the machine and the work necessary to compress the air. EMOs are related to reducing the amount of compressive work, recovering heat, reducing losses of potential energy stored in the compressed air, and avoiding misuse of the compressed air. Efficient operation is influenced by
• Selecting appropriate type and size (rotary, reciprocal, etc.).
• Providing for intake air as cool as possible.
• Maintaining filters and coolers.
• Replacing inappropriate uses of compressed air.
• Replacing air-powered tools with electric tools when appropriate.
• Optimizing load with unloading controls, automatic shutdown, compressor sequencing controls.
• Using air receivers to minimize loading/unloading cycles.
• Installing dew point demand controls on air dryers instead of timed purge.
The optimum type of compressor depends on the capacity, pressure, and duty cycle. Selection of the best type for the job can lead to 10–20% improvement in efficiency. Intake air should be as cool as possible, as can be seen in the following equation:
[11.19]
At atmospheric pressure, the volume of air to be compressed will be directly proportional to its temperature. The compressor will have to do more work to compress hot air. Table 11.7 shows a savings resulting from moving the compressor air intake to a cooler location.
Table 11.7
Power requirements and compressor air inlet temperatures
| Temperature of air intake | Intake volume in m3 required to deliver 1000 m3 of free air at 21°C (70°F) | % KW savings or increase relative to 21°C (70°F) intake | |
| °C | °F | ||
| −1 | 30 | 925 | 7.5% Savings |
| 5 | 40 | 943 | 5.7% Savings |
| 10 | 50 | 962 | 3.8% Savings |
| 16 | 60 | 981 | 1.9% Savings |
| 21 | 70 | 1000 | 0 |
| 27 | 80 | 1020 | 1.9% Increase |
| 32 | 90 | 1040 | 3.8% Increase |
| 37 | 100 | 1060 | 5.7% Increase |
| 43 | 110 | 1080 | 7.6% Increase |
| 49 | 120 | 1100 | 9.5% Increase |

The pressure of a compressed air system is dictated by the pressure requirements of equipment on the system. Significant savings, in the range of 10–20%, can be obtained by reducing the operating pressure of the compressed air system. Leaks reduce system pressure and result in longer compressor operating hours, so repairing leaks will permit system pressure to be maintained with less compressor power. In a large plant, various types of equipment will have different pressure requirements. The typical approach is to provide a compressor that can meet the highest pressure required (see Figure 11.8 for a photograph of a compressor).

An alternative approach is to segregate the load by maximum pressure. The low pressure loads can be served by one compressor, while the high-pressure loads are served by another.
In multicompressor systems, control strategies can go a long way in improving efficiency. Sequencing controls optimize operation of compressors to match loads most efficiency. VSDs can also help compressors meet variable loads more efficiently, especially compared to fixed speed rotary screw compressors that operate in either full load or idle mode. Compressors still use energy when idling even though they aren’t serving any loads!
Obviously, leaks represent a real and often substantial loss of energy. It is common for leakage rates in a compressed air system to be in the range of 2–20% of system capacity. Compressed air is an expensive energy form. Efforts should be undertaken to eliminate all leaks. Compressed air leaks can occur in piping, valves, fittings, flanges, hose, traps, and filters. A good test is to shut down all equipment that uses compressed air (e.g., on the weekend). Then measure the amount of compressor operation and search for leaks. Air lost through leaks represents energy expended to maintain the system pressure. Tag the leaks and repair them immediately.
Example. Leak repair. Repairing a 9.5-mm (3/8-in) diameter hole in a 793-kPa (115-psi) system operated for 8520 hours per year would avoid an energy loss of about 392,000 kWh per year. A leak of that size corresponds to a leak rate of about 7.4 m3/min.
It is also important to minimize or eliminate unnecessary uses of compressed air. Where feasible, use blowers or air knifes since they use less energy. Train staff to use compressed air only when needed, and not for tasks such as cleaning off work surfaces, floors, or clothing.
Heat recovery is another possibility with compressed air systems. Compressors are either air-cooled or water-cooled. Heat recovery may not be economical with small air-cooled units. However, larger units, especially water-cooled ones, should be reviewed for heat recovery opportunities, particularly if a cooling tower is being used to reject waste heat.
Example. Compressed air heat recovery. A large aircraft equipment manufacturing plant used electricity, natural gas, and compressed air as major energy forms. Hot water was provided by three natural gas-fired package boilers, one rated at 300 boiler hp and 200 psi, and two rated at 150 boiler hp and 165 psi. (Note: in U.S. and British usage, 1 boiler hp=9.81 kW.) The plant also had five large air compressors totaling 16,000 hp, three of which were rated at 4600 hp while the other two were rated at 1500 hp and 700 hp. Either the 300 hp boiler or the two 150 hp boilers with a combination of the compressors were operated 24 hours per day, providing heat for the cafeteria, various processes and heat exchangers, and for building heating. The 24-h average heat load of the boilers was 4.7 GJ/h. A study was made to determine if heat recovery from the air compressors could reduce natural gas usage in the boilers.
The three large three-stage reciprocating compressors were considered for this purpose. These compressors had water-cooled interstage heat exchangers. Cooling water was conducted to a cooling tower where the heat was discharged to the atmosphere. Typically, two out of three of these compressors operated, with the load varying between 75% and 100% of full load. Under these conditions, measurements indicated that 3.7 GJ/h of heat could be recovered at temperatures above 65°C (150°F). On average, the recovered heat from the compressors could provide about 80% of the boiler heat. If one compressor operated at full load, all the heat could be provided. The principal difficulty was the fact that compressor operations do not always coincide with the peak heating requirement. Thus, in reality it would be difficult to meet all the needs without adding some form of energy storage. A more reasonable proposition would be to supply 50% of the heat required based on the observed compressor operation. This could be accomplished by adding several heat exchangers and a small amount piping. In this facility, it was convenient that the air compressors and boilers were adjacent to each other in the same building. The payback for these modifications (based on the natural gas savings at current costs) was estimated to be less than 1 year. The estimate did not include additional savings that would accrue from modifying cooling tower operation. The plant had four cooling towers, each with 40 hp fans and 9 cooling water pumps totaling 450 hp. Eliminating the use of one cooling tower would result in additional savings that were not considered in the analysis.
The U.S. Department of Energy has a variety of resources for analyzing and improving compressed air efficiency (http://www.energy.gov/eere/amo/compressed-air-systems).
Manufacturing Processes13
In manufacturing processes, there are two forms of energy to consider. The first is the direct energy required to carry out the process. The second is the indirect energy embodied in the material being processed.
Consider a chemical processing plant producing a product involving several stages of processing. Spillage or waste of raw materials at an intermediate processing step constitutes an energy waste in a very real sense of the word. Even discharged cooling water is a waste not only because of any heat it may carry but also because of the energy expended to pump, filter, and chemically treat it.
The following typify the broad range of EMOs to be encountered in manufacturing operations:
• In machining, eliminate unnecessary operations and reduce scrap.
• Use computer numerically controlled machine tools (Figure 11.9).
• Substitute powder metallurgy for machining operations (use induction furnace).
• Size the tool, the feed rate, the depth of cut, and the motor to the job.
• Carefully review hardening requirements. Carburizing is energy intensive; induction heating less so, plating, metalizing, flame spraying or cladding still less. Select the method that does an adequate job most efficiently.
• Substitute cold forging for hot if possible.
• Avoid overdesign that requires excessive use of energy-intensive materials.
• Design products to permit recovery of energy-intensive materials or components.
• Control air usage in paint spray booths. Exhaust air carries away heat.
• Evaluate paints and coatings. Solvent-based paints are less energy intensive than plating; water-based paints still less. Powder coating has the advantage of not requiring a liquid solvent.
• Improve plating efficiency by reducing heat losses from tanks, and by improving rectifier performance, checking cables and conductors, and modifying controls.
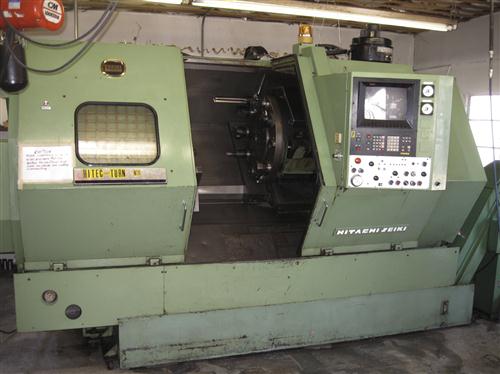
Agriculture and Food Processes
Modern agriculture is both a user of energy and a producer of fuels. In the post-World War II period, there has been a sharp decline in the number of family-owned and operated farms in the industrialized nations. Commensurately, the use of on-farm energy has increased dramatically. Sharp increases in farm yields per hectare (acre) have resulted. Today, many farms are both energy users and fuel producers. In addition, energy use in agriculture is both direct and indirect.
Direct Uses
• Heat and light in barns, greenhouses, livestock and poultry enclosures.
• Mechanized equipment, tractors, engine driven pumps, harvesters, etc.
Electricity and natural gas are the primary energy forms for the first two categories, while diesel and gasoline fuels are the primary energy sources for mechanized equipment.
Farm building energy uses are primarily heating, cooling, and ventilation, lighting, and processes. On-farm energy use is ubiquitous, ranging from electrically powered milking machines to heating of poultry brooders to maintaining illumination levels that stimulate egg laying. Refrigeration is also important, especially in dairy operations. Many of the energy management principles discussed in Chapters 8 and 9 and elsewhere in the current chapter are equally applicable in the agricultural sector. Some of the principles discussed in Chapter 10 can be considered for on-farm vehicles as well as for vehicles used to transport materials and products to and from farms.
Pumping and irrigation are important in arid areas where rainfall is inadequate for crop production. Many new technologies have emerged to improve pumping efficiency and to reduce water loss by evaporation, including drip irrigation rather than sprinklers.
In responding to higher fuel prices, studies show that farmers keep farm equipment engines serviced and tuned to improve fuel economy. In addition, they reduce the number of trips over fields for tilling, planting, and harvesting through the use advanced technology (global positioning satellites and mapping). These techniques, along with soil testing and surveys by aircraft or drones, enable more precise irrigation and fertilization of crop lands.
Indirect Uses
The greatly increased productivity of modern agriculture is due in part to indirect energy uses, of which fertilizers and pesticides are the most important. During the decade 2001–2011, U.S. farms energy input (direct and indirect) totaled approximately 1.8×10⁹ GJ/year (1700×1012 Btu/year). Fuel accounted for about 35% of this total, fertilizers about 30%, electricity about 25%, pesticides about 6%, and miscellaneous about 4%.14
Note: These relative quantities varied from year-to-year, largely in concert with the increase or decrease of the price of oil and natural gas, but overall the total usage was relatively constant at 1.8×10⁹ GJ/year plus or minus 5% or so. It should be noted that natural gas is an important component in fertilizer production.
On-Farm Energy Production
Farms are slowly increasing their use of renewable energy sources, primarily solar energy and wind power. In the U.S., less than 2% of farms report onsite renewable energy generation.15
What has changed dramatically in the U.S. is the growing of corn for ethanol production and soybean oil for biodiesel production. Brazil was an early pioneer in the biofuels field producing ethanol from sugarcane as early as the 1930s, and then substantially expanding production during WWII.
Anaerobic digestion is another growing area of on-farm energy recovery and production. In livestock production, anaerobic digestion of animal residuals (manure) reduces nutrient levels and the overall manure volume to the point where the manure can be applied to land. The digester gases resulting from the process are considered a biofuel (methane) and can be used directly for applications such as heating; alternatively, they can be used to generate electricity.
Food Processing
Farm products must be moved quickly and efficiently to processing plants or markets to prevent waste or spoilage. High value crops such as tropical fruits may be moved by air, sea, or in refrigerated trucks. Food processing encompasses slaughter houses, meat packing plants, canneries, grain milling, freezing, bakeries, and dairy products. Food processing is an extremely diverse sector of industry that makes use of process heat for cooking and preserving foods, refrigeration for freezing and cold storage, and many mechanical processes for cleaning, trimming, and packaging.
Many of the energy management options discussed elsewhere in this chapter are equally applicable to food processing operations.
Energy Storage for Process Industries
Energy storage is an old concept. An early application was pumped storage, where water was pumped from a low reservoir to a higher one at night, and allowed to flow back during the day to generate electricity during peak hours. Batteries are another well-known method for storing energy. Experiments have been done to store energy as high pressure air underground or using high speed fly wheels.
For process industries, energy storage provides an important tool for the energy manager in efforts to increase overall process efficiency. Much of the waste of energy that occurs in processes takes place in the form of waste heat that is rejected to the atmosphere either directly from the process or indirectly via heat exchangers, cooling towers, stacks, and so on. There are a number of technologies available that permit energy storage at high and low temperatures. These processes will permit a better overall use of energy resources and can also help reduce the peak demand for certain energy forms, particularly electricity.
In the broadest sense, the quantity of energy stored in any media consists of four components: the sensible heat of the material in its solid and liquid phases, the latent heat of phase change, and any heat associated with chemical reactions.
Energy storage at high temperatures has been used for many years in industry. The metallurgical industries and their use of refractories is one example. The range of technologies that can be considered may be classified by operating temperature:
Solids: Packed beds, fluidized solids (100–1500°C)
Liquids: Hot water, organics, liquid metals, molten salts (200–800°C)
Solid/liquid phase change materials: Salts, metals (120–1400°C)
Due to the wide variety of thermal energy use in processes, it is not possible to provide specific guidelines. However, in addition to the metallurgical industries, there have been many applications in food processing, clay and ceramics manufacturing, and industries using steam, such as paper, and textiles. The special case of building heating and cooling is discussed in Chapter 8. Chapter 12 describes other options for thermal and electrical energy storage in integrated building designs.
Process Control
Control of industrial processes is an important determinant of energy efficiency. We’ve already seen how control of boilers, pumps, fan, and compressed air systems has a critical impact on energy efficiency. The same is true of a variety of other process controls.
In the original concept, process controls were designed to accomplish one or more of the following:
• Maximize production throughput.
• Provide safety for equipment or personnel.
Except for the most energy-intensive industries such as aluminum or cement production, the efficient use of energy for many years was a secondary concern, since its value was much less than the value of the final product, or of the labor that went into making the product. Today the situation is different.
Now the optimization of process controls to use energy efficiently is essential. Many new types of controls and methods have been developed to do this. Some examples include simple timers, sensors, feedback devices, meters, programmable logic controllers (PLC), microprocessors, large-scale numerically controlled equipment, distributed control systems (DCS), supervisory control and data acquisition (SCADA) systems, programmable automation controllers (PAC), and web-based facility automation systems. These technologies and control strategies often overlap. As the sophistication of process controls has increased, so have their costs. The increased cost of controls has generally been more than offset by savings of rising energy and labor costs.16
Improved process controls save energy by reducing downtime and speeding up production. Often this requires improved instrumentation to sense, monitor, and measure process parameters. With the rapid development and advances in microprocessors, “intelligent” controls are now widely found in industry. These advanced devices can sense changing conditions (such as tolerance variations as a tool wears) and adjust the process to accommodate the changed circumstances. Numerically controlled machines can optimize part layout and manufacturing, minimizing scrap and waste of materials.
Example. Optimal scheduling. Process heat is a major source of industrial energy use. Industrial heating operations such as baking, tempering, annealing, and drying can use more energy in start-up, preheating, and standby time than is actually used in making the product. The simple act of optimal scheduling—i.e., planning production so the equipment is used as long as possible once started up—can materially reduce energy costs.
Conclusions
Process energy—especially in industry—is a vital application of energy resources. Industrial processes are responsible for food preservation, clothing, pharmaceuticals, furniture, vehicles, and many other products that have improved the standard of living. Industrial processes also represent extremely diverse uses of energy, ranging from simple heating to the complex operations required to form, shape, and weld metals. Great improvements in industrial energy use efficiency have been made in the last three decades. Specific energy use—i.e., the energy required to produce a unit of any industrial product—has declined in every sector. With rising energy costs, that means more goods can be produced with less energy expense. More significant, it also means that less CO2 is produced per unit of production.
There are still areas for substantial improvements in process energy use efficiency. Studies of “best available technology” indicate there is a gap between the average energy use required to make specific products and the most efficient application. This gap represents an opportunity for improvement and further reduction of industrial energy use. New processes, better controls, and more efficient types of equipment are available to improve energy use efficiency.