
Building and Site Energy Audits
Abstract
Building and site energy audits are one of the most important tools available to the energy manager. Audits reveal inefficiencies and energy wastage that can lead to significant savings on fuel and energy purchases. Detailed procedures for a site or complex with multiple buildings, or for an individual building, are described with examples. Typical procedures for recording and analyzing audit data are given. Instrumentation and metering methods are described. There are checklists for potential energy management opportunities.
Keywords
Energy audit; site audit; historical data; metering; audit instrumentation; lighting systems; HVAC; building envelope; steam systems; water systems
Introduction
An energy audit, like most other engineering activities, benefits from professional judgment and experience. Audits can provide important guidelines to the energy manager and insight in the major areas of energy use, if properly performed. An audit can even lead to immediate savings in some cases, simply by making people aware of how much energy is being used. For example, it is not uncommon for audits to reveal lights that remain on 24 h a day, controls that no longer function as intended, leaks and misuse of compressed air, or fans that operate around the clock.
More important, however, is insight that an audit provides into how and where major quantities of energy are being used and possibly misused. The energy manager can then draw upon this information to guide the formulation of the energy management program and establish where to place priorities.
Suppose a cursory walk-through of a warehouse revealed more than one hundred 100-watt lamp fixtures, a few small appliances, and a 130-hp (100 kW) fan motor. At first glance it is clear the auditor should not devote much of his or her resources to “counting light bulbs,” since these would account for less than 10% of the installed load. It would be more useful to focus immediately on the fan, where 10% improvement in efficiency would lead to savings equal to the entire lighting load. The energy management plan could then include a lighting upgrade during a future phase if deemed cost-effective.
No textbook can provide answers for every situation. Our point here is that the auditor must develop the ability to stand back and look at the overall situation and to avoid getting mired down in the details.
General Methodology
The general methodology of an energy audit consists of assessing all building and site energy and utility systems to determine and document the following:
• Energy entering the site or building.
• Energy generated on the site or in the building.
• Energy distributed on the site or in the building.
• Energy used on the site or in the building.
• Energy leaving the site or building.
• Site-wide waste energy collected, treated, and/or discharged on-site.
• Site-wide waste energy recirculated or otherwise reused on-site.
Typical energy and utility systems include electricity, fuel oil, natural gas, LPG, coal, steam, chilled water, hot water, compressed air, and potable water supply. In some cases, sites may use other energy forms such as solar, wind, or various types of biofuel.
Waste streams and waste energy considered include the following:
• Solid wastes—dry combustible (paper, sawdust etc.), wet combustible (garbage), dry noncombustible (coal ash), and wet noncombustible (sewage sludge).
In general, a facility will consist of a site occupied by one or more buildings, as sketched in Figure 6.1. Energy enters the site in the form of purchased fuels or utilities, and is transformed, converted, and distributed among the various buildings on the site. Within the buildings, people and systems perform operations that lead to useful products or services. The systems enabling the operations are called energy end-uses.
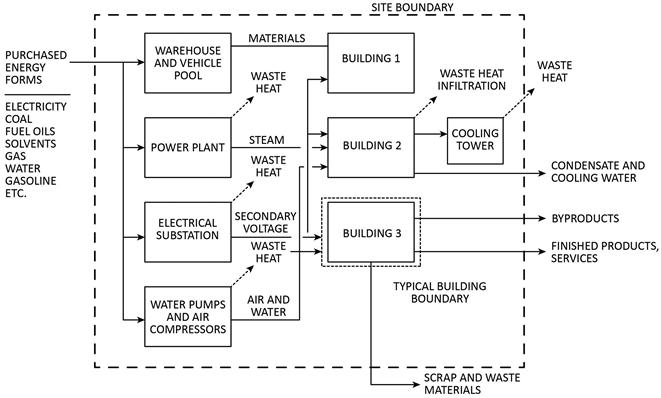
Outputs from the site include the useful products or services, any by-products, waste (that may or may not contain energy in some form), and wasted or dissipated energy.
Now suppose we draw a hypothetical boundary around the site, as indicated in Figure 6.1. (Imagine this boundary is like a site fence or wall.) Equation 6.1 summarizes the energy balance at the site boundary:
[6.1]
Ei = sum of input energy forms (primary voltage electricity, fuels, etc.) less any energy in storage
Ebi = sum of energy used in building number i (end-uses plus losses)
Ep = energy leaving site (in products, transfers, or other forms not included in Eb)
EL = energy losses from site, excluding the losses from buildings (waste heat from cooling towers, steam line losses, transformer losses, condensate, etc.)
Equation 6.2 shows a similar energy balance equation for Eb for the ith building, which sums all the energy entering and leaving a hypothetical building boundary (say the building envelope):
[6.2]
Eui = sum of energy end uses within building i (heating, cooling, lighting, process, office, domestic)
ECLi = sum of energy conversion losses for building i (motor losses, transformer losses, etc.)
There are several advantages to using the energy balance approach described by Equations 6.1 and 6.2. First, the site energy input is usually available from records (utility bills, fuel purchase invoices, etc.). Thus, it is easy to obtain the total energy input. As described in Chapter 4, the energy manager can sum these historical data (along with total cost) and then use them to check against the results of the site audit. For example, the total of the building audit results plus any site losses or outputs minus any recovered energy should equal the site input. If a preliminary check shows this not to be true, it could indicate that a building has been overlooked, losses underestimated, or certain processes have not been included. This provides a useful check on the audit process.
A very important feature of the site audit is that it may reveal energy management opportunities that would not be apparent from building audits alone. For example, in an audit of a large government research facility, auditors found that a significant volume of water was pumped under high pressure from one area to another. The site audit flagged this practice and indicated the need for further investigation. Auditors subsequently determined that the reason was to provide a pressure suitable for fire protection in a small outlying building. The energy efficient alternative proposed was to use a small booster pump to provide the required pressure, permitting a reduction in the pipeline pressure and substantial energy savings. Building audits alone would not have uncovered this opportunity.
In the limited case of a single building, the site audit may be unnecessary, since the only “site” energy use may simply be the exterior lighting area.
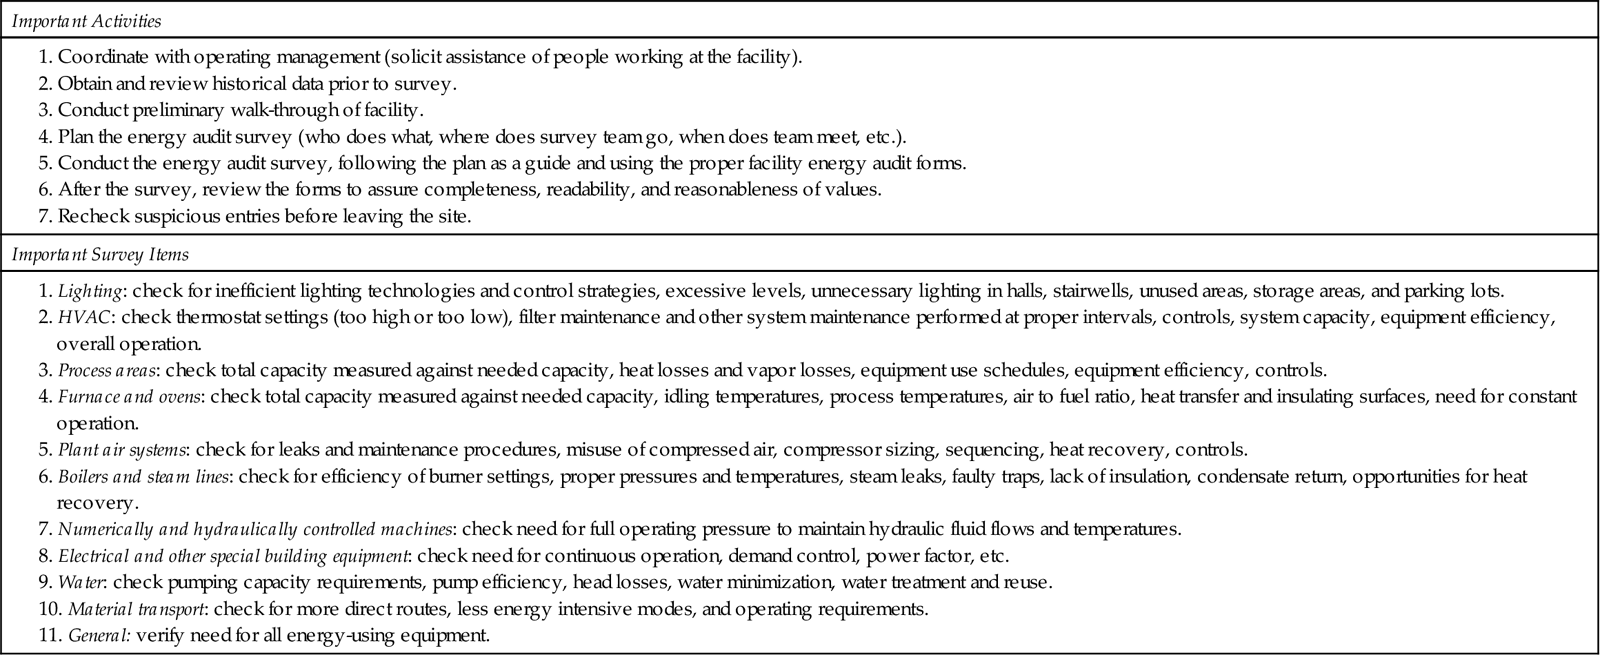
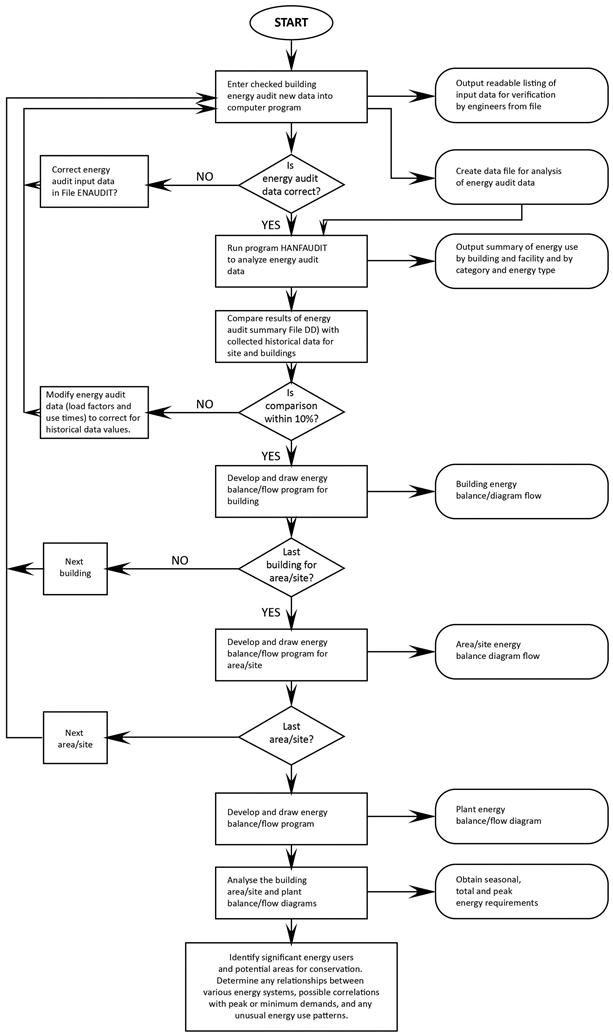
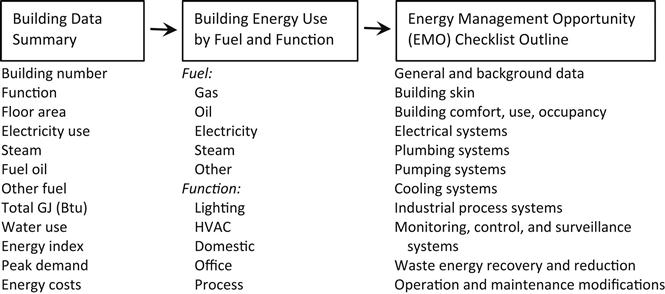
Because of the importance attached to site and building audits as part of an energy management program, the sections below describe approaches for each in greater detail. In addition, Table 6.1 summarizes general principles for site and building audits, and Figure 6.2 is a flowchart of the overall process for entering and analyzing building and site audit data.
Table 6.1
Principles of site and building audits
Site Audits
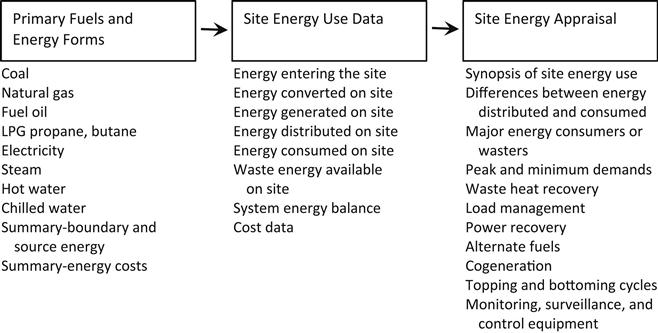
Figure 6.3 illustrates a site audit methodology. The first step is to identify all the possible site energy forms, and then obtain historical data on their annual use and cost. It is usually convenient to convert them to a consistent set of units (MJ or GJ per month or year) although the physical units (liters, kilograms, cubic meters) could also be used (see Appendices for conversion factors).
The second step is to obtain or prepare simplified site plans that show the location of each building, substations, transmission lines, steam lines, water lines, etc. This information helps establish how and where the various energy forms are used at the site. Some specific suggestions follow.
Electricity
Electricity generated from power plants is stepped up to very high voltages (hundreds of kilovolts (kV)) for long distance transmission. Distribution substations then use transformers to lower the voltage to a medium range to carry the electricity to transformers near customers. This medium voltage power is considered the primary distribution level and has voltages in the range of a few to several dozen kV depending on the distribution system. At the customer site, the electricity is transformed again to secondary voltages (e.g., 480 V/240 V in the U.S., 380 V/220 V in Europe, etc.) for powering end-use systems. Figure 6.4 shows an example of how the voltage transforms from the transmission system to the primary distribution system and finally to the secondary distribution systems serving end-users, illustrating the energy losses incurred along the way. This example is from a large government research facility.
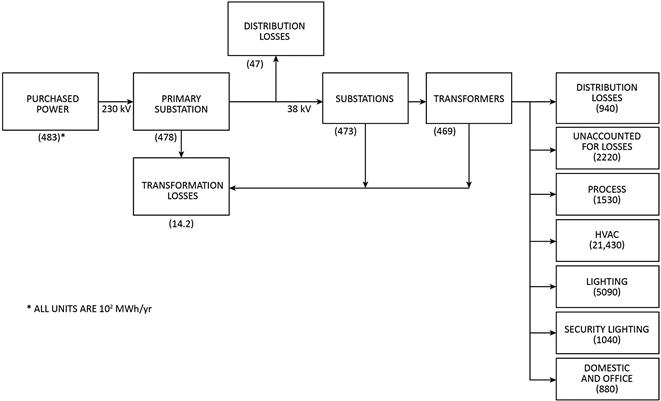
For large sites, where customers connect at the primary distribution level, incoming electrical energy will equal the sum of end uses (lighting, power, heating) plus transformation and distribution losses associated with stepping the voltage down and distributing the electricity to the buildings at the site. If a master meter and sub-meters are available, an energy auditor can identify the losses directly. If not, they can be measured or estimated from manufacturer’s data (for transformers) and calculated for distribution lines. As a rough guide, transformer losses are typically less than 1% and distribution losses will typically be less than 5%. Chapter 7 discusses methods for calculating electrical loads and losses in more detail.
For most sites, customers connect to the secondary distribution lines, so the transmission and distribution losses incur on the utility’s side of the meter and do not need to be included in the site energy balance.
Steam
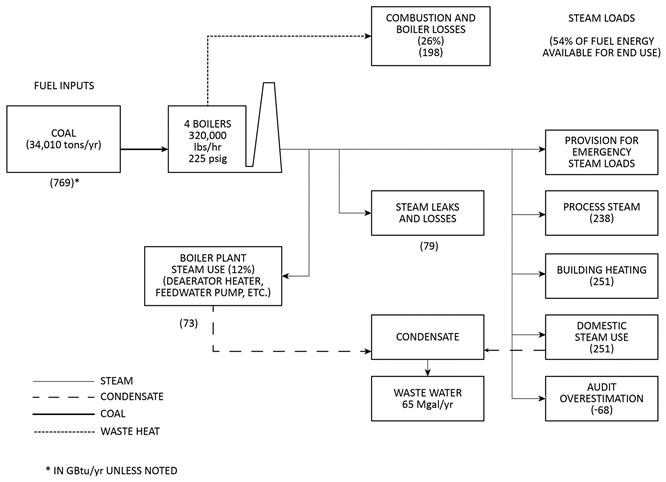
Steam may be generated in central boilers and distributed throughout a site, or may be generated locally. Normally there are boiler fuel input records and steam meters that permit direct assessment of steam generation efficiency. If not, boiler efficiency can be measured. Other sources of energy loss in steam systems are line losses, trap losses, and condensate losses. Figure 6.5 show a typical site steam audit.
Water, Compressed Air, and Other Utilities
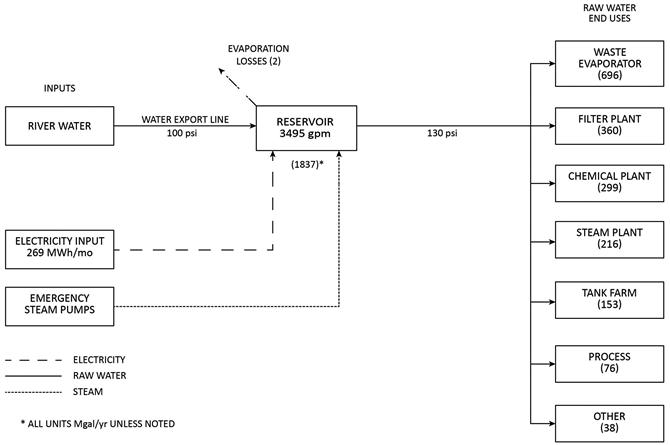
Except for water, it is not common to find meters for these utilities. However, the approach for site audits of these energy forms is similar to that described above. Use meter data if available. If not, install temporary metering to measure water or air flow under typical operating conditions or make engineering estimates. The important aspects are to (i) account for all energy forms and (ii) determine the losses. Figure 6.6 shows a typical site audit for a water distribution system serving a large area.
Summary
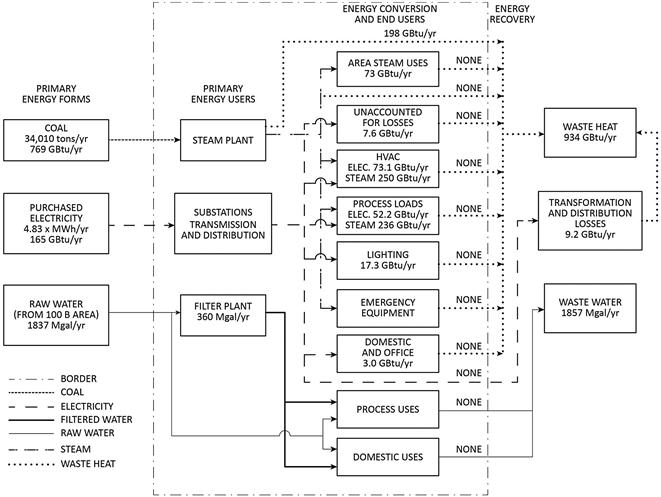
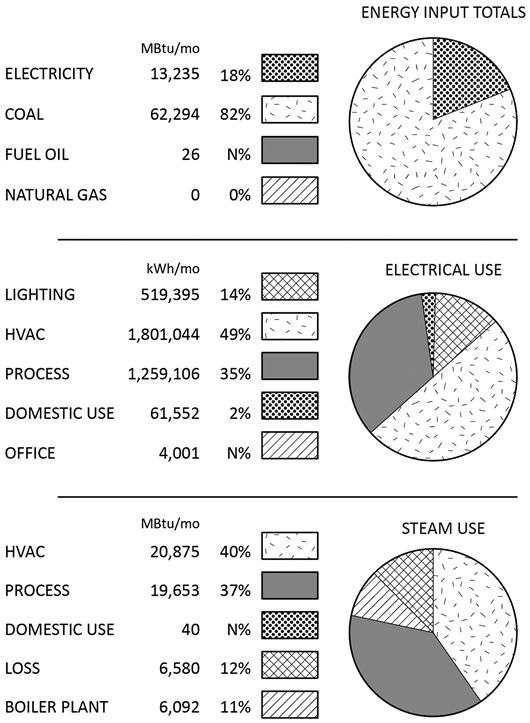
After completing individual site audits, the next step is to total each energy form and compare with the historical records. This comparison provides a final check on the site audit accuracy. A summary sheet also provides a composite view of energy losses, permitting evaluation of the overall site efficiency. Figure 6.7 shows an example of a site audit summary sheet. It is also useful to present the data in pie charts to show the relative shares of fuels used on site as well as to illustrate the breakdown by end-use system for each energy source (see Figure 6.8).
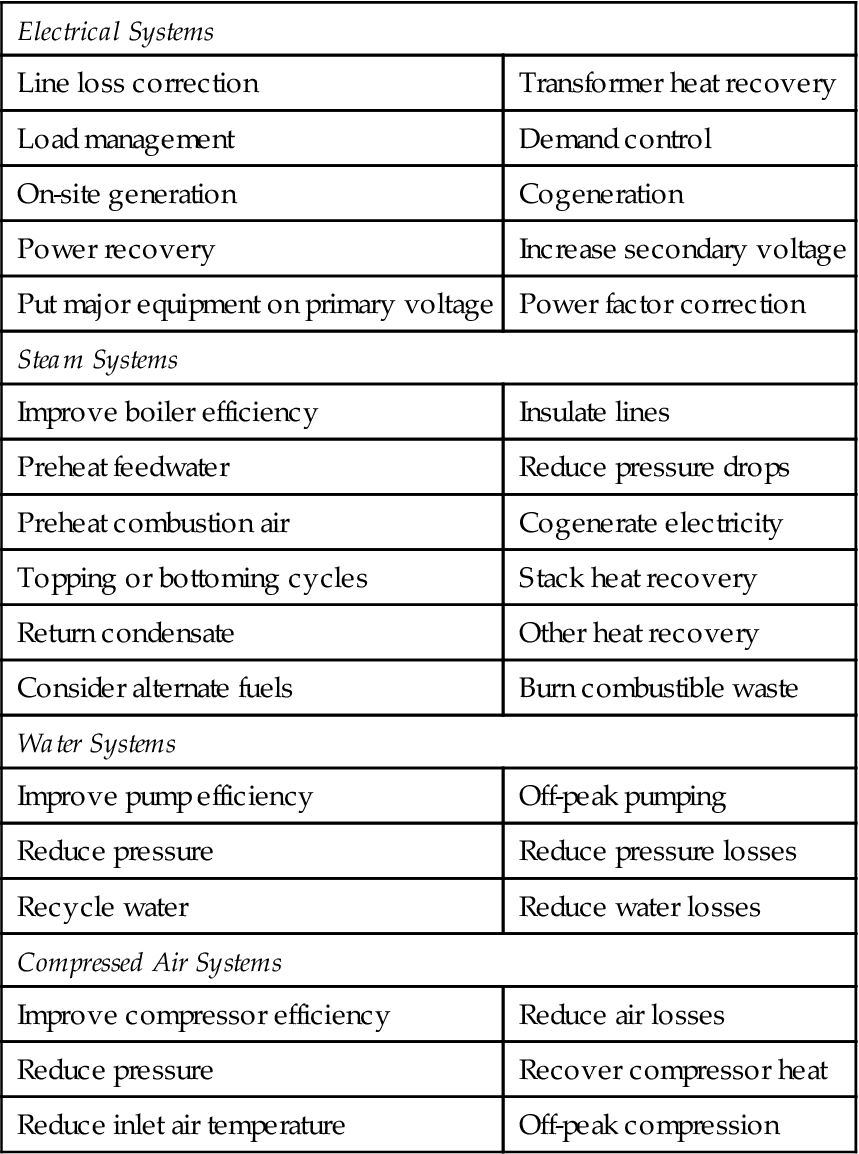
Energy management opportunities resulting from site audits cover a wide range of possibilities. As a preliminary guide, Table 6.2 provides a checklist of items to consider. This list is not all-inclusive but should provide a starting point for consideration.
Table 6.2
Site audit energy management opportunity checklist
| Electrical Systems | |
| Line loss correction | Transformer heat recovery |
| Load management | Demand control |
| On-site generation | Cogeneration |
| Power recovery | Increase secondary voltage |
| Put major equipment on primary voltage | Power factor correction |
| Steam Systems | |
| Improve boiler efficiency | Insulate lines |
| Preheat feedwater | Reduce pressure drops |
| Preheat combustion air | Cogenerate electricity |
| Topping or bottoming cycles | Stack heat recovery |
| Return condensate | Other heat recovery |
| Consider alternate fuels | Burn combustible waste |
| Water Systems | |
| Improve pump efficiency | Off-peak pumping |
| Reduce pressure | Reduce pressure losses |
| Recycle water | Reduce water losses |
| Compressed Air Systems | |
| Improve compressor efficiency | Reduce air losses |
| Reduce pressure | Recover compressor heat |
| Reduce inlet air temperature | Off-peak compression |
Building Audits
Figure 6.9 illustrates a methodology for conducting the building audit. The overall process may be subdivided into five steps:
• Compile historical energy use.
• Conduct building walk-through.
• Perform building audit—building envelope, lighting, HVAC, process equipment, or other special system assessments.
Chapter 4 already described the steps necessary to compile historical energy use. If the building has meters, collect the meter data for later use as a check on the building audit results.
A building walk-through is useful as a prelude to conducting the energy audit. The walk-through permits the audit team to become acquainted with the facility and is particularly important if members of the team are not facility employees. It can also be used to divide up the areas to be audited and is an opportunity to determine what instrumentation or special equipment will be needed to conduct the audit. If the building houses special processes or process equipment, arrange for the plant manager or process engineer to provide a briefing for the audit team.
The audit team should include the expertise necessary to perform the work. A team and its responsibilities might be constituted as follows: an architect, with responsibility for the building envelope; a mechanical engineer, for HVAC and processes; and an electrical engineer, for lighting and electrical loads. Other team members such as chemical engineers or process specialists may be added as needed. However, in many cases, a team comprising two or three engineers with energy efficiency training is sufficient.
Building audits should attempt to measure when and where all energy forms are used in the facilities and should also attempt to correlate the data with building use and occupancy patterns, weather conditions, site functions, number of shifts, and so forth. Building audits can help identify specific areas where there are opportunities for energy efficiency improvements and cost savings.
Examples of measurement to take during an energy audit include the following:
• Measure lighting intensity and room temperature at various points throughout the facility and over several daily cycles.
• Measure static pressure profiles in ducts and across heat exchange equipment.
• Monitor large electrical equipment to determine variations in the power factor and variations in load and use factors.
The composite of these measurements gives a rough picture of the facility’s energy duty cycle and reveals inefficient equipment or applications. Investigating the transfer of various forms of energy and products between buildings, on a site level, and correlating this information with historical energy use, often reveals new possibilities for energy savings (by combining or eliminating multibuilding energy use).
Knowledge of the energy duty cycle is especially useful in those large industrial and research laboratory structures where the internal climate and circulation patterns must be maintained to meet safety or quality control requirements. Building simulation programs can be used to experiment with alternative energy duty cycles for the facility systems and to make optimal choices for the building HVAC system and processes before subjecting the operation and facility to specific changes (see Chapter 8).
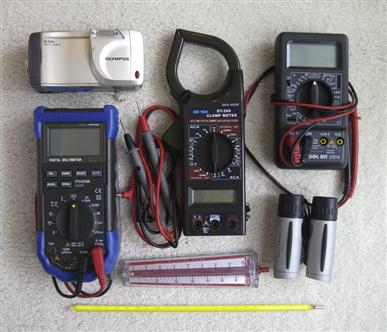
Instrumentation for energy audits ranges from very simple to complex. Figure 6.10 shows a basic group of instruments that can be purchased for a few hundred dollars. Pictured are a volt–amp meter, a digital clamp-on ammeter, a sound/light meter with a digital temperature probe, a thermometer, air velocity gage, digital camera, and binoculars. These instruments and tools facilitate reading of equipment labels and simple confirming measurements (illumination levels, temperatures, air velocities, etc.). They permit gross measurements which can be used to evaluate the need for (and benefit of) more detailed measurements.
Measurements and field audits (of both buildings and sites) are essential to the energy management process. The energy audit team should not accept any individual’s word concerning energy use anywhere. Instead, they should make an independent appraisal, bringing to bear their unique expertise. In addition, the energy auditors should not necessarily believe what is shown in drawings and blueprints. Even “as-built” drawings are quickly out of date. The modifications made by maintenance personnel “to keep things running” somehow never get back into the drawings, and often thwart the actual purpose of the new “advanced energy management control system” that someone installed last year.
Of course, measurements can be overdone. Engineers are well known for collecting more data than can ever be analyzed economically. Similarly, measurements should be limited to those parameters that will lead to useful information.
For example, the U.S. Government at one time issued several “requests for proposals” to conduct energy audits on military facilities. One of the required tasks involved measurement (under load) of all electric motors with ratings more than a few horsepower. The objective of this task was to discover motor inefficiencies. Yet to an experienced observer, the results were obvious without expensive monitoring, although confirming measurements on a selected sample of motors might have been justified. These motors (that were part of many small air handlers and pumps) were all lightly loaded, and were operating with reduced efficiency and low power factor. A simple calculation also showed that the small savings that would result would not alone justify replacing these motors with properly sized motors. Why make measurements that would lead to obvious conclusions and no implementation? This was a case where it would have been more efficient to correct some of the fundamental deficiencies in these facilities, obtaining 80% of the energy savings at 20–30% of the cost of trying to do everything. Then, the energy management plan could include a stipulation to replace the inefficient motors upon failure, which would be cost-effective.
If more detailed measurements are justified, instrumentation costs increase rapidly, ranging from a few thousand dollars for a set of specific instruments to hundreds of thousands of dollars for a sophisticated field data acquisition systems. More detailed measurements might include those listed in Table 6.3.
Table 6.3
Examples of equipment for detailed audit measurements
Electric Power
Recording ammeters and volt meters
Demand meters
Power factor meters
Watthour meters
Data logger system
Thermal Measurements
Heat flux meters
IR scanners or thermometers
Recording thermographs
Digital thermometers
Combustion or flue gas analyzers
Psychrometers
Condensate meters
Mechanical Measurements
Load cells
LVDTs, velocity transducers, accelerometers
Tachometers
Flow Measurements
Airflow and velocity gauges
Manometers and pressure gages
Water flow meters
In carrying out building audits, the most convenient approach is to use data sheets that have been prepared in advance and loaded onto laptop computers or tablets. The data can then be entered and processed digitally, eliminating the manual entry step required with paper audit forms. In this format, the data can also be readily uploaded to a central location for further analysis and review by other team members as well as for preparation of special reports.
The literature contains as many different forms for data entry as there are authors. Figure 6.11 shows an example of a simple form for entering data. It is sometimes desirable to tailor data entry forms to the needs of a specific audit scope or for each type of end-use. For example, in cases where HVAC accounts for a considerable share of facility energy use, it is useful to compile information about the building envelope as well as details about the HVAC equipment and control strategies. In contrast, for an industrial facility, it is more important to collect detailed information on furnaces, compressed air, steam, refrigeration, or other types of equipment used in production.
Individual building data collected, or calculated, and utilized would normally include:
• Physical characteristics (floor area, window area, wall area, construction material).
• Building age and expected remaining life.
• Building energy consumption and costs.
• Energy system data (type and capacity of air distribution, heating and cooling equipment, cold and hot air supply temperatures, lighting types and quantity, domestic hot water, process heat and cooling systems, mechanical equipment and motors, other types of production equipment, office equipment).
• Control equipment characteristics (reset temperatures for hot and cold air, humidification, economizer cycle, daylighting controls, variable speed drives, compressed air sequencing, and process equipment settings).
• Heat recovery and rejection approaches.
• Building occupancy data (number of people by shift for typical workdays, weekends, and holiday schedules).
All audit input data should represent the best information economically obtainable within the scope of the audit. Sources include fuel and utility records, meter and sub-meter readings, building energy management systems, supervisory control and data acquisition (SCADA) systems, generation and consumption records, and/or best engineering estimates based on visual observation, temporary metering, calculation, extrapolation, and discussions with the building operation and maintenance staff.
If possible, the data collected and utilized should cover a minimum of twelve recent consecutive months. It may be necessary to make adjustments if the available data period does not represent a typical year, from either climatic or energy usage considerations. Attempt to include total, minimum, and peak monthly qualities as well as typical demand profiles for average and extreme daily variations in the data collected for each energy and utility system.
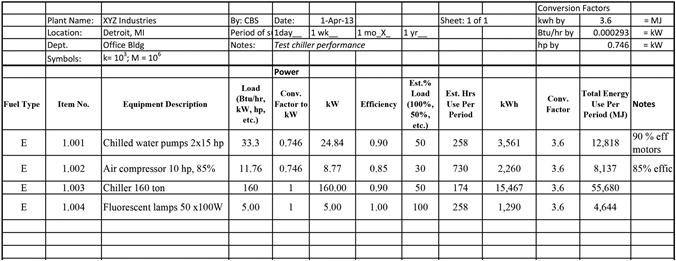
When it comes to gathering data for specific end-uses, the basic approach is first to determine the rated capacity (i.e., useful energy delivered in units of Btu/h, kW, hp, tons of cooling, etc.) and efficiency of the device or system to be able to estimate the required input energy per unit time at rated full load conditions. The second step is to determine the load on the equipment and the factors that affect loading. For some types of equipment (such as nondimmable lamps), the load is 100% when the device is on. For other types of equipment (including motor driven systems), the load is often less than 100% and may vary with weather, production, or other drivers. The third step is to determine the operating hours of the equipment for a representative period of time (day, week, month, or year). Select the time period to agree with the period for which historical or meter data are available. The hours of operation can be established by analysis, observation, or measurement.
With the information gathered during the building audit, the energy use for each item of equipment item can then be computed using methods described in Chapter 7. The calculations are relatively simple for equipment with constant loads, but are often rather complex for systems with loads that vary or for systems that interact with one another.
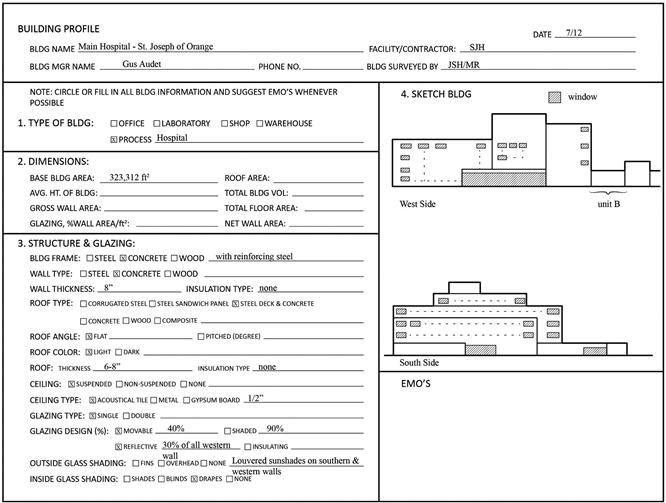
Often it is of interest to examine certain energy uses in greater detail. Heating, ventilation, and air conditioning (HVAC) of buildings frequently fall into this category. In this case additional data on the building envelope is useful, since the building envelope influences heat losses and solar heat gains.
Building heat losses and gains can be evaluated by various computer simulation programs. Figure 6.12 is a “Building Profile Data Sheet” that summarizes much of the information needed for this purpose.
The final steps in the building audit procedure are to summarize building energy use and compare it with historical data, and to compile the major energy management opportunities noted during the audit. One way to present the results is to display them in graphic form on a building summary sheet such as Figure 6.13.
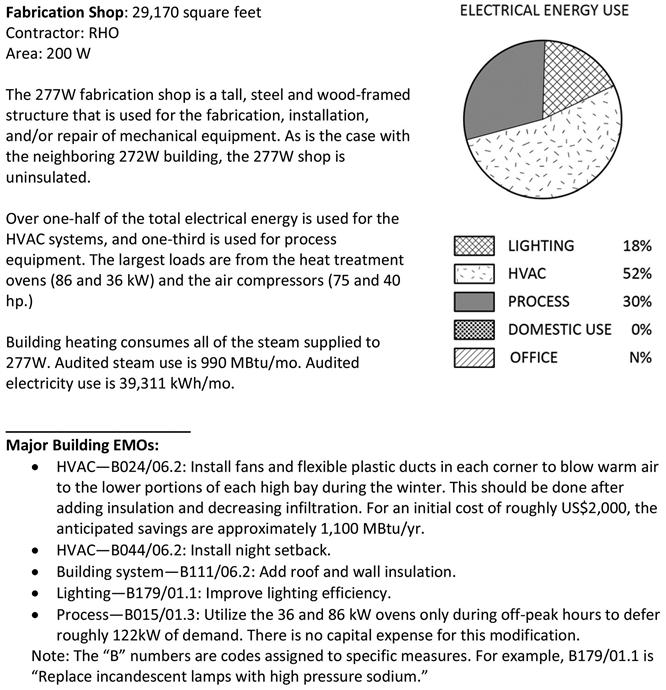
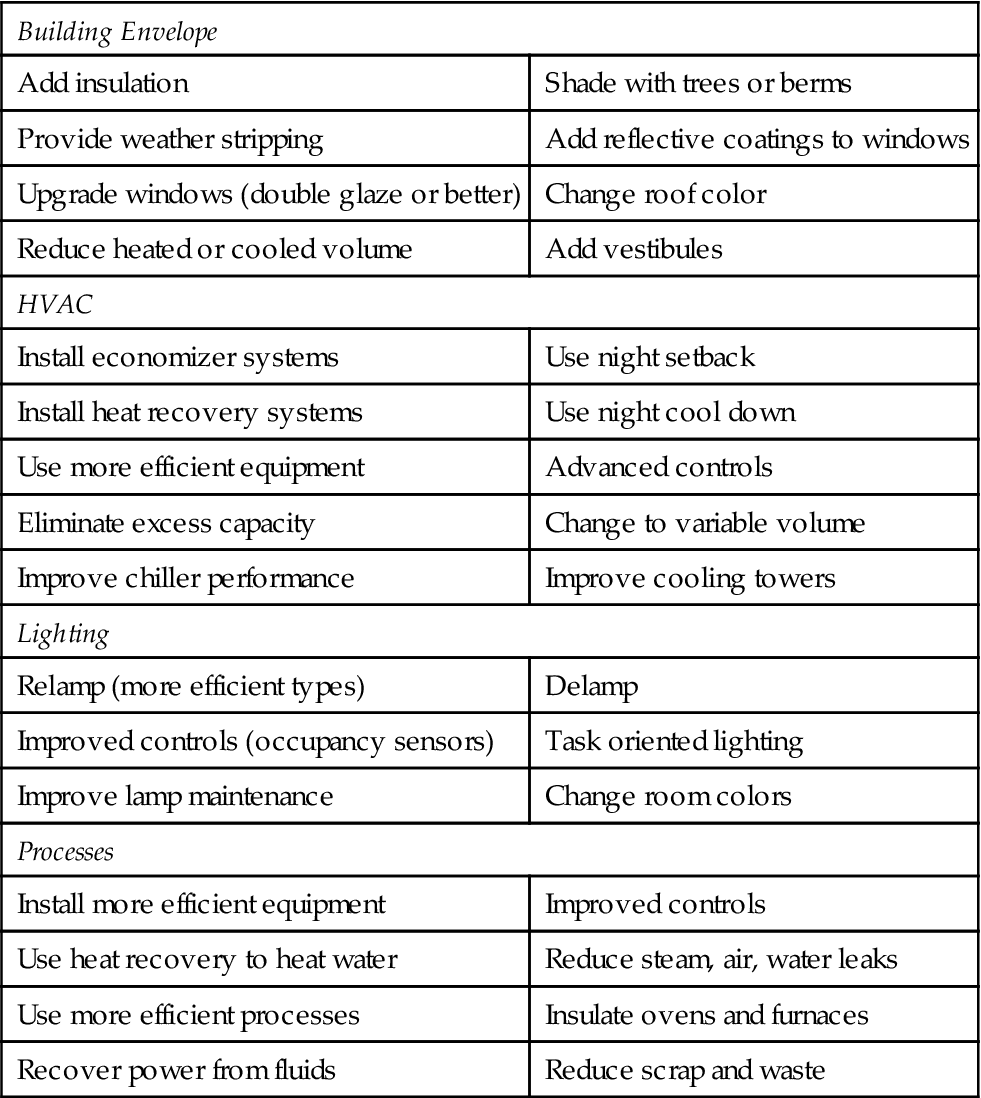
Table 6.4 provides an illustrative checklist of items to consider when developing energy management opportunities. The table divides the opportunities by major building systems. Chapters 8 through 12 discuss these items in greater detail.
Table 6.4
Building audit energy management opportunities
| Building Envelope | |
| Add insulation | Shade with trees or berms |
| Provide weather stripping | Add reflective coatings to windows |
| Upgrade windows (double glaze or better) | Change roof color |
| Reduce heated or cooled volume | Add vestibules |
| HVAC | |
| Install economizer systems | Use night setback |
| Install heat recovery systems | Use night cool down |
| Use more efficient equipment | Advanced controls |
| Eliminate excess capacity | Change to variable volume |
| Improve chiller performance | Improve cooling towers |
| Lighting | |
| Relamp (more efficient types) | Delamp |
| Improved controls (occupancy sensors) | Task oriented lighting |
| Improve lamp maintenance | Change room colors |
| Processes | |
| Install more efficient equipment | Improved controls |
| Use heat recovery to heat water | Reduce steam, air, water leaks |
| Use more efficient processes | Insulate ovens and furnaces |
| Recover power from fluids | Reduce scrap and waste |
Varying Levels of Audits
The appropriate scale of the site or building audit depends on the energy management committee’s goals. If the objective is to make major energy saving capital improvements, the audit and analysis will need to be more rigorous to provide the high degree of confidence needed to justify high capital expenditures. However, if the goal is to do a relative comparison of one building to another (benchmark comparison), the audit and analysis process could be scaled down considerably.
The American Society for Heating, Refrigerating, and Air Conditioning Engineers (ASHRAE) has established three audit levels for commercial buildings:
• ASHRAE Level 1 Audit: Level 1 is a “walk-through” audit that consists of a more cursory review of historical data, a shorter onsite review and assessment of building and energy systems, and identification and preliminary analysis of energy efficiency opportunities. It is a good way to find major problems, to identify low or no-cost measures for immediate implementation, and to point out areas for more targeted assessments.
• ASHRAE Level 2 Audit: Level 2 is a more detailed audit that includes a greater degree of historical data collection and analysis, a longer and more comprehensive site visit with some measurements and data logging, and more thorough energy and financial analysis of identified opportunities to justify their implementation. It is typically the appropriate scale for low-to-medium cost measures.
• ASHRAE Level 3 Audit: Level 3 is a rigorous audit comprising detailed historical review and analysis, more onsite data collection, comprehensive analysis of baselines and energy savings, and detailed financial analysis to justify capital-intensive measures. It often includes modeling of buildings and specific end-use systems.
Oftentimes, the best method is to begin with a Level 1 audit and follow it with a Level 2 or 3 audit. This step-wise process helps convince management of the benefits of the audit process with minimal expenditure for the Level 1 phase. Then, the Level 2 or 3 phases can be used to substantiate analysis for the subset of high priority (i.e., management-approved) capital projects, rather than for the universe of potential measures.
We find an analogous approach works well for industrial facilities. After a preliminary facility walk-through, the next level is to do a “mid-level” audit of the facility, focusing on areas identified during the walkthrough. The mid-level audit includes collecting equipment inventories and nameplate information, taking spot measurements of the energy consuming systems with most promise for improvement, and discussing usage patterns and other energy information with facility and maintenance personnel. Then, the audit team can perform energy savings calculations and cost estimates based on the gathered information and the team’s familiarity with energy efficiency measures and process improvements. This mid-level audit usually does not include detailed assessments of equipment, nor does it include data logging. But, it can be a cost-effective approach for identifying measures and developing reasonable estimates of energy savings, particularly for operation and maintenance improvements and medium cost retrofit measures such as energy efficient lighting and motors and drives.
Capital intensive measures at industrial facilities, such as process improvements and retrofits to support equipment, warrant comprehensive system assessments to validate their cost-effectiveness. Most of the time, the best place to begin is with the systems that support the industrial processes, including compressed air systems, chillers and refrigeration systems, boilers and steam or hot water distribution, and water treatment and disposal systems. This is because the process systems themselves are usually carefully tuned to meet production requirements and optimized for product quality, quantity, reduced down-time, etc., while energy optimization is not likely to be the primary priority. There may be opportunities for energy cost savings through process changes, but these opportunities need careful scrutiny to determine if they are suitable and justified, particularly because the production team may be guarded about changes that affect process equipment. Support systems, on the other hand, often account for the bulk of the energy consumption in an industrial facility and can be improved without changing the core processes. Many times support systems offer significant savings because facility staff have paid less attention to their energy consumption. Comprehensive system assessments typically involve more onsite measurements and data collection, including data logging of energy use and other parameters. They also involve more detailed engineering analysis and modeling to predict energy and financial impacts.
Example. A building and site energy audit of Punahou School in Hawaii.1 The authors directed this detailed audit of an extensive campus comprising grades kindergarten through 12th. As of January 1995, the 76 acre Punahou campus consisted of 53 buildings with a total gross square footage of 628,650. The buildings ranged in age from 2 to 144 years old. Most of the buildings from the late eighteen hundreds and early nineteen hundreds had been renovated in the last forty years.
The scope of the work consisted of the following:
• Preliminary information gathering and planning, including analysis of historical utility data to establish baseline energy use.
• Field data acquisition to review existing conditions, including inventorying equipment, collecting technical information, and identifying end uses.
• Identification, evaluation, and prioritization of specific energy management opportunities.
• Analysis of energy management opportunities with projected savings.
• Economic/financial analysis including utility rebates.
• Development of operations and maintenance procedures and guidelines for renovation and new construction.
• Conceptual design of an energy management and control system to monitor energy use.
• Preparation of a campus-wide implementation plan.
• Additional measures to be implemented as part of a future campus expansion.
At the time of the audit in 1997, Punahou used 7.5 million kilowatt hours per year, with a peak demand of 1800 kW. The electric bill for fiscal year 1996–97 was $790,000, which was over 85% of the total utility costs of $900,000 per year (for water, gas, sewer, and electricity). Electricity usage was primarily for HVAC (52%) and lighting (28%), with other uses accounting for the remaining 20%. The school’s electricity cost was $0.10/kWh.
We first collected data by inventorying equipment in the 50 buildings and facilities, studying building drawings and equipment plans, and interviewing maintenance personnel. The availability of HVAC and lighting inventories greatly simplified the initial data collection procedure. In addition, insight from maintenance personnel allowed us to focus our audit efforts to high priority areas.
Next, we inspected the buildings and equipment, determined operating hours, and took measurements of temperature, illumination levels at typical locations, and other parameters as necessary. While we placed emphasis on determining the capacity and condition of the heating, ventilating, and air conditioning (HVAC) systems and lighting, we also observed the physical condition of the buildings. During each building visit, the survey team noted potential energy efficiency improvements for future evaluation.
We compiled data from the individual building audits in a large database designed for Punahou School using Microsoft Access. We formulated the database to compute baseline annual energy use and demand for each type of equipment in every building on campus, for comparison with the historical energy use records. We also used it to estimate energy and demand savings for the potential energy efficiency improvements while we were still onsite. The calculations were based on engineering algorithms using equipment rating, loading, and operating schedules. As a result, energy use and demand subtotals for each building were readily available during the site visit. This allowed us to see the distribution of energy among the buildings, and, along with valuable input from experienced Punahou personnel, helped to target buildings with the most savings potential. Having the audit results completed while still onsite also enabled us to compare findings with utility bills, and to verify that no major energy using systems were overlooked before we left the site. In the process, we recognized that the campus had many associated “miscellaneous” uses of energy, for example, overhead projectors, computers, refrigerators in some classrooms, and so on. In most cases these items were small and their use infrequent, so we did not include them in the audit. Exceptions were made for major power users, such as the swimming pool water circulation pumps.
We studied buildings in greater detail if the possibility of a significant project or problems were evident. Five buildings were singled out for a detailed feasibility study for improving building air conditioning and lighting systems. For each of these buildings, we submitted an application to Hawaiian Electric Company (HECO) to secure co-funding for the feasibility study.
HECO also offered rebates for high efficiency lighting projects, improved controls, electronic ballasts, high efficiency chillers, and other qualifying energy efficient products. A substantial number of the Punahou projects were eligible for rebates from HECO’s programs, both for renovation of existing buildings and for new construction.
After estimating the implementation costs for the identified energy management opportunities, we used projected energy cost savings calculated in the analysis database to determine the financial feasibility of each potential project. Simple payback was used as a screening criterion for acceptable projects.
Based on our findings, we reported that Punahou could reduce its electricity consumption by 23 percent, from 7.5 million kWh/yr to 5.8 million kWh/yr, and could cut demand from 1,800 kW to 1,550 kW. The overall simple payback for all recommended measures was 4.6 years. Projects required a future capital investment of $821,000; however, at least $69,000 of this could be obtained from Hawaiian Electric Power Company in the form of rebates. We also reported that without taking steps to improve energy use efficiency, Punahou School could expect to see a doubling of electricity costs in the next decade.
Even in 1997, Punahou recognized that to maintain its world class status in the face of rising operating costs, while still being able to offer a high quality education at competitive prices, it had to be world class in the efficiency and quality of its physical plant. The school established a specific goal of reducing energy use by 20% over a 1996 baseline. In addition, implementation of the measures described in this audit were viewed as a first step to enable Punahou to enter the 21st century with a campus that was among the most efficient in the U.S. in terms of energy use.
This is not the end of the Punahou story. Over the next two decades, the cost of electricity in Honolulu did not double, it tripled. Meanwhile, the school undertook a series of measures that built upon and went well beyond the recommendations of our report. In Chapters 8 and 9 we describe some of the HVAC and lighting measures that were recommended. In Chapter 12 we describe Punahou School today, a leading green school and a model for sustainability.
Conclusions
Building and site energy audits are a useful tool for the energy manager. They do not in themselves cause energy savings to occur—except in cases where inefficiencies are addressed immediately during the actual audit—but they do provide the basic data on which to establish an effective program. They also assist in setting priorities and provide a mechanism for evaluating the effectiveness of an energy management program. The energy literature has a number of handbooks that provide additional discussions of methods, analytical techniques, and case studies for building and site audits, including specific approaches for residential, commercial, and industrial facilities.2,3,4,5