
8
Applications of Energy Storage in Modern Power System through Demand-Side Management
Preeti Gupta* and Yajvender Pal Verma
Department of Electrical & Electronics Engineering, UIET, Panjab University, Chandigarh, India
Abstract
The growing need to reduce greenhouse gas emissions, and the emergence of a competitive electricity market all over the world, calls for optimal deployment of the existing generation facilities coupled with limiting the dependence on fossil fuels for electricity generation. Renewable energy resources provide a greener option for electricity generation. However, owing to their intermittency and stochasticity, the grid integration of these resources poses serious operational issues. The increased share of renewables in the generation mix augments net uncertainty and makes it more challenging to maintain supply-demand balance. One of the solutions to mitigate the variability of renewables is incorporating energy storage means. However, installing energy storage devices of suitable size is often associated with large capital costs. In this regard, Demand-Side Management (DSM) options can provide an efficient and cost-effective solution. DSM is the concept that focuses on enhancing the efficiency of various energy processes and also provides options for better utilizing the available generating facilities by adjusting load demand. This chapter provides a detailed introduction to the DSM. The detailed modelling of battery energy storage devices, DR models for minimizing the net load variations; and minimizing the peak load and peak to average ratio (PAR) with DR participation of residential Battery Energy Storage System (BESS) in the solar photo-voltaic integrated system is also discussed.
Keywords: DSM, demand response, PAR, renewable energy resources, BESS
8.1 Introduction to Demand-Side Management
The development of new power system modules and the setting up of the competitive electricity market have driven the utilities to deliver more reliable, stable, and cheaper power to the end users. The advancements in information and communication technologies have added observability to the system and have enabled utilities to exercise control on the demand side. It has steered to the idea of Demand-Side Management (DSM). DSM can be described as the planning, implementation, and monitoring of electricity consumption activity designed to encourage consumers to amend their electricity usage pattern, both concerning timing and amount of electricity consumed so as to improve the overall efficiency and/or economy of the system [1]. DSM offers various benefits such as mitigating emergencies, reducing blackouts, and enhancing system reliability. The appropriate deployment of the DSM techniques may also reduce the energy reserve requirements and can help in reducing energy costs and harmful emissions. Various DSM techniques and their broad classifications are described in next section.
8.1.1 Demand-Side Management Techniques
The power management and operation of electrical energy systems have always been optimized from the generation and distribution perspective. The demand side has received attention only in the recent years leading to the evolution and implementation of the concept of DSM. This includes a variety of different techniques to enhance the overall system efficiency; and optimized utilization of infrastructural facilities and electrical energy. A broad classification of various DSM techniques has been shown in Figure 8.1 [2, 3].
8.1.1.1 Energy Efficiency
Energy efficiency is a long-term conservation strategy involving technological measures that save energy while maintaining the same or superior levels of energy services. The implementation of energy efficiency programs helps in reducing the peak demand, postponing the power system capacity enhancement, and reducing power system costs. All the initiatives to educate and motivate consumers to use more efficient devices, appliances and processes fall under this category [2, 4]. Following are some of the examples of energy-efficient approaches being adopted by the utilities:
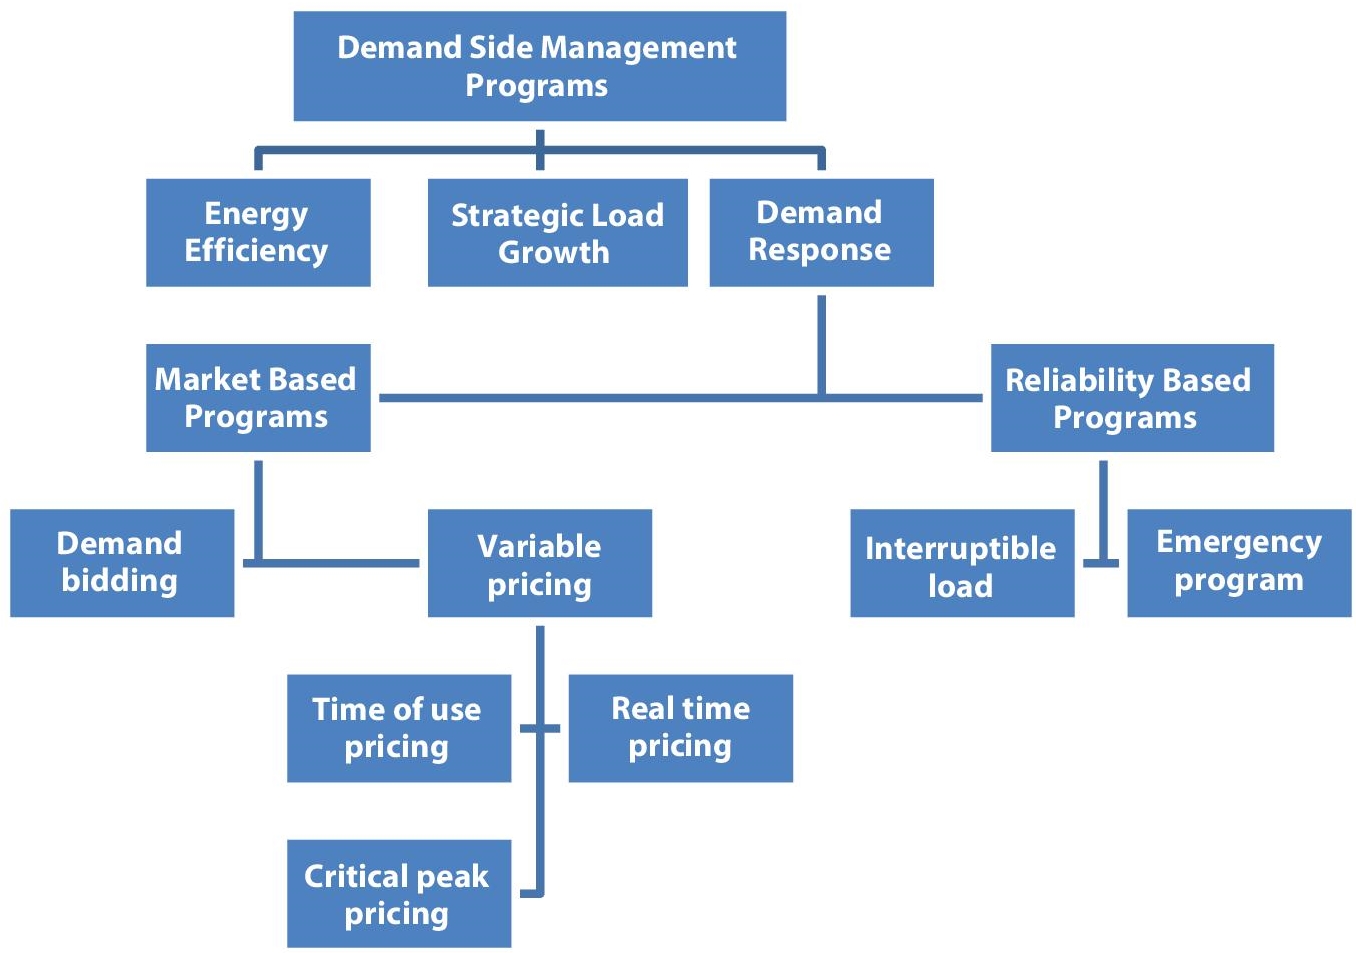
Figure 8.1 Demand-side management techniques.
- Adopting energy-efficient appliances and replacing lighting with LED lights to reduce energy consumption and create awareness among the users about energy efficiency.
- Encouraging regular maintenance of various electrical equipments, recovering waste heat, and implementing cogeneration.
- Designing energy-efficient buildings for consistent reduced energy consumption and installing more efficient methods for space conditioning.
8.1.1.2 Demand Response
Demand response (DR) refers to short-term load management programs designed to influence energy consumption patterns. It is defined as “the ability of the end users to change the electricity consumption at their location from the normal consumption pattern in response to changes in electricity price, or to incentive payments aimed at inducing lesser electricity consumption at the high wholesale price points or when the system reliability is threatened.” Given that DR provides the capability to the system operator to influence and manipulate the load directly, the DR programs are increasingly gaining importance in the new electricity market environment. The DR programs are broadly classified into two categories; market-based or price-based programs and reliability-based or incentive-based programs. In the market-based DR programs, customers have the option to adjust their consumption according to the real-time electricity price. The reliability-based DR programs offer incentives to the enrolled customers for voluntary and/or involuntary adjustment of their controlled appliances [5].
A brief description of the different market-based DR programs is given below:
- Demand bidding program
This program allows large consumers to submit their demand bids for specific load curtailment at a price lower than the market rate. On the acceptance of the bid in the wholesale market, it becomes mandatory for the consumers to curtail the specified bid amount. The deviations from the scheduled bidding are liable to be penalized.
- Real-time pricing programs
As the electricity industry moves towards a more modern grid - and more aware and educated end users; the utilities are beginning to introduce pricing structures that align the electricity tariff with its actual production cost by varying the electricity prices as per the time of its consumption. This is so because the electricity production costis not the same, but fluctuates over time. As the peaking plants are often more expensive than the base load plants, the electricity costs are more during peak hours. These programs offer dynamic pricing structures aimed to limit peak time demands. Various real-time pricing program introduced by the utilities are discussed below:
- Time-of-use (ToU) rate: ToU rate is basically the segregation of energy rates based upon the time of energy consumption. This has been used for decades by utilities with large commercial and industrial consumers. ToU electricity prices are offered over a wide range of time scales, seasonal, monthly, weekly or daily. The varying energy rates reflect the basic electricity production costs during different time periods.
- Critical peak pricing (CPP): CPP is one of the time-varying pricing plans in which the electricity is priced higher during certain peak demand periods. Utilities often send prior notification (day ahead) of the CPP period so that consumers can be pre-prepared to reduce their electricity consumption. CPP can also be used to improve the system reliability as it reflects the system state. Thus, by sending appropriate CPP signals, the consumers can be motivated to decline the load during the system stress events.
- Real-time rate: Under this program, customers pay a tariff that is a function of the actual electricity market price. The rates are usually supplied hourly and vary in accordance with the fluctuations in the power supply. The time granularity may vary from system to system [6].
A brief description of different reliability-based DR programs is given below:
- Interruptible load program: In this DR program, consumers are offered discounted electricity rates or incentives as compensation for allowing service interruptions. Interruptible load programs had been applied by the large commercial and industrial consumers earlier also. Nowadays, such types of programs are also being designed for small consumers as well.
- Direct load control program: In the direct load control DR programs, the utility is allowed to directly reduce or interrupt the electricity supply during peak hours or when the prices are high. The consumers receive compensation for the supply interruptions.
- Emergency program: These programs are designed to manage the system load demand during system contingencies. The consumers are compensated by receiving incentives for declining their demand during system emergency conditions. In contrast to the other two programs, penalties may also be imposed if they abate from the program when required.
8.1.2 Demand-Side Management Approaches
Various DSM approaches have been used by the utilities to achieve the desired load curves [3, 7]. The particular techniques are presented in Table 8.1.
Table 8.1 Different DSM approaches and their objectives.
| Type | Objectives |
|---|---|
| Peak shaving or peak clipping | Peak clipping approach reduces the load during peak periods without compensating the same at some other period. |
| Valley filling | Deferring demand to off-peak periods; thus reducing the difference between off-peak and peak periods. Hence improving the network load factor. |
| Load shifting | Flattening of load curve by shifting load from peak periods to off-peak period resulting in load reduction at one period and increase by the same amount in some other time period. |
| Strategic Energy conservation | The main objective is to reduce losses in the system at the user end. Thus improving terminal system efficiency. Correction of lighting systems is an example of strategic energy saving. |
| Strategic load growth | Increasing the general load demand over the consumption profile. |
| Flexible load shape | It involves the identification and control of the customers who are willing to be controlled during emergency periods through the smart grid management system. |
8.2 Operational Aspects of DR
Demand response is an important tool that enables end-user participation in handling different operational issues. It helps energy providers to reduce the peak demand and also align the energy consumption with the non-dispatchable renewable generation. On the consumer side, DR allows them to select the energy provider of their choice, earn incentives for DR participation or reduce electricity bills by changing their energy consumption pattern. This helps in reducing the overall operational cost and carbon emission levels as well as increasing the grid sustainability. Some of the operational aspects of DR as highlighted in Figure 8.2 are discussed below [8, 9].
i) Load profile management
Demand response is not a new concept but in recent years it has been receiving more attention. Due to the developments in information and wireless communication technologies and wide applications in the power systems like smart meters and energy management systems, participation of small consumers in DR has also been made possible.
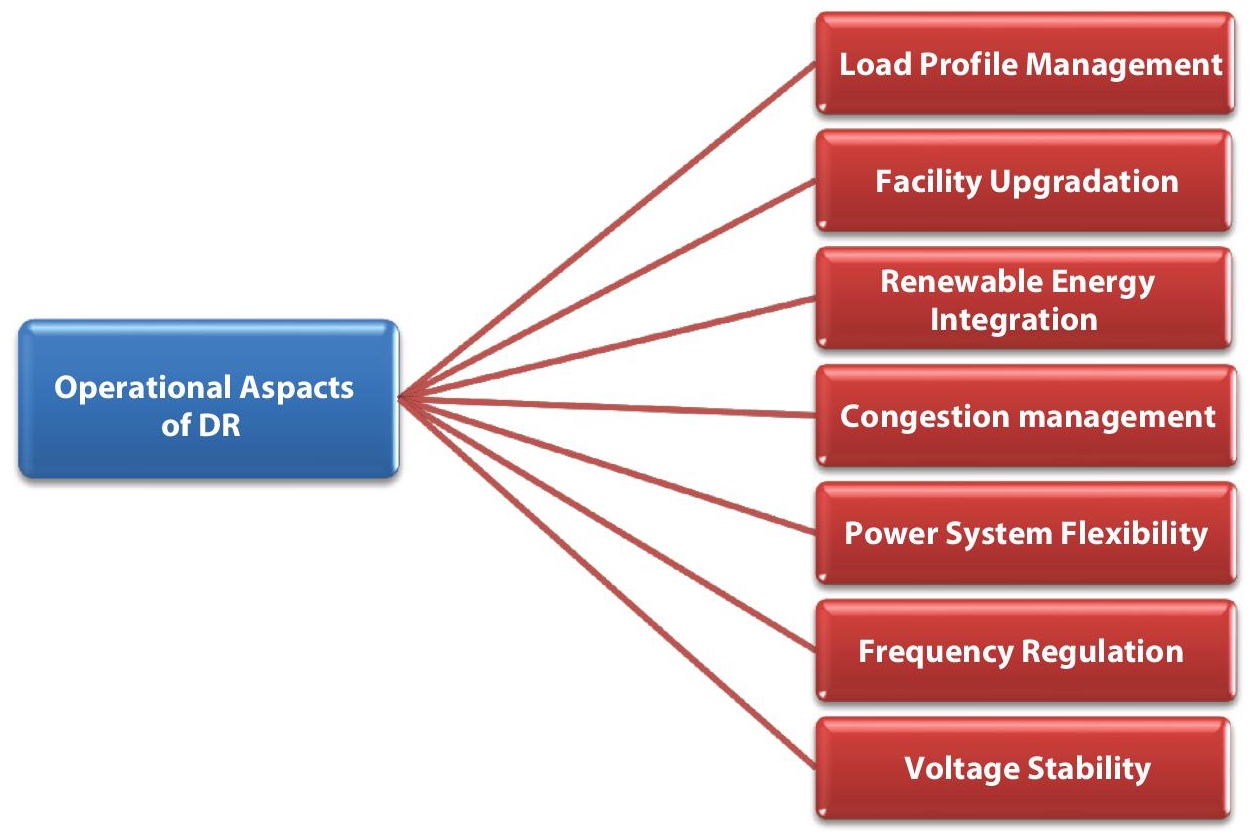
Figure 8.2 DR operational aspects.
Peak-load management is an important function, wherein utilities reshape the load curve to reduce overall operational cost and improve energy efficiency. Utilizing load-shifting DR programs with a large number of devices of various types, the power consumption can be shifted from the peak load periods to more appropriate times so that the distribution system’s peak demand can be reduced [10].
ii) Facility upgradation
Application of DR may effectively delay the requirement for transmission and distribution system upgradation. DR techniques can be applied to adjust the power consumption from heavily loaded periods to light load periods and ESS can be used to reduce the impact of peak load. DR aims to match the power demand with the available resources without adding new generation capacity by affecting peak shaving and valley filling. Therefore, the need for expensive capacity enhancement can be postponed [11, 12].
iii) Renewable energy integration
Over the last two decades, the utilization of renewable energy sources, and in particular large wind and solar energy into electricity generation, is on the rise. The displacement of conventional energy resources by renewable energy is considered to be a sustainable option for reducing greenhouse gas emissions. However, compared with fossil fuel–based electricity generation, wind and solar have challenging non-dispatchable operating characteristics such as variable and lower capacity factors and intermittent, variable availability [13].
DR is believed to provide one of the efficient solutions to accommodate the increasing penetration of the variable renewables with uncertainties and volatilities. The controllable loads and energy storage can be operated to align the system load demand with the generation. The power consumption can be reduced by exerting proper DR when lesser electricity is being produced by the renewable generators [14].
iv) Congestion management
Proper application of DR can be effective in handling congestion in the distribution systems. Typically, consumers are accustomed to switching on appliances randomly and consuming electricity without interruption. With the bi-directional communication between the consumers and system operator becoming reality, some of the residential loads can be treated as flexible and controllable. The time of operation of such load can be adjusted in response to the system operating conditions. Thus, the flexible loads and ESS provide the system operator with the capacity to ease the network congestion points. The appliances that are time–flexible could be used to ease the network congestion points. This can include air-conditioners, refrigerators, and water heaters [15, 16].
v) Power system flexibility
DR is a fast-growing resource management strategy that yields a dual impact of managing electricity demand and enabling efficient and flexible system operation. Utilities with a larger share of variable renewable generation find it more difficult to follow the load curve and meet the power demand than the systems with conventional generators only. The conventional generators are capable of providing spinning reserve capacity to adjust the load variations and maintain the vital supply-demand balance in the power grid. However, in highly renewable energy mixed systems, it becomes difficult for the system operator to manage the required spinning reserve capacity efficiently. DR can provide alternative means to create indirect reserve capacity and implement cost-efficient flexibility [17].
vi) Frequency regulation
System frequency is a direct measure of the balance between system demand and generation at any point in time and must always be maintained within narrow statutory bounds to ensure system stability. The inherent stochasticity of the load demand makes it difficult for the system operators to maintain this balance. Sufficient spinning reserves and fast-responding generators are required to meet the load uncertainties. In addition, sufficient generation capacity is required to meet the peak load demand, which may occur only for small periods during the day. This adds to the cost of the electricity and inefficient use of the generation capacity. Hence, the generation utilities used different tariff schemes to encourage more electricity utilization during off-peak hours and vice versa. Earlier, only large industrial consumers used to take part in this activity. More recently, with the advancements in technology, there have been initiatives to incorporate electrical appliances also into the demand-side management activity and provide frequency regulation services. The time flexible electrical appliances including residential, commercial, or industrial water heaters, air conditioners, and refrigerators could be used for this purpose [18].
vii) Voltage stability
The voltage level in power transmission and distribution networks in the grid must be maintained within a specified tolerance band. The power distribution systems are persistently facing ever-growing load demand. Distribution networks experience wide load variations every day, distinctly varying from low to high levels. The large variations in load if not managed properly may result in voltage fluctuations. In certain heavily loaded areas, under critical loading conditions, the distribution network may experience voltage collapse [19].
One of the promising solutions to enhance the voltage stability in the distribution networks is through end-user participation in DR programs. DR participation of ESS may contribute to maintain required voltage stability margin at network nodes by injecting and absorbing the controllable reactive power [20].
8.3 DSM Challenges
The concept of demand-side management is not new. However, widespread implementation of DSM is lacking. Although the key technologies required for its implementation have been developed, several challenges need to be addressed to increase DR participation [8, 21]. These include:
i) Lack of infrastructure
There has been a substantial development in communications and information technologies in recent years. But the deployment of advanced information, communications, and metering and control technologies in most of the electricity systems has not been there. The integration of various demand response techniques in the system operations requires the deployment of appropriate sensors and advanced measurement and control devices in addition to sophisticated metering and trading facilities. In order to support the real-time execution of various DR programs a wide range of information, communication, and control systems are needed and control actions involving generation, loads and other network devices are required [1].
ii) Market barriers
The implementation of enabling technologies like DSM often involves different participants. The market penetration of DR programs and storage is influenced and hampered by factors like market structure, financing, incentives, institutional, policy, and regulatory framework. Considering the characterization and disaggregation of their multi-stream value, the development of a business case for such technologies becomes very complex. In the existing deregulatory market structure, different sectors (e.g., generating companies, transmission and distribution companies, etc.) of the power industry are operating as individual businesses. The benefits of DR participation can be associated with several power industry sectors that may be willing to deploy and incentivise certain specific aspects of the activity. There are multiple recipients of the DR activity who are willing to use it for their individual gains. Clearly, the individual power sector will tend to utilize the services for its own interests without caring for maximising the overall system benefits that could only be achieved by trading off the individual segment benefits. Thus, a suitable regulatory framework is a must to extract the benefits of DR and storage technologies in the current deregulated system [4].
Another important aspect is that the increased DR activity at the distribution level should not hamper the secure and safe operation of the power grid. In this context, a holistic approach and a clear regulatory mechanism are essential to ensure that no additional voltage violations and congestion are introduced by DR.
iii) Increased system complexity
Another barrier to the implementation of the DR is the increased operational complexity. The integration of DR in the system operation tends to increase the system complexity due to added information and control requirements. Nevertheless, given the flexibility requirements with the increased penetration of the renewable-based generation; to deal with the uncertainties DR is now been seen as an important tool in future developments. Moreover, as the number of utilities implementing DR is increasing coupled with developments in technology, there is a continuous fall in the DR implementation cost. It can be expected in near future that the technology will become more competitive and gain improved confidence in the application of DR schemes.
iv) Behavioural barriers
Implementation of the DR schemes involves the participation of different categories of consumers. The DR participation of small consumers can be influenced not only by the economic benefits. Rather it may be more driven by other factors like convenience, comfort trust, and credibility. The trust and credibility of the DR provider play a significant role in the acceptance of DR programs, especially in the case of smaller, local DR participants whom they identify with trust. In particular, it can be linked to the resistance to allow third-party information and control of appliance usage patterns.
v) Safety and security of data
The safety and security of the data collected under the DR actions are very important and crucial. At the data flow level, it is imperative to have a secure, safe, secure, and efficient transfer and sharing of data with the different entities involved in the DR action. This is a very important and vital factor as it plays a significant role in building the DR provider credibility and helps in the long-term association between DR participants and the DR providers and ultimately effective implementation of the DR program.
8.4 Demand Response Resources
Different options that could be available for DR participation have been shown in Figure 8.3. DG resources including wind and solar photovoltaic generation are intermittent and generally uncontrollable whereas DGs such as diesel or gas generators or small Combined Heat and Power Plants (CHPs) are controllable [22, 23]. The distributed energy resources are capable of reducing the net load demand of the utility effectively during peak hours. However, vice versa is not true in their case, as these cannot be utilized for increasing the demand during low load periods.
Interruptible loads include the portion of load demand that is not very critical. This is generally comprised of a set of those devices whose operation is not very important and their disconnection does not cause much inconvenience to the consumers. The DR participation of interruptible loads also helps in reducing the demand during peak hours only. Deferrable loads include appliances that are time flexible in operation. The deferrable devices DR can shift energy consumption rather than curtail within their operational bounds. These can be thought of as storage and utilized both for absorption as well as the release of energy around their nominal operational and power consumption trajectory.

Figure 8.3 Different DR resources.
Another DR resource is offered by the energy storage devices available on the consumer side. These may include both static energy storage systems (such as batteries and electrical heating systems) and Electric Vehicles (EVs). The choice of energy storage for DR is motivated by the fact that they can absorb and supply controllable energy on predetermined charge and discharge rates. A considerable amount of balancing capability and flexibility can be provided by a collection of small consumer-side energy storage devices. These could be an effective DR source, especially in variable renewable integrated systems by offering a large collective energy storage capacity. In the next section, the role of battery energy storage DR in solar PV integrated system has been explained in detail.
8.5 Role of Battery Energy Storage in DSM
Battery energy storage is a controllable and dispatchable resource and can be utilized effectively in response to power system situations such as price fluctuation or renewable energy intermittency [24]. Storage batteries have a fast response time and can be deployed to overcome the variability of load and renewable generation. However, if the energy storage devices are installed to solely handle the intermittency of renewable generation, the investment cost will increase substantially as the storage capacities required will be very large. To reduce the large-scale deployment of energy storage at the supply-side, consumer-side energy storage devices can be incorporated through suitably designed demand response programs. In this section, applications of residential consumers’ battery energy storage systems DR have been explained through two separate case studies. In the first case study, battery energy storage DR has been applied to reduce the PAR, and hence peak demand and valley filling have been achieved in a PV integrated system. In the second case study, the net load profile variations from the forecasted load have been minimized using the storage capacity of the residential BESS through DR.
8.5.1 Case Study I: Peak Load and PAR Reduction
In a PV integrated distribution system, the availability of solar generation reduces the net grid power demand during daytime; however, it has been observed that the demand curve usually peaks during evenings. Thus, connecting PV generation does not help in reducing the system peak. This case study explains the application of consumer-side batteries to store the energy during the low net load periods and dispatching during the high demand period when PV power is not available. This helps in reducing the peak demand and improving the peak-to-average ratio. The actual load curve of Chandigarh, a union territory city of India, is used for the study. The city has a total of 1,87,687 residential electricity consumers. The study has been performed for a set of 1,000 consumers, thus a modified load curve is obtained by scaling down the actual load profile. It has been assumed that 70% of the consumers participate in DR.
8.5.1.1 Problem Formulation
The objective function can be defined as (8.1):
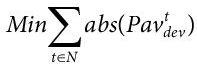
Where, N is the total number of the time slot in 15-minute blocks and ![]() is the deviation of the net modified demand from the average demand during tth time slot. Net demand
is the deviation of the net modified demand from the average demand during tth time slot. Net demand ![]() is the remaining demand after reducing the solar generation,
is the remaining demand after reducing the solar generation, ![]() from the actual load demand
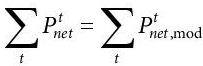
from the actual load demand ![]() . The net demand curve is modified through power exchange with the batteries and the values of modified load demand at any time
. The net demand curve is modified through power exchange with the batteries and the values of modified load demand at any time ![]() can be obtained as in (8.2) and (8.3) below:
can be obtained as in (8.2) and (8.3) below:
Here, ![]() is the cumulative power exchange with the batteries of all the households employed in DR. The energy storage capacity of the participating batteries is conducted by the network operator to shave the peak demand of the net load by reducing the gap between the actual net demand and the average net demand
is the cumulative power exchange with the batteries of all the households employed in DR. The energy storage capacity of the participating batteries is conducted by the network operator to shave the peak demand of the net load by reducing the gap between the actual net demand and the average net demand ![]() by eq. (8.4).
by eq. (8.4).
Here, Pavnet is the average value of the net demand over the settlement period. The energy storage capacity of the batteries is utilized to shift the load from the peak hours to the minimum net load periods. The central operator coordinates the charging and discharging cycles of the batteries to reduce peak demand and fill the valley area of the net demand curve.
8.5.1.2 Energy Storage Dispatch Modelling
The battery energy storage DR strategy implemented here works on the principle of controlling the charging and discharging of the consumer-owned batteries so as to minimize the gap between the average load and the actual load during each time block. The energy storage capacity is operated by the distribution network operator (DNO) to shave peak demand. The specifications of the batteries of the assumed BESS are given in Table 8.2. The mathematical formulation of the battery power exchange is given below in (8.5):
Here ![]() and
and ![]() are the charging and discharging power dispatched by the batteries and are represented as given in (8.6) and (8.7). To mark a time block as either discharging or charging, two 96X1 column vectors
are the charging and discharging power dispatched by the batteries and are represented as given in (8.6) and (8.7). To mark a time block as either discharging or charging, two 96X1 column vectors ![]() and
and ![]() are defined. The elements in these two vectors are either 0 or 1. In the vector
are defined. The elements in these two vectors are either 0 or 1. In the vector ![]() , 1 represents discharging operation in the time block while 0 is not, and on the contrary in the vector
, 1 represents discharging operation in the time block while 0 is not, and on the contrary in the vector ![]() , 1 represents charging operation while 0 is not.
, 1 represents charging operation while 0 is not.

Here, ![]() and
and ![]() are the number of batteries undergoing discharging and charging cycles respectively. The efficiency of batteries is not the same during charging and discharging cycles and these have been represented by ηch, ηdis respectively. The power exchange with the battery can be obtained from terminal voltage and the current flowing, and is limited by the maximum allowable battery current. Assuming that battery operation at maximum allowable current and constant terminal voltage, the battery power exchange during any operating cycle pbat is constant.
are the number of batteries undergoing discharging and charging cycles respectively. The efficiency of batteries is not the same during charging and discharging cycles and these have been represented by ηch, ηdis respectively. The power exchange with the battery can be obtained from terminal voltage and the current flowing, and is limited by the maximum allowable battery current. Assuming that battery operation at maximum allowable current and constant terminal voltage, the battery power exchange during any operating cycle pbat is constant.
The charging/discharging operation during any time block changes the state of charge (SoC) of the batteries. During charging cycles the energy is stored in the batteries and hence, the SoC of the batteries improves while during discharging cycles the state of charge of batteries deteriorates as the stored energy is dispatched. Equations relating ![]() and
and ![]() with the SoC are given as in (8.8), (8.9):
with the SoC are given as in (8.8), (8.9):
The operation of the battery storage system must satisfy the following constraints: value ![]() can be obtained. This constraint is formulated as (8.10), (8.11):
can be obtained. This constraint is formulated as (8.10), (8.11):
- The charging/discharging power during a time block is limited by the maximum allowable energy transfer through the batteries. This is determined by the battery terminal voltage and the maximum allowable battery current. By assuming the terminal voltage of batteries to remain constant at their rated value and keeping current at its maximum permissible
- The state of charge of the battery is limited by maximum energy storage capacity SoCmax and minimum permissible charging level SoCmin which depends upon the battery depth of discharge specification. Thus, battery SoC during a time block is subject to the following constraint (8.12):
- The number of batteries charging/discharging during a time block cannot be more than the number of residents participating in DR (ndr). This is given as (8.13):
In addition to the above constraints, it has been assumed that the battery SoC at the end of the settlement period is equal to the SoC at the beginning of the settlement period. Thus, the total load supplied or the energy drawn over the day with and without DR is the same. This can be formulated as (8.14):
| Description | Unit |
|---|---|
| Battery Capacity | 2.4kWh |
| Depth of discharge limited | 2kWh (80%) |
| Charging/discharging current limit | <20% of rated AH |
| Round trip efficiency | 80% |
8.5.2 Case Study II: Minimizing Load Profile Variations
Load curve fluctuations and uncertainty are very common and critical issues in power system operations. They have been the main cause of load– supply imbalance and power system stability problems [26]. Integration of variable renewables on the load side further increases the uncertainty and the stochasticity of the net load curve (the remaining demand that is not supplied by RES). The distribution utilities are required to purchase more reserves for supplying higher uncertainties, which increases the operational costs significantly. In this regard, DR options are now being looked upon to provide an efficient and cost-effective solution [27].
In this case study, the battery energy storage DR has been applied to minimize the disparity between the predicted net load profile and the actual net load profile. In this case, also, centralized DR participation of the residential community through an incentive-based DR scheme has been considered. The case of a distribution utility with residential, commercial, and industrial consumers has been assumed for investigation. It has been assumed that there are 1,000 residential consumers and 70% of them enrol for energy storage DR. The specifications assumed for the batteries are given in Table 8.2.
8.5.2.1 Problem Formulation
The objective function is defined by (8.15) as follows:
Here, ![]() , and
, and ![]() are the net forecasted and net actual load profiles respectively. Net scheduled load is obtained by reducing the forecasted SPV generation
are the net forecasted and net actual load profiles respectively. Net scheduled load is obtained by reducing the forecasted SPV generation ![]() from the forecasted load
from the forecasted load ![]() . The forecasted SPV generation is calculated using forecasted solar irradiance. The net actual load profile is obtained by reducing the actual SPV generation
. The forecasted SPV generation is calculated using forecasted solar irradiance. The net actual load profile is obtained by reducing the actual SPV generation ![]() from the actual load
from the actual load ![]() during a time slot (8.16), (8.17).
during a time slot (8.16), (8.17).
Using smart energy management systems and smart metering devices the charging/discharging operation of the BESS within the consumers’ premises can be implemented [28]. The deviations of the actual net load profile from the forecasted are minimized by controlling battery power exchange. The power balance equation considering BESS DR can be written as (8.18):
Here, ![]() is the cumulative power exchanged with all the BESS and
is the cumulative power exchanged with all the BESS and ![]() represents the deviation of the load from the forecasted value after implementing DR. The battery power exchange can have both positive and negative values. In (8.18) positive values indicate battery discharging while charging operation is indicated by negative values. The modelling and constraints of the battery energy storage system have been explained in section 8.5.1.2.
represents the deviation of the load from the forecasted value after implementing DR. The battery power exchange can have both positive and negative values. In (8.18) positive values indicate battery discharging while charging operation is indicated by negative values. The modelling and constraints of the battery energy storage system have been explained in section 8.5.1.2.
8.5.2.2 SPV System Modelling
The calculated value of the SPV output is obtained from the forecasted solar irradiation (8.6). The solar irradiance data is available with a time granularity of one minute. The average value of irradiance taken over 15 minutes is used for each time block [29].

Here, ![]() is the equivalent generation rating of the SPV system, Rt which represents forecasted solar irradiance in W/m2 and Rst is the irradiance under standard atmospheric conditions and has been taken as 1000 W/m2. Rc is the radiation point and its value has been assumed as 250 W/ 2 [29]. To account for the effect of atmospheric conditions and inverter efficiency on the generation, the output computed in (8.19) is multiplied with an empirical factor of 0.8.
is the equivalent generation rating of the SPV system, Rt which represents forecasted solar irradiance in W/m2 and Rst is the irradiance under standard atmospheric conditions and has been taken as 1000 W/m2. Rc is the radiation point and its value has been assumed as 250 W/ 2 [29]. To account for the effect of atmospheric conditions and inverter efficiency on the generation, the output computed in (8.19) is multiplied with an empirical factor of 0.8.
8.5.3 Results and Discussions
8.5.3.1 Case Study I: Peak Load and PAR Reduction Using Batteries with DR
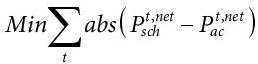
In this section, the effect of centralized control of active power dispatch and consumption of consumer side batteries on the net load demand has been discussed. Figure 8.4 shows the net load curve with and without the battery power support through DR action. Due to the presence of SPV generation, the net load demand becomes considerably low during daytime and net demand starts increasing from the afternoon onwards. This is because of the combined effect of increased load demand in the evening hours and non availability of solar electricity generation.
Considering the actual load profile, the peak load demand is 1770 kW (time slot 4) and the minimum load demand is 507.9 kW (time slot 37). There is a large difference between demand at the peak point and load at the lowest valley point; and the corresponding PAR value is 1.535. The results reveal that with the application of the energy storage DR, the peak demand is reduced to 1497 kW and the minimum net drawal is raised to 809.7 kW. It is indicated that the power drawal from the grid during peak hours gets reduced, while during low load periods, it is increased.
Figure 8.5 shows the cumulative power exchange with the batteries. Here, the positive values of power exchange indicate battery charging, and negative values indicate energy dispatch from the batteries. The energy is transferred to the batteries in the time slots where the net demand is lesser and it is released when the demand rises.
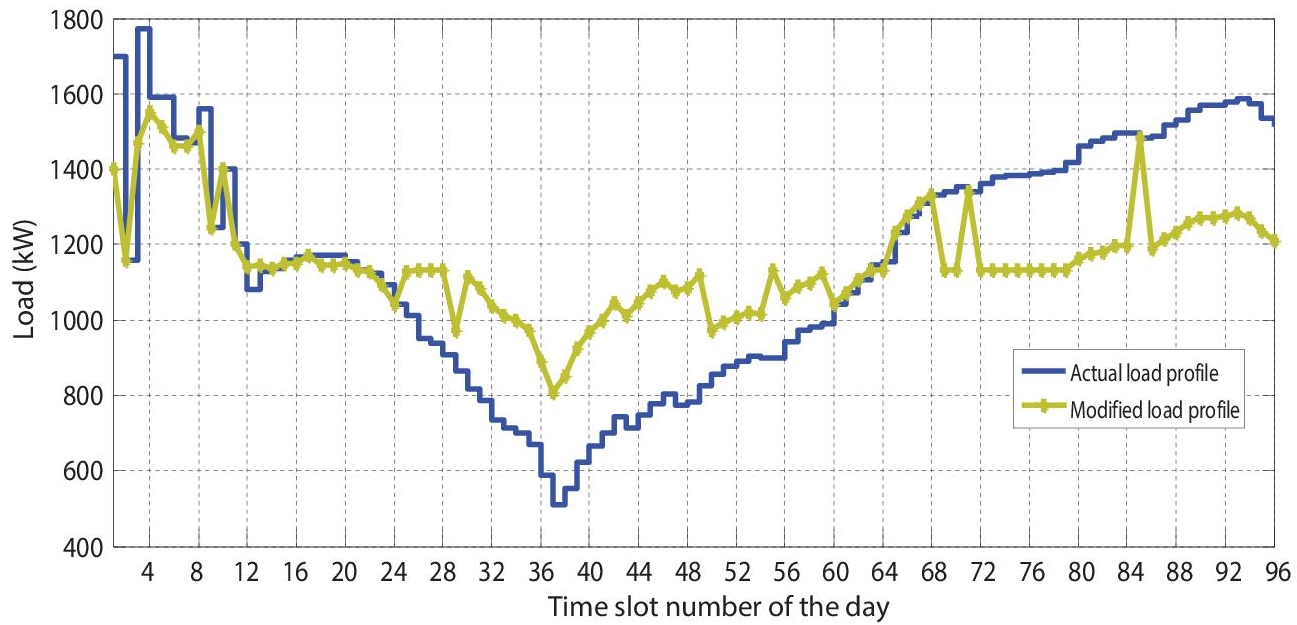
Figure 8.4 Effect of DR on the net load profile.
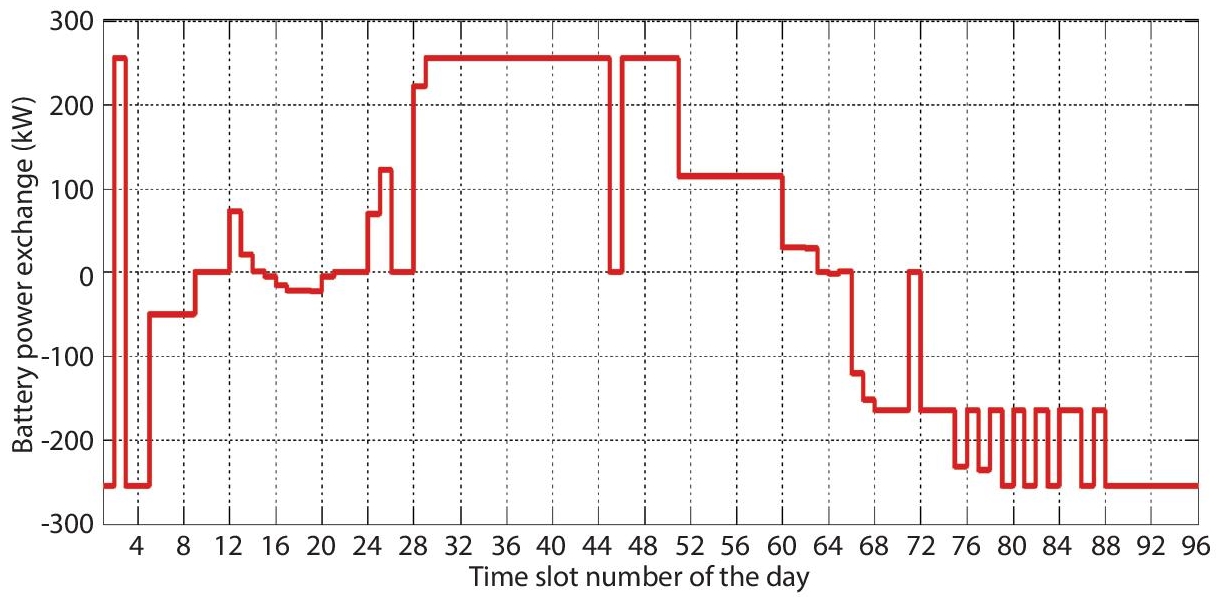
Figure 8.5 Battery charging/discharging cycles over the day.
During the daytime when sufficient solar energy is available, the energy is transferred to the batteries participating in DR. In the evening hours when the net demand rises, the energy is optimally dispatched from the BESS. This helps in flattening the net load curve by reducing the system peak load, and the peak-to-average ratio also gets improved from 1.535 to 1.302. Thus, the integration of available consumer batteries.
8.5.3.2 Case Study II: Minimizing Load Profile Variations Using Batteries with DR
The forecasted and actual net load profiles are shown in Figure 8.6. It indicates that there have been considerably large deviations of the actual and predicted net load profiles during certain time intervals. It is indicated that during the time slots 32 to 37 and 47 to 53 the difference between the predicted and actual net load demands has been quite large.
Figure 8.7 shows the effect of battery energy storage DR on the net load profile variations from the scheduled demand. The figure shows the load profile variations with and without DR. The cumulative power exchange with the batteries is also shown in this figure. Here the positive values of battery power indicated charging operation, while the negative sign indicates that the energy is being dispatched from the batteries to supply the load. In the time intervals, where the actual demand is more than the forecasted load, the stored energy in the batteries is supplied to the system; and the energy is transferred to the batteries when the demand is less than the forecasted values.
It is clear from the results that the proposed DR scheme has effectively balanced the load profile variations. The variations have been reduced to zero over the larger part of the day; while in the intervals with higher load excursions (31 to 37, 47 to 52, and 65 to 66) these have been considerably reduced. Thus, as revealed in Figure 8.8, with the application of battery energy storage in DR, the actual net load curve follows the forecasted load curve quite closely.

Figure 8.6 Comparison of forecasted and actual net load curves.

Figure 8.7 Net load variations with/without DR and BESS power exchange.
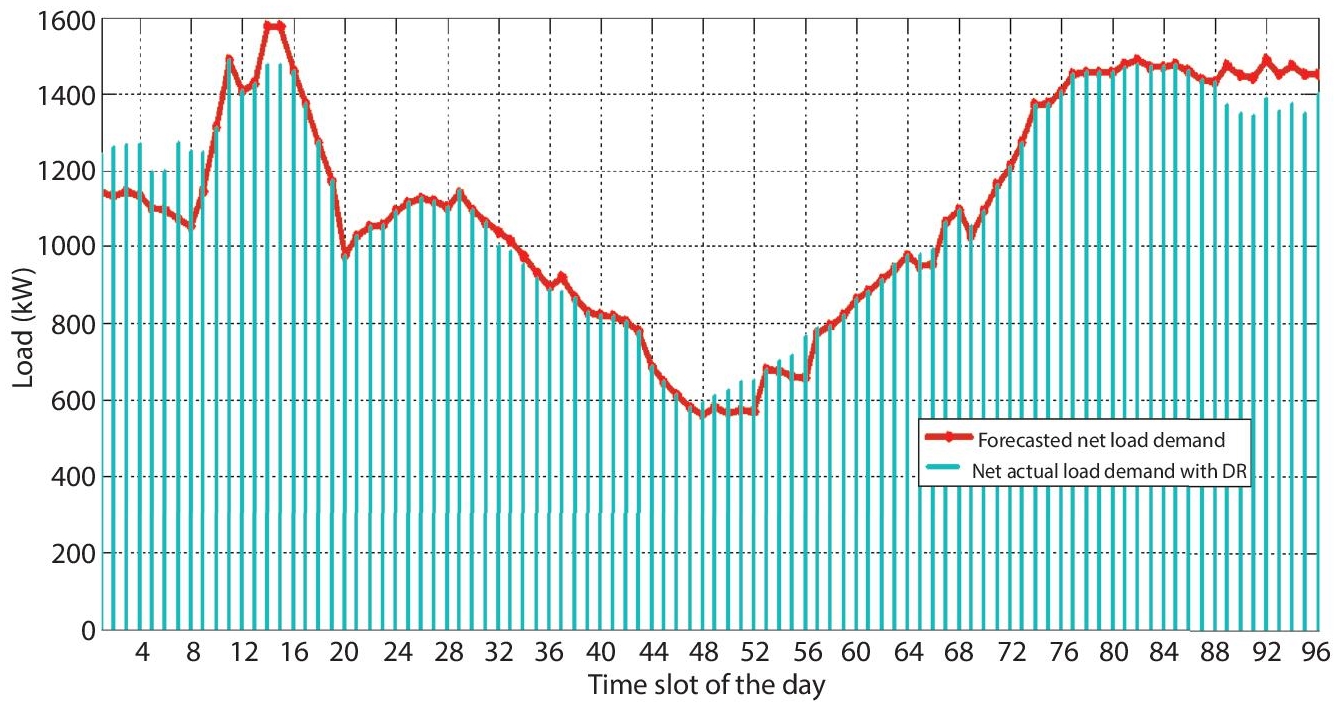
Figure 8.8 Net actual load curve with and without DR.
8.6 Conclusion
Demand response resources can play a vital role in modern power system operations. Particularly, demand response participation of consumer-owned battery energy storage systems offers great potential without causing inconvenience to the consumers. Because of bidirectional power flow and fast response time, the battery energy storage DR provides flexibility to the system, especially in renewable integrated systems. The deployment of residential consumers’ battery energy storage for centralized DR helps in reducing the system peak demand and improves peak to average ratio considerably. The battery energy storage DR is also effective in reducing the net variations of the actual load profile from the predicted load profile. Thus, the DR participation of consumers’ energy storage systems not only helps in utilizing the SPV power more efficiently but also helps in mitigating the SPV generation variability quite effectively without needing to install additional storage capacity.
References
- 1. V. S. K. V. Harish and A. Kumar, “Demand side management in India: Action plan, policies and regulations,” Renew. Sustain. Energy Rev., vol. 33, pp. 613– 624, 2014, doi: 10.1016/j.rser.2014.02.021.
- 2. A. F. Meyabadi and M. H. Deihimi, “A review of demand-side management : Reconsidering theoretical framework,” Renew. Sustain. Energy Rev., vol. 80, May, pp. 367–379, 2017, doi: 10.1016/j.rser.2017.05.207.
- 3. K. Kostková, P. Kyčina, and P. Jamrich, “An introduction to load management,” Electric Power Systems Research, vol. 95, pp. 184–191, 2013, doi: 10.1016/j.epsr.2012.09.006.
- 4. M. T. Johansson and P. Thollander, “A review of barriers to and driving forces for improved energy efficiency in Swedish industry – Recommendations for successful in-house energy management,” Renew. Sustain. Energy Rev., vol. 82, April 2017, pp. 618–628, 2018, doi: 10.1016/j.rser.2017.09.052.
- 5. M. Uddin et al., “A review on peak load shaving strategies,” Renew. Sustain. Energy Rev., vol. 82, February 2017, pp. 3323–3332, 2018, doi: 10.1016/j. rser.2017.10.056.
- 6. I. P. Panapakidis, “A Novel Demand Side Management Strategy Implementation Utilizing Real-Time Pricing Schemes,” 2017.
- 7. T. Boßmann and E. J. Eser, “Model-based assessment of demand-response measures — A comprehensive literature review,” Renew. Sustain. Energy Rev., vol. 57, pp. 1637–1656, 2016, doi: 10.1016/j.rser.2015.12.031.
- 8. G. Strbac, “Demand side management: Benefits and challenges,” Energy Policy, vol. 36, no. 12, pp. 4419–4426, 2008, doi: 10.1016/j.enpol.2008.09.030.
- 9. R. Sharifi, S. H. Fathi, and V. Vahidinasab, “A review on Demand-side tools in electricity market,” Renewable and Sustainable Energy Reviews, vol. 72, December 2016. pp. 565–572, 2017, doi: 10.1016/j.rser.2017.01.020.
- 10. N. Kinhekar, N. P. Padhy, F. Li, and H. O. Gupta, “Utility Oriented Demand Side Management Using Smart AC and Micro DC Grid Cooperative,” IEEE Trans. Power Syst., vol. 31, no. 2, pp. 1151–1160, 2016, doi: 10.1109/ TPWRS.2015.2409894.
- 11. K. Karunanithi, S. Saravanan, B. R. Prabakar, S. Kannan, and C. Thangaraj, “Integration of Demand and Supply Side Management strategies in Generation Expansion Planning,” Renew. Sustain. Energy Rev., vol. 73, January, pp. 966–982, 2017, doi: 10.1016/j.rser.2017.01.017.
- 12. Z. Wang, C. Gu, F. Li, P. Bale, and H. Sun, “Active demand response using shared energy storage for household energy management,” IEEE Trans. Smart Grid, vol. 4, no. 4, pp. 1888–1897, 2013, doi: 10.1109/TSG.2013.2258046.
- 13. N. K. Kandasamy, K. J. Tseng, and S. Boon-Hee, “Virtual storage capacity using demand response management to overcome intermittency of solar PV generation,” IET Renew. Power Gener., vol. 11, no. 14, pp. 1741–1748, 2017, doi: 10.1049/iet-rpg.2017.0036.
- 14. J. Vishnupriyan and P. S. Manoharan, “Multi-criteria decision analysis for renewable energy integration: A southern India focus,” Renew. Energy, vol. 121, pp. 474–488, 2018, doi: 10.1016/j.renene.2018.01.008.
- 15. L. Ni, F. Wen, W. Liu, J. Meng, G. Lin, and S. Dang, “Congestion management with demand response considering uncertainties of distributed generation outputs and market prices,” J. Mod. Power Syst. Clean Energy, vol. 5, no. 1, pp. 66–78, 2017, doi: 10.1007/s40565-016-0257-9.
- 16. W. Liu, Q. Wu, F. Wen, J. Østergaard, and S. Member, “Day-Ahead Congestion Management in Distribution Systems through Household Demand Response and Distribution Congestion Prices,” IEEE Trans. Smart Grid, vol. 5, no. 6, pp. 1–10, 2014.
- 17. C. Zhang, Y. Ding, N. C. Nordentoft, P. Pinson, and J. Østergaard, “Flech: A Danish market solution for DSO congestion management through DER flexibility services,” J. Mod. Power Syst. Clean Energy, vol. 2, no. 2, pp. 126–133, 2014, doi: 10.1007/s40565-014-0048-0.
- 18. K. Dehghanpour and S. Afsharnia, “Electrical demand side contribution to frequency control in power systems : a review on technical aspects,” Renew. Sustain. Energy Rev., vol. 41, pp. 1267–1276, 2015, doi: 10.1016/j. rser.2014.09.015.
- 19. M. Yao, J. L. Mathieu, and D. K. Molzahn, “Using Demand Response to Improve Power System Voltage Stability Margins.”
- 20. P. Gupta and Y. P. Verma, “Voltage profile improvement using demand side management in distribution networks under frequency linked pricing regime,” Appl. Energy, vol. 295, May, p. 117053, 2021, doi: 10.1016/j. apenergy.2021.117053.
- 21. N. Good, K. A. Ellis, and P. Mancarella, “Review and classi fi cation of barriers and enablers of demand response in the smart grid,” Renew. Sustain. Energy Rev., vol. 72, November 2016, pp. 57–72, 2017, doi: 10.1016/j. rser.2017.01.043.
- 22. B. Li, J. Shen, X. Wang, and C. Jiang, “From controllable loads to generalized demand-side resources: A review on developments of demand-side resources,” Renew. Sustain. Energy Rev., vol. 53, pp. 936–944, 2016, doi: 10.1016/j.rser.2015.09.064.
- 23. A. K. Singh and S. K. Parida, “A review on distributed generation allocation and planning in deregulated electricity market,” Renew. Sustain. Energy Rev., vol. 82, August 2017, pp. 4132–4141, 2018, doi: 10.1016/j.rser.2017.10.060.
- 24. S. Dhundhara, Y. P. Verma, and A. Williams, “Techno-economic analysis of the lithium-ion and lead-acid battery in microgrid systems,” Energy Convers. Manag., vol. 177, September, pp. 122–142, 2018, doi: 10.1016/j. enconman.2018.09.030.
- 25. P. Gupta and Y. P. Verma, “Optimisation of deviation settlement charges using residential demand response under frequency-linked pricing environment,” IET Gener. Transm. Distrib., vol. 13, no. 12, pp. 2362–2371, 2019, doi: 10.1049/iet-gtd.2018.7116.
- 26. S. Dhundhara and Y. P. Verma, “Application of micro pump hydro energy storage for reliable operation of microgrid system,” vol. 14, pp. 1368–1378, 2020, doi: 10.1049/iet-rpg.2019.0822.
- 27. M. Yekini Suberu, M. Wazir Mustafa, and N. Bashir, “Energy storage systems for renewable energy power sector integration and mitigation of intermittency,” Renew. Sustain. Energy Rev., vol. 35, pp. 499–514, 2014, doi: 10.1016/j.rser.2014.04.009.
- 28. A. M. Vega, F. Santamaria, and E. Rivas, “Modeling for home electric energy management: A review,” vol. 52, pp. 948–959, 2015, doi: 10.1016/j. rser.2015.07.023.
- 29. P. Gupta and Y. P. Verma, “Role of Residential Demand Response in Optimizing Utility Cost in PV Integrated System under Frequency Linked Pricing Environment,” 2019.
Note
- *Corresponding author: [email protected]