
10
Cost-Benefit Analysis with Optimal DG Allocation and Energy Storage System Incorporating Demand Response Technique
Rohit Kandpal1, Ashwani Kumar1*, Sandeep Dhundhara2 and Yajvender Pal Verma3
1Department of Electrical Engineering, National Institute of Technology Kurukshetra, Kurukshetra, India
2Department of Basic Engineering, COAE&T, CCS Haryana Agricultural University, Hisar, India
3Department of Electrical and Electronics Engineering, UIET, Panjab University, Chandigarh, India
Abstract
Economics plays a crucial role in fulfilling the sustainable development goals in the current world scenario. The enhanced competitiveness in the current power sector market due to deregulation makes reliable power distribution more of a techno-economic problem than a technical issue. The power loss minimization is a pressing issue while dealing with the distribution network as it is the lion’s share of the total losses occurring in the system. In this study, an analysis is conducted on IEEE 33 bus radial distribution system (RDS) using grey wolf optimization for allocation of photovoltaic panel-based DG (PVDG), wind turbine-based DG (WTDG), diesel DG and energy storage system (ESS) for minimizing the energy losses. Further, the electric vehicle charging stations (EVCS) are optimally allocated along with the real-time pricing demand response technique, and its effects on distribution locational marginal pricing are evaluated. Moreover, the cost-benefit analysis of incorporating the demand response and increasing the number of energy storage systems is studied. The simulated results obtained are promising and make the distribution system more efficient.
Keywords: Demand response, distribution locational marginal pricing, DG allocation, grey wolf optimization, energy storage system
10.1 Introduction
In the current scenario, countries are expected to adhere to the sustainable development goals adopted by the United Nations which are a blueprint for the peace and prosperity of people and the planet both in the present and future. One of the most significant of the sustainable development goals is averting the energy crisis arising due to the population explosion and industrialization. Power loss minimization is among the essential issues while adhering to the sustainable goal. As per studies, the distribution side is estimated to account for around 70% of overall power losses in the power grid, contributing a significant chunk of the total despite its low voltage operations, thus needing proper remedial measures. Deregulation of the power system with the enactment of the Electricity Act of 2003 brought about significant changes in the power sector with the influx of private players into the market. Thus, the economic aspect of the power distribution also became an immensely important feature in the power sector. Further, increased public awareness of environmental impacts along with the legal and international commitments, namely COP26 and the Paris Agreement, forced the government to incentivize renewable generation. Due to power deregulation, environmental concerns, and the depletion of fossil fuels, DG units have been widely linked to the distribution system in recent years. The unidirectional power flow of the traditional power value chain is replaced by the bidirectional flow with the integration of distributed generation. The rising power demands are thus curbed by accommodating the distributed generating sources such as micro-turbines, fuel cells, mini-hydro, battery storage, solar, and wind as nearer to the load as possible, reducing the burden on utility and in turn the power losses. The infiltration of renewable energy resources as distribution generation is increasing, thus reducing the dependency on centralized generation to a greater extent. The integration of the DGs may yield significant technical and economic benefits by feeding loads during peak load periods when energy costs are comparatively higher. However, technical and economic variables impact the penetration and practicability of DG in a particular region. The linking of DG to distribution networks adjacent to the load center potentially influences the direction and magnitude of network power flow, thus affecting the technical and economic bearing of distribution companies’ network operations and planning procedures, whereas the inappropriate allocation of DG units will overshadow all aforementioned advantages. Index-based approaches [1–4], analytical-based [5, 6], and optimization-based methods all have been considered when determining the optimal allocation of DG [7, 8]. Various optimization methodologies have already been utilized to achieve diverse distribution system objectives. Genetic Algorithm [9], Bird Swarm Algorithm [10], Bat Algorithm [11], Grasshopper Optimization Algorithm [12], Particle Swarm Optimization [13–15], Bat Algorithm [16] Whale Optimization [17], Bald Eagle Search [18], Water Cycle Algorithm [19], Gravitational Search Algorithm [20] and Grey Wolf Optimization [21] have recently been used to calculate the best allocation of DG.
In this chapter, the optimal allocation of renewable DGs alongside thermal DG and energy storage system are evaluated on IEEE 33 bus radial distribution system. The EVCS is allocated at optimal positions considering not only the technical aspect but also the area served by it during its allocation. The analysis is carried out by modeling the load to make it more proximate to the real-time conditions. In addition, the chapter evaluates the cost-benefit analysis of increasing the number of energy storage units in the optimally allocated setup. Moreover, the effect of demand response techniques on the distribution location marginal pricing is evaluated and the cost-benefit analysis is obtained; incorporating the amount of energy storage units and the impact of the demand response technique is also studied. Moreover, the effect on the voltage profile of the system is observed with the implementation of demand response techniques and optimal allocation of DG power injection.
Grey wolf optimization is utilized for solving an optimization problem due to its prominent advantages over other similar optimization techniques because of its simple structure. Due to its structural advantage, the storage space requirement is reduced and with only two adjusting parameters it is simple and quick along with a fast convergence rate because of the diminished search space and fewer decisions. The results are obtained for an IEEE 33 bus distribution test system.
10.2 Distribution Generation and Energy Storage System
Distributed generation has been prominent in recent times but there is still some ambiguity surrounding the precise definition of DG. Although many scholars and organizations define it differently, it may be classified broadly based on size, position, voltage levels, penetration levels, fuel type, etc. Both renewables and non-renewables can be utilized as DG units. Most commonly used DG systems are PVDG, WTDG, fuel cells, natural-gas-fired REs, and diesel or gasoline-fuelled emergency backup generators. Sources like solar, wind, hydro, tidal, and geothermal are some of the renewable sources from which energy can be tapped, but among these solar and wind are the world’s fastest growing because of ease of availability. Table 10.1 shows various kinds of DG used for various distribution sectors along with the performance factors.
Table 10.1 Types of DGs and their performance parameters.
| Distribution generation | Availability | Stability | Voltage control | Response speed |
|---|---|---|---|---|
| Biomass | Good | Good | Yes | Fast |
| Geothermal | Good | Good | Yes | Medium |
| Pumped Hydro | Good | Good | Yes | Fast |
| Solar Thermal | Uncertain | Poor | Uncertain | Variable |
| Photovoltaics | Uncertain | Poor | Uncertain | Fast |
| Wind | Uncertain | Poor | Uncertain | Fast |
| Low-head hydro | Variable | Good | Yes | Fast |
The increasing congestion in the existing power system coupled with the lack of land availability for traditional power value chain construction has become an issue of concern for power sector companies. In addition to this, the increasing cost of fuels in the backdrop of liberalization and privatization of the electric market altogether raised the need for DG integration. With this background the DG technologies have emerged as reliable and viable alternatives for the customers and further due to the governmental support in the form of subsidies and policies towards the integration of renewable energy sources as DG, making them even more popular among the masses.
10.2.1 Renewable Energy in India
India’s geographical location is a godsend for the utilization of renewable energy, with 300 sunny days and a coastline of 7500 km, both of which benefit the solar and wind industries, respectively. Additionally, the Indian government’s backing of renewable energy sources integration owing to its obligation towards international commitments like achieving net-zero emission by 2070 as proclaimed at COP26 further benefitted the industries. India is well on track to fulfilling these commitments, having increased its renewable energy capacity by two-thirds between April 2014 and January 2021. Globally, India today stands as 4th renewable energy power capacity, 4th in wind power and 5th in solar power capacity. Figure 10.1 shows the current renewable energy capacity of India. The Indian government’s commitment to renewables is reflected in policies such as the Jawaharlal Nehru National Solar Mission and the Faster Adoption and Manufacturing of (Hybrid &) Electric Vehicles in India (FAME) [22]. These schemes will help decrease thermal generation, reducing the burden on foreign reserves whose significant share is the purchase of fossil fuels, while simultaneously creating a massive amount of sustainable jobs for the nation’s youth.

Figure 10.1 Indian renewable energy sector. [Source: Ministry of New and Renewable Energy.]
10.2.2 Different Types of Energy Storage and their Opportunities
The present power system network is transforming the grid from the conventional to the smart grid with the amalgamation of conventional sources of energy and renewable energy sources (RES). With the intermittency of the RES, new options of energy storage technology are emerging to mitigate floating solar and wind power. The storage technologies are undergoing innovation to improve the performance of the grids.
A wide variety of different types of energy storage options are available for commercial use in the energy sector. These are emerging as the technology component in the energy systems to meet growing energy demand and balance the load demand mismatch. With the need for growth of energy storage in the electricity sector, so many technical challenges are emerging that require a range of solutions with the coordination of different storage devices and demand response program.
Utilities are looking for different ways and means to store energy that is produced at low load hours which can be used later to reduce imbalances between energy demand and energy production. Applications of energy storage devices are becoming more widespread and diverse with the growth of variable wind and solar power. With the output of wind and solar dependent on the local weather, variability can occur on different timescales; energy storage systems can provide fast responsive actions meeting variations in supply and demand.
The different types of energy storage systems can be categorized as:
- Battery Energy Storage
- Thermal Storage
- Mechanical Storage
- Pumped hydro Storage
- Hydrogen Storage
These different storage devices have applications in different sectors like electricity, transport, heating of buildings, etc.
- Battery storage systems: Batteries are based on electrochemical technology that are comprised of a combination of cells. It is one of the oldest and most widely used forms of storage. Batteries may be of different types such as lithium-ion, and lead acid, and others can be of solid battery types like nickel-cadmium and sodium-Sulphur. Other types in the battery storage category contain liquid electrolyte solutions, such as vanadium redox and iron-chromium and zinc-bromine solutions. Super-capacitors are based on electrochemical technology that has a variety of applications in electrical utility but are not batteries.
- Thermal storage: Thermal storage devices are based on the physical capability of the absorption and release of heat or cold in a form of solid, liquid, or air that involves changes in the physical state of the storage medium, which can be a gas to liquid or solid to liquid, and reverse. Thermal storage technologies include energy storage with phase change materials that can be molten salt and liquid air or cryogenic storage having the capability of storing heat/cold for a longer duration. Molten salt as a thermal storage system has emerged as the commercially viable solution with concentrated solar power. Phase change materials are playing a key role in storage technology.
- Mechanical storage: Mechanical storage systems are the simplest. They utilize the kinetic energy of rotation/gravitational energy to store energy in the form of mechanical energy as storage. The main options for mechanical storage are energy storage with flywheels and compressed air systems.
- Pumped hydro storage: Pumped hydro systems based on large water reservoirs are one of the best solutions offered as an energy storage system and have been one of the solutions used by the utility to meet load demand during peak hours. Such storage systems require water cycling between two reservoirs placed at different levels that store the energy in the potential form of energy in the reservoir located at a higher level. The power is generated when water stored in the reservoir at a higher level is released to the lower reservoir. The pumped storage is one of the best options to meet the variability of wind and solar power and to meet the load impedances in a short time frame.
- Hydrogen storage: Hydrogen storage systems are an emerging energy storage technology in the future. It involves its conversion from electricity via electrolysis for storage in tanks. From there it can later undergo either re-electrification or supply to emerging applications such as transport, industry, or residential as a supplement or replacement of gas.
Each of the different energy storage technologies has an impact on the system operation and needs to be considered for analysis and implementation. Key issues that need to be assessed are the charge, discharge profiles, storage capacity/capability, and potential scalability of the different storage devices. In addition, the cost of the storage, and the expected lifetime in terms of cycling frequency before degradation are some of the key issues that also need to be addressed in a cost-benefit analysis.
10.2.3 Distributed Generation
DG installation severely impacts various aspects of the power system, notably line losses, voltage profile, degree of injected harmonic, short circuit current, and systems reliability and stability. However, the system’s reliability and stability would deteriorate on the installation of DG units at inconvenient places and of varied sizes, thus distorting the voltage profile and enhancing system losses rather than enhancing reliability and sustaining system stability making the optimal allocation of DG an issue of great importance.
10.2.3.1 Solar Photovoltaic Panel-Based DG (PVDG)
The solar radiation for the examined region of Bhuj, Gujarat, is acquired to compute the output power of the unit PV module using eq (10.1) with the parameters specified in Table 10.2 [23, 24]. The power generation profile of PV system is displayed in Figure 10.2.

Table 10.2 PVDG unit specification.
| Parameters | Data |
|---|---|
| PV panel rating (Prated) | 1 kW |
| Temp coefficient of power (KT) | -0.44% |
| Derating factor (Df) | 0.88 |
| Solar radiation incident (G) | 0.9873 kW/m2 |
| Standard incident radiation (Gref) | 1 kW/m2 |
| Current temp. (Tc) | 33.83 ◦C |
| Reference temp. (T ) ref | 25◦C |
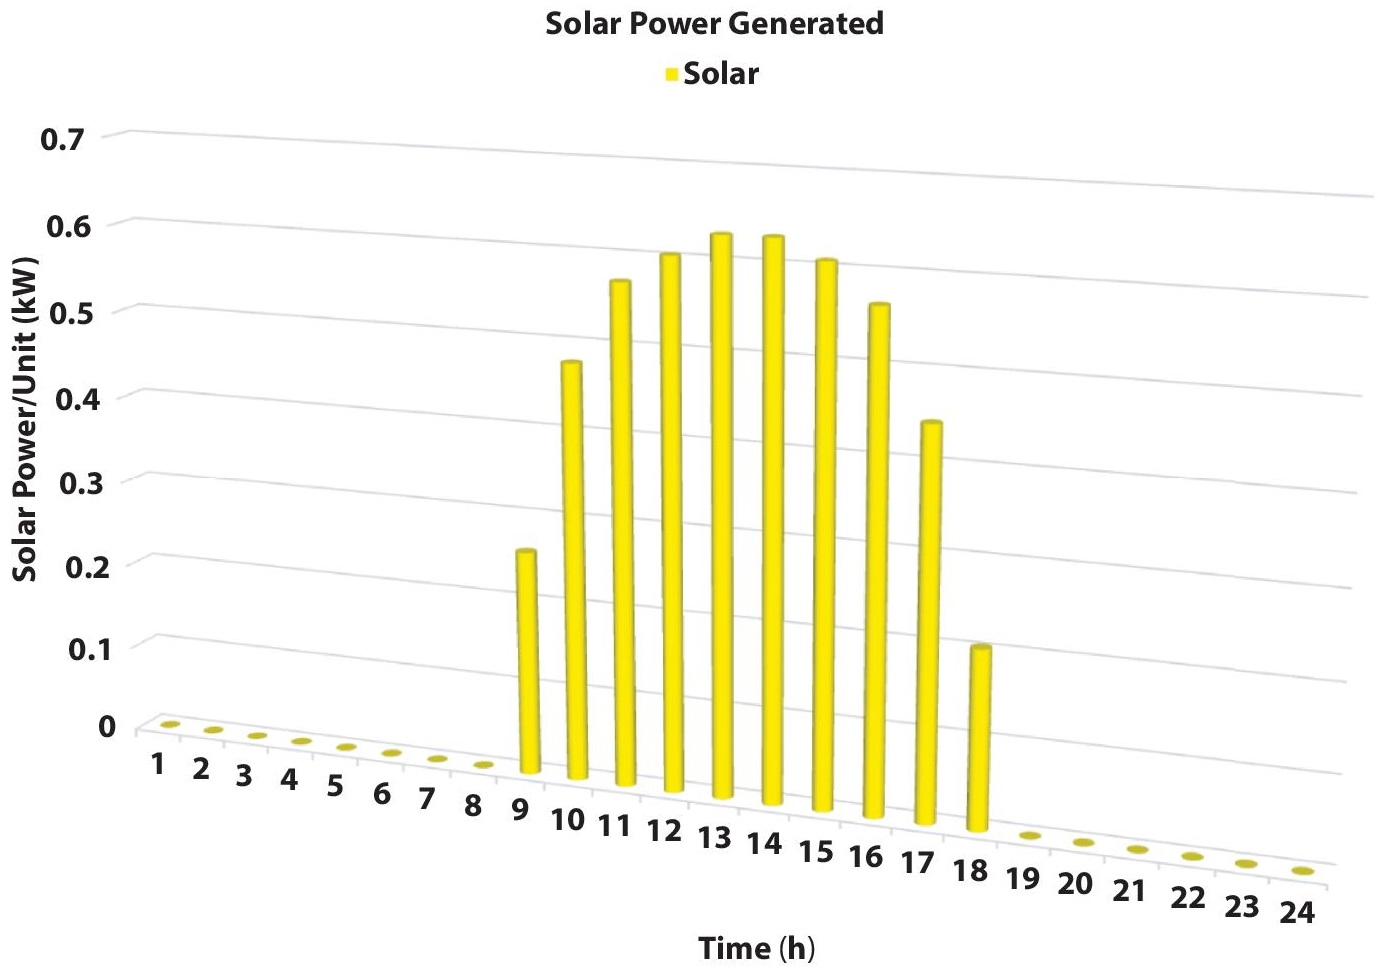
Figure 10.2 PVDG generation profile.
The total solar power generated can be calculated by using eq (10.2)
10.2.3.2 Wind Turbine–Based DG (WTDG)
The speed of wind for the examined region of Bhuj, Gujarat, is acquired to compute the output power of the unit WT module using eq (10.3) with the parameters specified in Table 10.3 [23, 24].

Where, V(t) and Vr(t) are the wind speed at the desired & reference height, respectively, which is calculated by using eq (10.4) and total wind power generated using eq (10.5). The power generation profile of wind turbine generator is displayed in Figure 10.3.
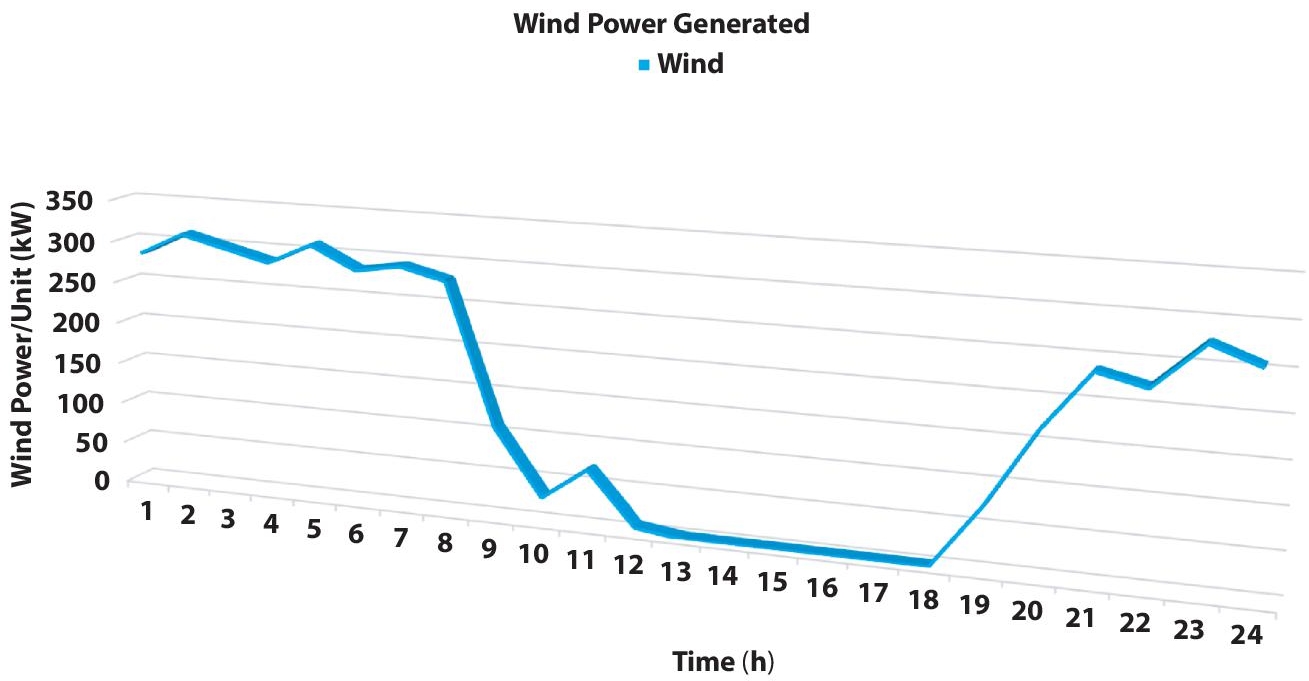
Figure 10.3 WTDG generation profile.

Table 10.3 WTDG unit specification.
| Parameters | Data |
|---|---|
| Rating of wind turbine (Prated) | 1500 kW |
| Rated speed of turbine (Vrat) | 14 m/s |
| Reference height (Href) | 10 m |
| Friction coefficient (γ) | 1/7 |
| Cut-in speed (Vin) | 3.5 m/s |
| Cut-out speed (Vout) | 20 m/s |
| Speed at reference height (Vr) | 2.973 m/s |
| Height of shaft (HT) | 75 |
10.2.3.3 Load Model and Load Profile
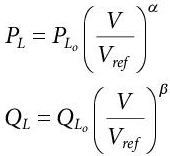
An overwhelming bulk of load flow studies consider the loading in the system to be constant during the analysis but this assumption is far from reality. On the other hand, load variation is a significant factor in distribution system analysis. The loading of the system depends immensely on the operating conditions of the system; therefore, its effect needs to be considered for power deployment. The realistic distribution system incorporates all types of loading, namely residential, industrial and commercial, and the system’s frequency and voltage play a pivotal role in the analysis. However, as the frequency of the system cannot be altered locally, acclimating load voltage will vary total power consumption according to the equations given below with the parameters for voltage dependency of the various loading stated in Table 10.4 [25].
 (10.6)
Each bus incorporates all three types of loads in modest amounts of the overall load at any stipulated time and the total load on any stipulated time is calculated using eq (10.7). The proportion for every type of load in total load varies with time, as seen in Figure 10.4 [26] along with the load factors for the day taken into account [27].
Table 10.4 Load modeling parameters.
| No. | Load types | α | β |
|---|---|---|---|
| 1. | Industrial | 0.18 | 6 |
| 2. | Commercial | 1.25 | 3.5 |
| 3. | Residential | 0.72 | 2.96 |
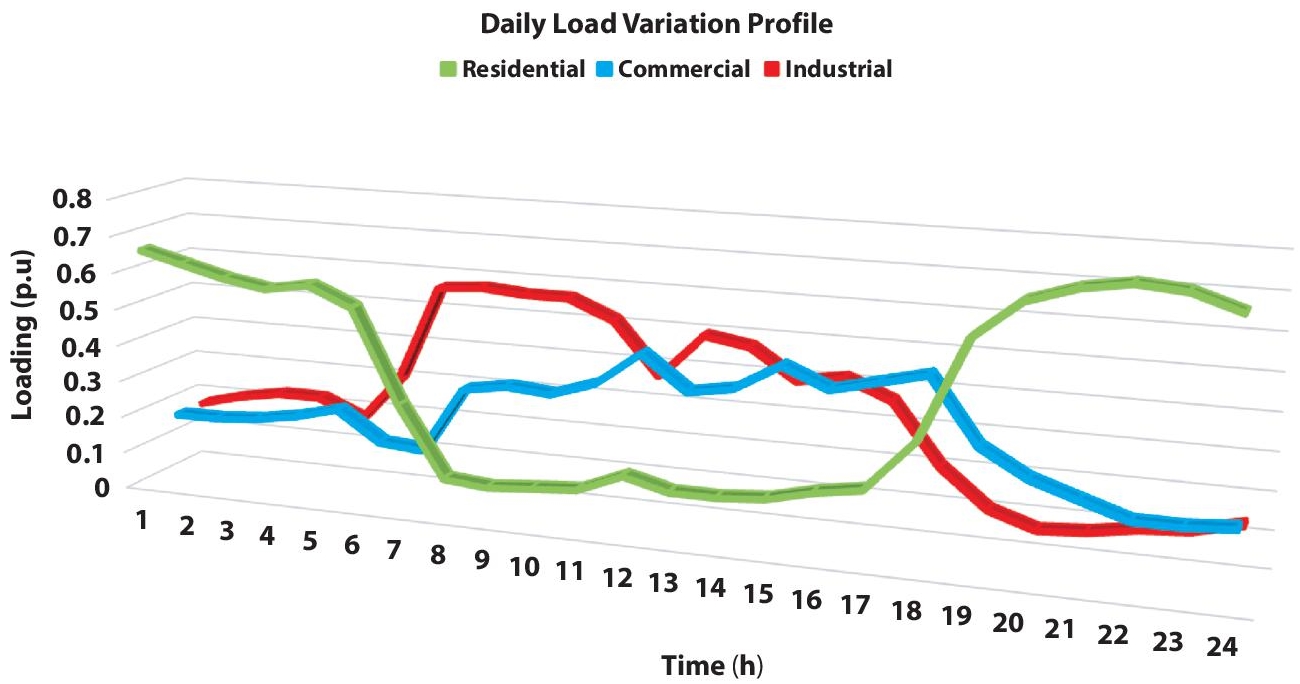
Figure 10.4 Load variation profile of a day.
10.2.4 Demand Response Program
Demand-Side management is planning, implementing, and evaluating activities formulated to encourage customers for modifying their energy consumption by implementing the three broad measures to elicit consumer response. Firstly, the consumers can mitigate their power usage during peak periods when tariffs are usually higher without disrupting their trends during off-peak periods. Secondly, consumers might adapt to high expenses by migrating certain peak demand consumption to an off-peak period. The last type of consumer response is the on-site generation of power by allocation of DG [28–30]. The demand-side management programs can be categorized into two categories, namely energy saving or conservation process and load management programs. Load management or rather commonly known as demand response programs are highly favored, thus further discussion will be based on demand response techniques. Demand response refers to variations in power usage by end-use customers from their customary consumption patterns as a response to changes in power prices across the board. The demand response techniques can be further classified as incentive-based programs and price-based programs [31]. Further segments of incentive-based programs are as follows:
- Market-Based: The market forces incentivize the consumers for their active participation by submitting offers for load reduction. Although large consumers can participate directly there is provision for even small consumer participation via indirect means.
- Direct Control–Based: The utility directly controls a specific type of appliance with the right for interruptions owing to economic or reliability reasons in the end-user premises without any pre-notification and engaging the participation of a large number of consumers. They control the number and duration of interruptions without compromising the comfort level of the participating consumer while compensating them with benefits while billing.
- Curtailable-Based: They are basically for medium and large consumers who are being incentivized for curtailing their specific loads for a specific time. These curtailments are mandatory and failure to comply may lead to penalties.
On the other hand, the price-based programs can be mainly segmented into the following:
- Time of Use (TOU): Traditionally end users charged with flat prices depicting the average cost of supplying electricity were not considerate of the varying cost of electricity. The TOU pricing reflects the variation of cost with time with the variation to day or season. The use of stepped rate reflects the average market price during consumption rather than the day-to-day volatility of cost.
- Critical Peak Pricing (CPP): Though the long-term supply cost is addressed by TOU there is still a need to capture the short-term cost. They superimpose the variation in rates owing to system criteria on either TOU rates or flat rates. The contractual understanding fixes the maximum number of periods for the application of CPP rates. There are two variates of CPP, Extreme Day pricing (EDP) and Extreme Day CPP (ED-CPP). The first applies higher rates for the entire day in case of the extreme day while the latter uses peak and off-peak rates only for extreme days while the rest of the days are computed by flat rates.
- Real-Time Pricing (RTP): In this, the energy prices are updated at very short intervals. This charges the consumers according to the hourly fluctuating rates that reflect the cost of power in real-time scenarios in the wholesale market by noticing the consumers of the price changes on an hourly or daily basis. Customers that engage in DR programs can expect to save finances on their power bills if they avert their usage during peak hours [29].
The impact of the demand response technique can be determined by a reduction in the cost of peak demand saving with the reduction in peak demand expressing the potential of the demand response strategy. The reduction of peak demand along with energy consumption enhances the capability of the distribution system for supplying additional loads without the need for additional investments. Reduction in peak demand consequently aids in a reduction in construction cost and investments along with lower power tariffs thus diminishing the average price of energy. Cost of saving also includes the costs avoided for expansion required to meet the demand without a demand response strategy in addition to some operating cost savings; on the other hand the cost incurred during implementation of a demand response strategy also varies. The demand response technique also helps address the power shortage issues along with efficient management of system resources over time, avoiding involuntary outages and reducing the heavy cost incurred during power interruptions.
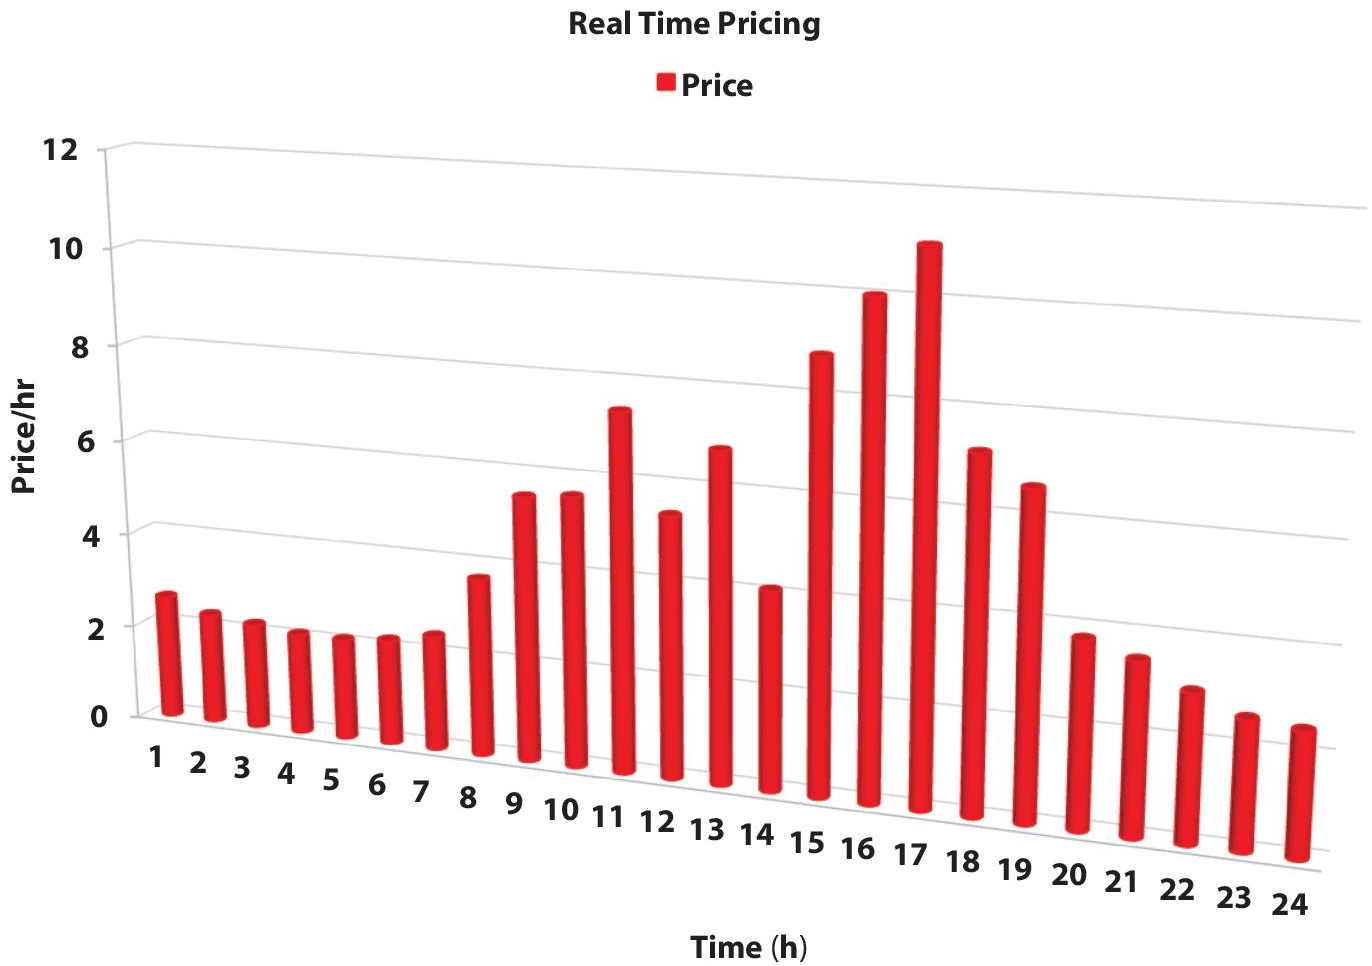
Figure 10.5 Real time pricing.

Figure 10.6 Variation in load curve due to RTP DR.
Various demand response techniques are utilized for gaining economic benefits but according to the beliefs of many economists RTP schemes are the most expedient DR programs viable for the competitive power sector, and governments should prioritize them. Due to better effective infrastructure utilization, overall power rates are destined to drop. On application of the RTP-DR technique, the peak-to-average ratio diminishes due to the shifting of load from the peak period to the off-peak period from 1.22 in the base case to 1.09 on the application of RTP-DR. The RTP scheme is indicated in Figure 10.5 [32] and the variation in the load profile on the application of the RTP-DR scheme is depicted in Figure 10.6.
10.2.5 Electric Vehicles
A transformation in the century-old automobile industry is imminent due to the spike in the price of fossil fuels. Adding to the economic issues the transportation sector contributes about a quarter of greenhouse gas (GHG) emissions, thus having a negative effect on the environment. As already discussed, India’s commitments on international platforms to contain pollution and reduce carbon footprint forces the country to prepare itself for a shift toward EVs by 2030 [33]. These EVs are energy efficient, generating less GHG emissions and reduced noise. The EVs cut emissions and reduce the dependency on imported fuel, thus relieving India’s FOREX against the vulnerability against crude prices and currency fluctuations. Although the capital required for EV is on the higher side but the low running and maintenance cost compensates for it. Low energy consumption and power tariffs result in lower running costs. EVs are propelled via electric motors along with a rechargeable battery or other portable energy storage device for maintaining the power supply. The different categories of EVs are namely HEV, PHEV, and BEV.
- Hybrid electric vehicles (HEVs): They are both fuel and electric powered with the battery system being charged by the power generated by the breaking system.
- Plug-in hybrid electric vehicles (PHEVs): They are similar to HEV but with a smaller engine and battery system with the charging done by either breaking system or by plugging into an external source.
- Battery electric vehicles (BEV): These depend on only the combination of battery and electric motor for propulsion with the charging dependent on external plugging points.
With the government’s initiative for the reduction in petrol-driven vehicles, while giving a boost to electric vehicles due to various environmental, economic, and international relational reasons, there has been a significant investment in electric mobility. Electric vehicle charging stations (EVCSs) which are essential infrastructure for EVs, are now being erected with government and private sector backing. Accessibility to renewable DGs on a large scale and widespread usage of electric vehicles have boosted clean energy consumption and enhanced the long-term viability of power grid development. However, concerns like power quality reductions, voltage overruns, and a surge in system losses have emerged simultaneously. Their deployment, however, necessitates a thorough grasp of loading patterns; in order to truly comprehend the implications of EVs on the grid, EV load models are required. Figure 10.7 depicts the charging pattern of EVCS [34]. If the grid’s balance is not adequately maintained, a substantial surge in the number of EVs in circulation leads to an increase in power usage, culminating in a blackout. Therefore, its allocation is of utmost importance, but inappropriate EVCS placement has a detrimental effect on the electric grid’s efficiency. Incorporating EVCS into the electric distribution network enhances power loss thus degrading the voltage profile.

Figure 10.7 EV charging profile.
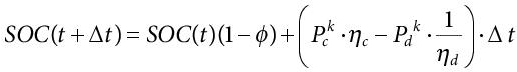
10.2.6 Modeling of Energy Storage System
With the colossal amount of RE integration into the system as discussed in the sections above, the need for peculiar flexible storage systems arises as it acts as a catalyst in India’s race to fulfill its international commitments. Owing to the fluctuating nature of renewable energy sources there is a need for absorption and relinquishing the power as per the grid requirements to always keep up with the demand [35]. The challenge of grid balancing tends to become even more complex due to variable generation and ever-changing demand patterns causing an imbalance both daily and seasonally. While the seasonal imbalances are catered by the market forces the daily variations can be resolved by utilizing the energy storage system. The energy storage system is utilized for the storage of surplus energy during peak generating periods and discharging during off-peak periods. Thus, an energy storage system provides an economically viable option for the flexible and reliable system with the cost of energy storage systems declining sharply in the past decade [36]. Even though the energy storage system has the above-stated advantages it comes with a fair share of challenges attached to itself. The major one is having a grip on the supply chain required for its production, i.e., the availability of lithium, nickel and cobalt are a pressing issue. A thorough diagnosis of the state of charge (SOC) facilitates the measurement of energy by using eq (10.8–10.11) [37].
10.2.7 Problem Formulation
In this chapter, the main objective is to minimize the energy loss in the distribution system. The minimization of the total power loss occurring throughout the day is presented as an objective function in (10.12).

Where the number of branches represented by N and the ![]() representing the real and reactive power following in the branches respectively and
representing the real and reactive power following in the branches respectively and ![]() is the voltage at nth bus at any time instance Δt subject to equality and inequality constraints, namely
is the voltage at nth bus at any time instance Δt subject to equality and inequality constraints, namely
- Voltage constraint: Retention of the distribution system’s power quality.
- Thermal limit constraint: The branch current’s must be well within the conductor’s maximum thermal capacity.
- Power penetration constraint: To prevent backflow, each embedded DG unit’s total active power generation must be less than the network’s total active power consumption.
 (10.15)
- Power Balance Constraints: The active power balance for kth hour at ith bus is represented as
 (10.16)
Where ![]() is the total active power generated from various sources incorporated as seen from the equation below
is the total active power generated from various sources incorporated as seen from the equation below
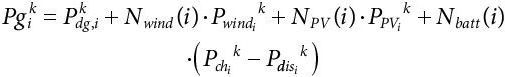 (10.17)
Where ![]()
![]()
![]() , are the active power injected by diesel generators, WTDG, and PVDG. Whereas the Nwind(i), NPV(i), Nbatt(i) represent the number of PVDG, WTDG, and ESS units, respectively alongside with
, are the active power injected by diesel generators, WTDG, and PVDG. Whereas the Nwind(i), NPV(i), Nbatt(i) represent the number of PVDG, WTDG, and ESS units, respectively alongside with ![]() ,
, ![]() being the charging and discharging power of ESS.
being the charging and discharging power of ESS.
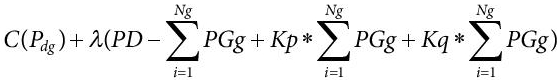
10.2.8 Distribution Location Marginal Pricing
Distribution Locational marginal pricing (DLMP) refers to the marginal cost of supplying the next incremental unit of load (MW) at a specific location. With the high penetration of distributed energy resources alongside the energy storage system and the varying demand of the distribution system, the optimal operation of the distribution system is a challenge, especially with the deregulation of the system having rekindled the interest of DLMP in the current scenario. The increased competitiveness due to this can be ensured by utilizing DLMP as it considers both the technical and economic concerns of the distribution system. Thus creating a chance of having third-party aggregators actively participating in the energy market by supporting their economic decision on sizing and placement of their own DGs. DLMP is adopted to mitigate the congestion on the distribution level associated with high penetration DGs. Thus the LMP depends on the location and size of DG along with the time interval. The real and reactive both power flows are considered for the computation of the DLMP [38]. The losses are computed as percentages and denoted by Kp and Kq.
The Lagrange equation is utilized for the finally obtaining DLMP(λ)
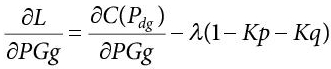 (10.20)
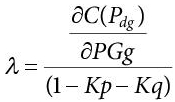 (10.21)
 (10.22)
10.3 Grey Wolf Optimization
Syedali Mirjalili et al. presented the “Grey Wolf Optimizer” (GWO) [39] in 2014, which is a population-based novel meta-heuristic optimization approach based on emulating the social hierarchy and hunting mechanism of a pack of grey wolves. The alphas, though not the strongest, are typically in charge of the decision-making aspects of the pack and their judgments are dictated and enforced throughout the pack by their subordinated betas. They are next in line and are most likely to take over from the existing alphas. The omegas are the least ranked, which makes them always subservient to the rest of the pack. The remaining are the deltas which are below the alphas and betas yet dominate the omegas. Thus, GWO mathematically emulates this hierarchical model of the pack of grey wolves by preserving the optimal solution to be alpha and subsequently making the beta and delta as the second and third best solutions, respectively. The hunting is steered by the alphas, betas, and deltas. Emulating the real-life hierarchy it is assumed that they are the three best solutions knowing the prospective prey’s location. The wolves spread out in quest of prey and converge for encircling of prey and at last attack. To mathematically replicate the attack, a is diminished and consequently, the range of A shrinks as A=[-2a,2a] in which a diminishes from 2 to 0 throughout the course of iterations. To depict this behavior, we employ the variable A with random values with |A|>1 encouraging the grey wolves to diverge from the prey in the hopes of finding a fitter prey, whereas |A|<1 compels the wolves to strike the prey. Furthermore, the C comprises random values in the range [0,2], which endow the prey with random weights. This fosters more random behavior during optimization and aids in the dodging of local optima. C might even simulate the impediments that the wolves confront while approaching the prey in the physical realm, hindering the wolves from acquiring the prey directly and spontaneously. Thus, the social hierarchy, searching, and attacking the prey are all mathematically modeled using the following equations (10.23–10.33)


10.4 Numerical Simulation and Results
The simulation is performed on the most commonly used distribution test system, namely IEEE 33 bus test system. The total power requirement of the test case system is fed by the substation when no distribution generation is equipped. Along with the base loading the system is also integrated with EVCS charging stations at optimal locations thus increasing the loading compared to the test base system. The system time-varying modelling along with the EVCS is analyzed for optimal allocation of renewable DG allocation utilizing the grey wolf optimization and direct load flow [40] is carried out for calculation of various parameters. The analysis proposed the benefits of demand response and battery energy storage devices with the increase in the number of batteries are studied. The analysis is carried out for the four various cases considered as follows:
Case 1 (C1): Optimal PVDG, WTDG, Thermal DG, and 1 ESS without Demand Response.
Case 2 (C2): Optimal PVDG, WTDG, Thermal DG, and 1 ESS with Demand Response.
Case 3 (C3): Optimal PVDG, WTDG, Thermal DG, and 2 ESS without Demand Response.
Case 4 (C4): Optimal PVDG, WTDG, Thermal DG, and 2 ESS with Demand Response.
Table 10.5 shows the cost-benefit analysis of increasing the number of batteries and incorporating the RTP demand response technique. The cost of generation from the thermal DG which is allocated along with batteries and a combination of WTDG and PVDG alongside with the cost of the battery is incorporated. While keeping the renewable power generation the same for all the cases the cost of generation using the thermal DG varies in all cases. Considering C1 as the base case and considering the total combined cost of a single unit of battery to be 50000, the total cost-benefit analysis is considered for the subsequent cases. The cost-benefit analysis observed in the Table shows a benefit of 8.25% in C2 and a 39.79% benefit for C3. The highest benefit seen is of 50.89% in the case of C4.
The DLMP variation depends on the time, location, and sizing of the DGs. The location of the DG is kept constant in the analysis, thus DLMP is affected by the time and sizing of DG which can be collaborated as the operating conditions of power injection via DG throughout the day. Figure 10.8 shows the variation in distributed locational marginal pricing on the implementation of RTP-DR with the variation closely following the load demand curve variation. Thus, it can be observed that the demand response technique has an impact on the location marginal pricing. Figure 10.9 shows the power generated by the thermal DG for all the cases. From the Figure, it can be observed that the increase in the number of the energy storage system and application of the demand response approach individually, as well as their combined implementation, immensely affect the requirement of power derived from the operation of thermal DG. With the total generation from thermal DG reduced by 8.58% on implementation of the demand response technique while by 45.44% on increasing the number of the energy storage device by one, whereas on combining the effect of both the parameters the total thermal DG generation requirement shows a reduction of 56.97%, thus aiding in the cost-saving with combined approach enhancing the saving to an even greater extent.
Table 10.5 Cost-benefit analysis of various cases.
| C1 | C2 | C3 | C4 | |
|---|---|---|---|---|
| Cost of Generation DG ($) | 1239753.6 | 1133319 | 676442.55 | 533407.7 |
| Cost Battery ($) | 50000 | 50000 | 100000 | 100000 |
| Total Cost ($) | 1289753.6 | 1183319 | 776442.55 | 633407.7 |
| % Cost Benefit DG | - | 8.25% | 39.79% | 50.89% |
The voltage profile also shows an enhancement in the application of DG and further in the implementation of the demand response approach which can be seen in Figures 10.10–10.12 with the minimum voltage being 0.9332 p.u, 0.9595 p.u, and 0.9628 p.u for without DG, with DG, and with DG alongside with RTP-DR approach, respectively. Thus, the voltage profile is enhanced with the implementation of DG and further with the integration of demand response techniques. The optimal allocation of DG shows a 2.81% enhancement in the minimum voltage occurrence in the system throughout the entire day, whereas the integration of demand response alongside with DG further enhances the minimum voltage to 3.17% compared to that on the system without any optimal DG allocation or application of any demand response techniques. This improves the power quality of the system, which in turn will boost the profitability of the utility.

Figure 10.8 Variation in location marginal pricing owing to RTP-DR.
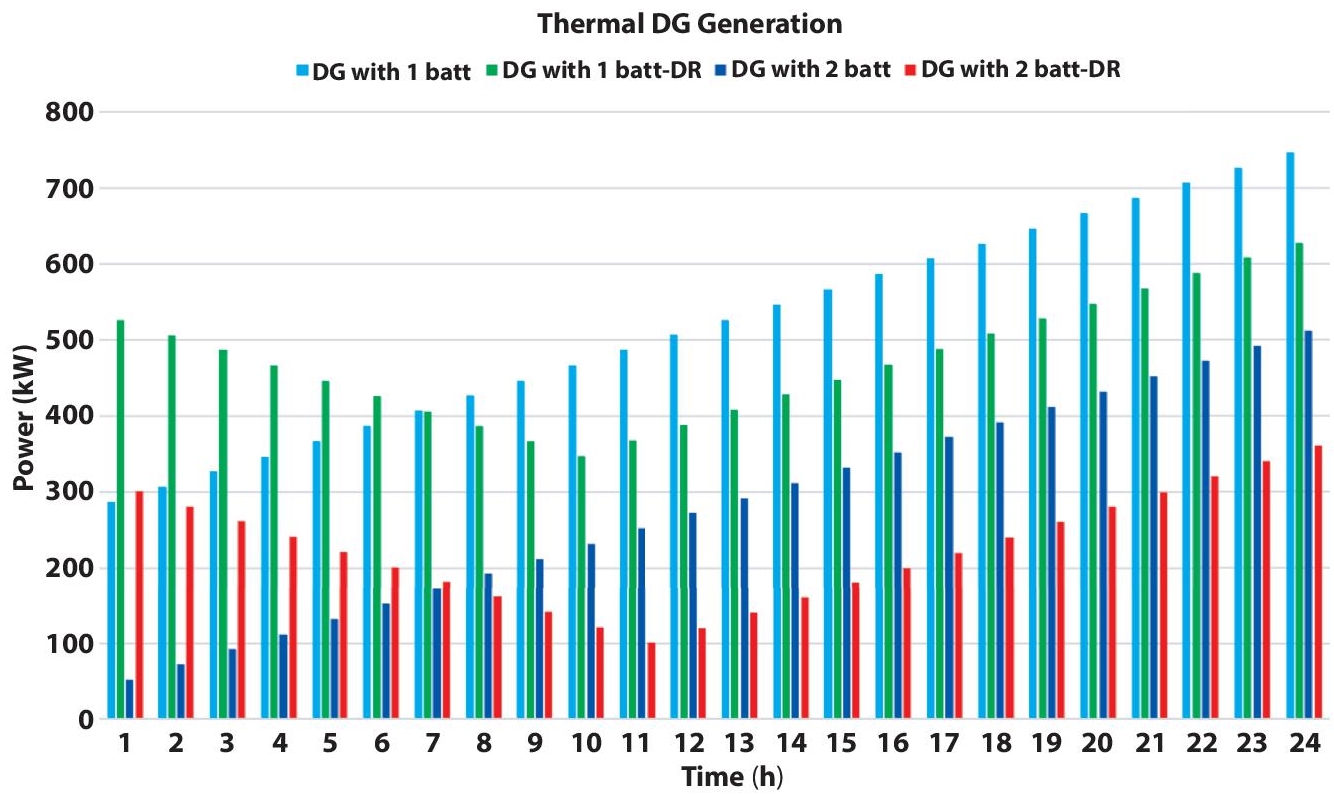
Figure 10.9 Variation in generation from thermal DG for various cases.

Figure 10.10 Variation in voltage profile without DG & demand response.

Figure 10.12 Variation in voltage profile with DG and RTP-DR.
Figures 10.13–10.18 show the battery performances with each showing the SOC charging and discharging power of the energy storage system, for all the respective cases. The percentage SOC is depicted by the black line, whereas the red bars are for discharging power and the blue bars depict the charging power in the figures. The power supplied by the energy storage system is represented by negative power, whereas the power drawn in by the energy storage system is taken positive. The charging and discharging of energy storage systems depends on the availability of either excess or deficit of renewable energy systems. It can be observed that when utilizing only one energy storage system the battery reaches both extreme conditions which in turn adversely affects the battery life, whereas on increasing the number of energy storage units the battery performance enhances much compared to the case when it was operating alone, whereas the secondary battery has a much more stable operation which over time will lead to more cost benefit with the increased battery life.
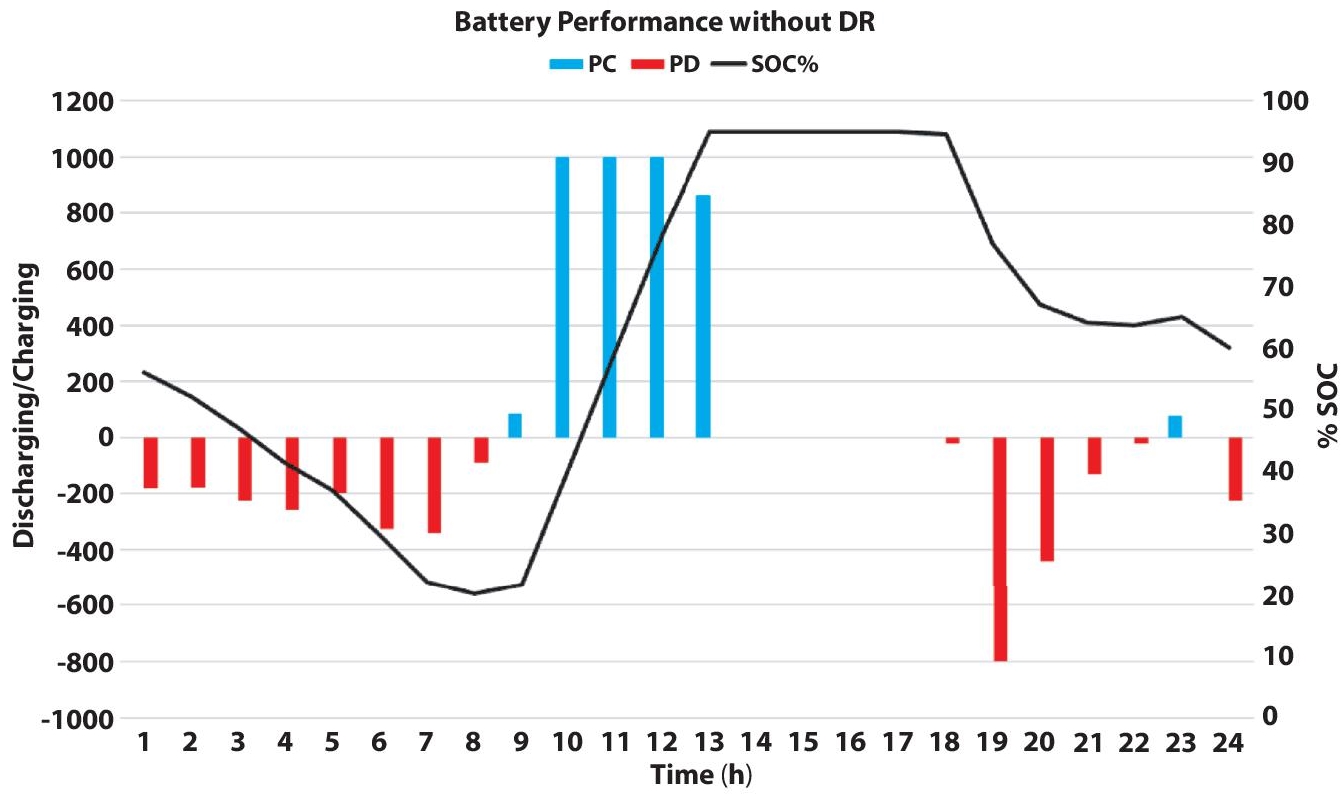
Figure 10.13 Battery performance of single battery without DR.

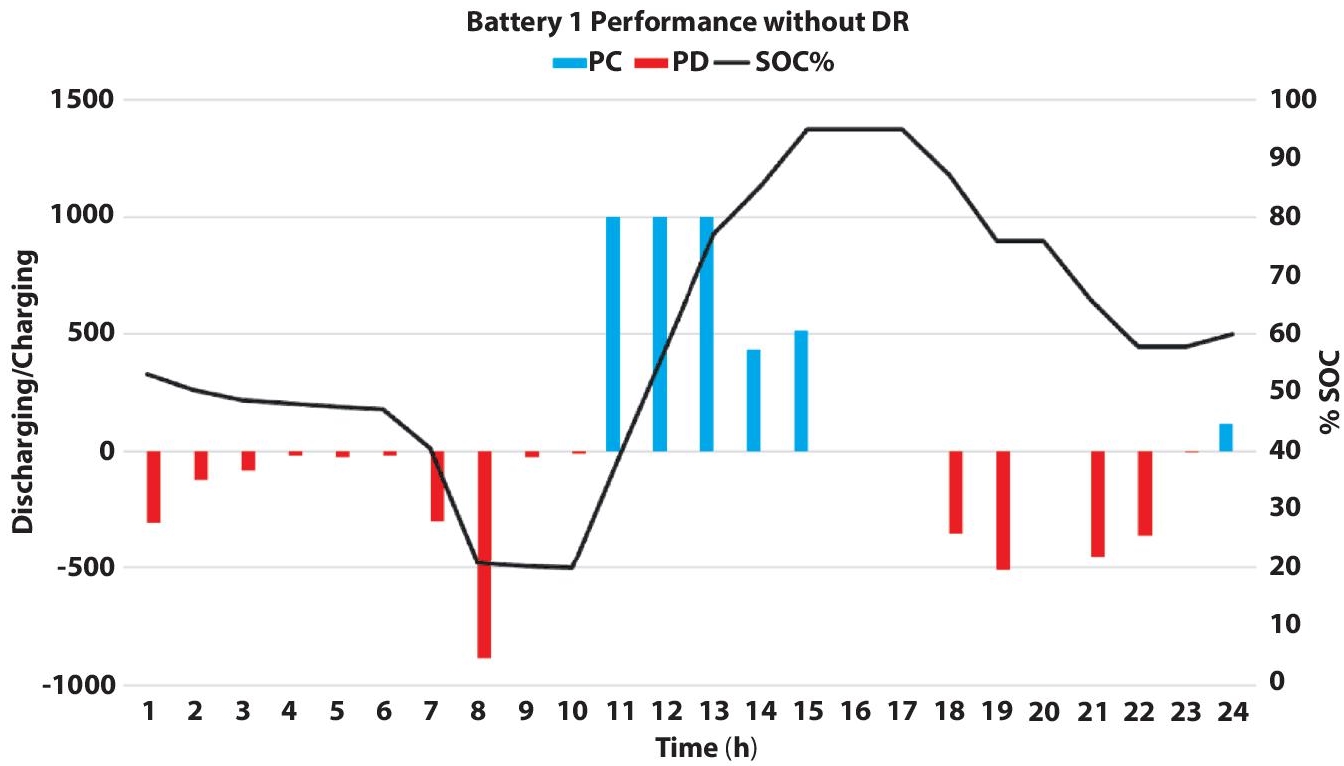
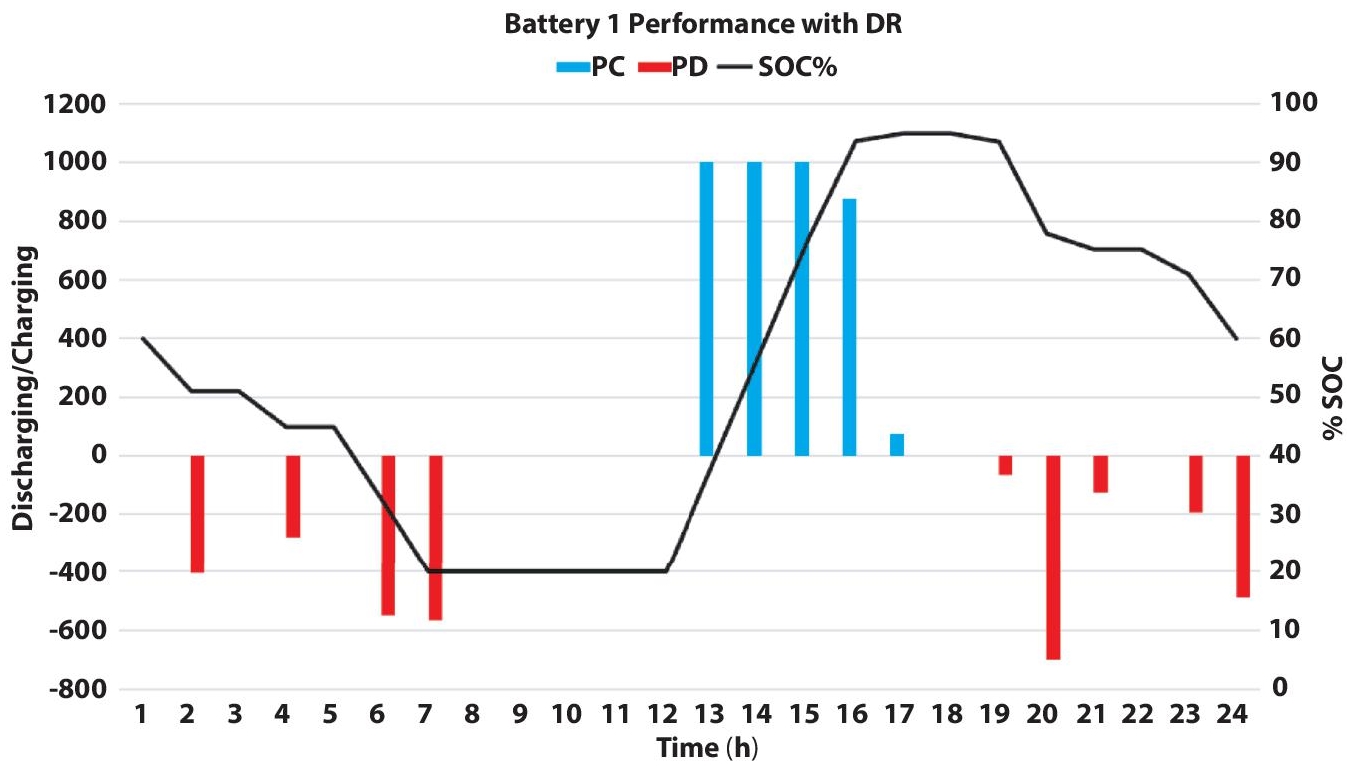
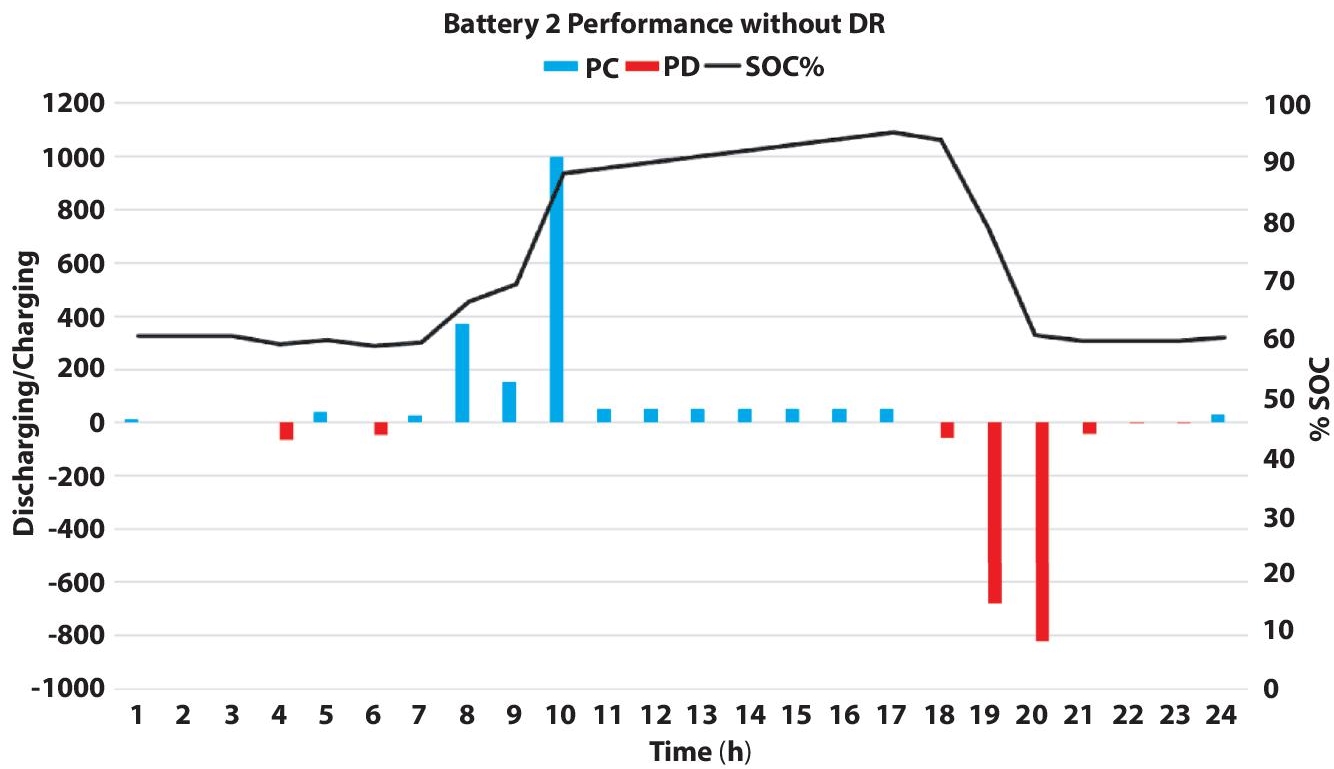
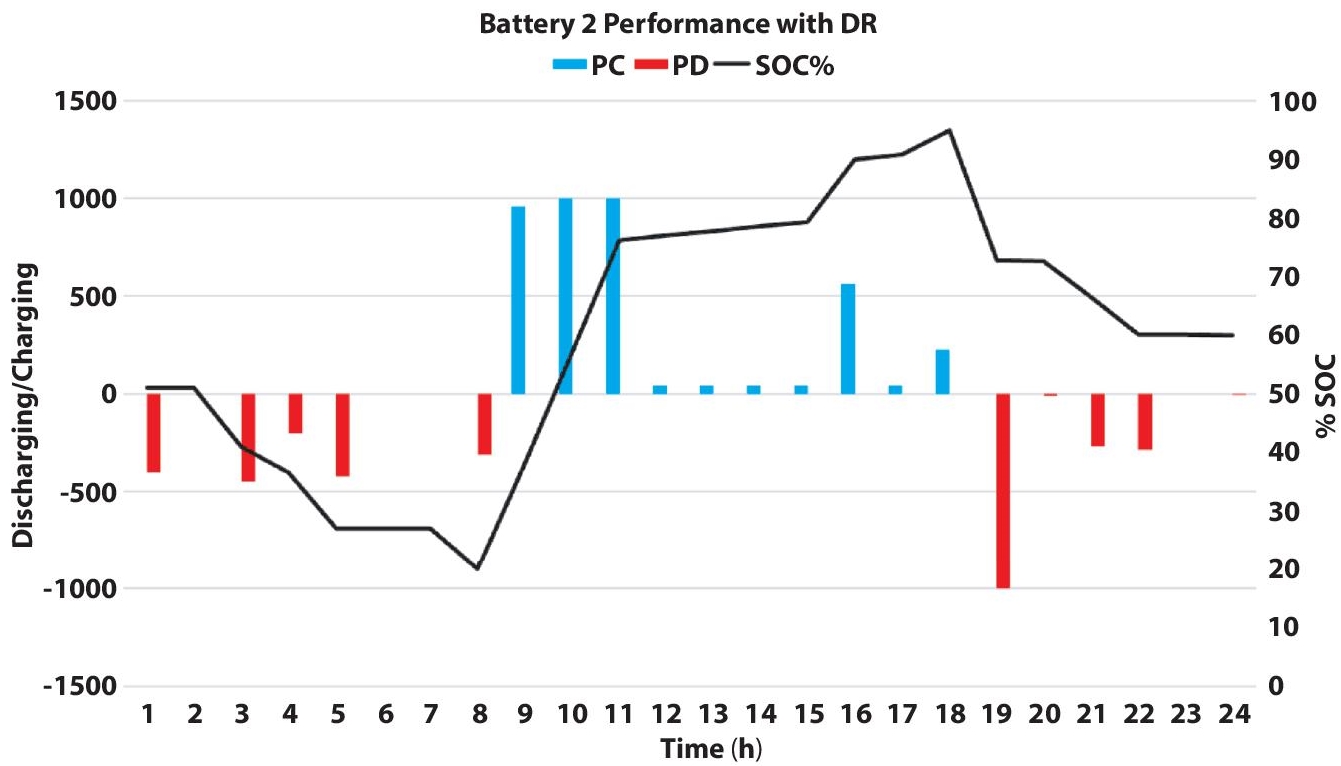
Figure 10.18 Battery performance of 2nd battery with DR.
10.5 Conclusions
The authors investigated the influence of RTP-DR approach and variation in the number of energy storage systems along with the optimally allocated DGs for the minimization of energy losses. It can be observed that the RTP-DR brings down the peak to average ratio, which helps to splay the load curve, thus shrinking the requisite actual power injection to provide for peak load. Thus, this variation in the load curve forces the variation in the operational requirement of the thermal DG unit, which in turn varies the distribution locational marginal pricing. The variation in locational marginal pricing can be utilized to enhance the techno-economic aspects of deployment of DG. Further from the cost-benefit analysis performed it is observed that the implementation of demand response provides a slight benefit but when combined with the increase in the number of energy storage system along with the demand response provides a significantly larger benefit in terms of cost incurred. This analysis will significantly aid the DNO in achieving a better distribution network, considering the RTP-DR approach and the number of energy storage systems needed to be deployed for the effective economic and technical operation for improved system quality and reliability to serve consumers with a better voltage profile and diminished loss reduction, resulting in increased network efficiency.
References
- 1. F. Iqbal, M. T. Khan, and A. S. Siddiqui, “Optimal placement of DG and DSTATCOM for loss reduction and voltage profile improvement,” Alexandria Engineering Journal, vol. 57, no. 2, pp. 755–765, Jun. 2018, doi: 10.1016/j. aej.2017.03.002.
- 2. S. A. A. Kazmi, H. W. Ahmad, and D. R. Shin, “A New Improved Voltage Stability Assessment Index-centered Integrated Planning Approach for Multiple Asset Placement in Mesh Distribution Systems,” Energies (Basel), vol. 12, no. 16, Aug. 2019, doi: 10.3390/en12163163.
- 3. A. R. Gupta, “Effective Utilisation of Weakly Meshed Distribution Network with DG and D-STATCOM,” Journal of The Institution of Engineers (India): Series B, vol. 102, no. 4, pp. 679–690, Aug. 2021, doi: 10.1007/ s40031-021-00597-3.
- 4. J. S. Bhadoriya and A. R. Gupta, “A novel transient search optimization for optimal allocation of multiple distributed generator in the radial electrical distribution network,” International Journal of Emerging Electric Power Systems, vol. 23, no. 1, pp. 23–45, 2022, doi: doi:10.1515/ijeeps-2021-0001.
- 5. S. Azad, M. M. Amiri, M. N. Heris, A. Mosallanejad, and M. T. Ameli, “A novel analytical approach for optimal placement and sizing of distributed generations in radial electrical energy distribution systems,” Sustainability (Switzerland), vol. 13, no. 18, Sep. 2021, doi: 10.3390/su131810224.
- 6. M. Aryanfar, “Optimal Dispatchable DG Location and Sizing with an Analytical Method, based on a New Voltage Stability Index,” International Journal of Research and Technology in Electrical Industry. Journal homepage: ijrtei.sbu.ac.ir IJRTEI, vol. 1, no. 1, pp. 95–104, 2022, doi: 10.52547/ ijrtei.1.1.95.
- 7. M. I. Akbar, S. A. A. Kazmi, O. Alrumayh, Z. A. Khan, A. Altamimi, and M. M. Malik, “A Novel Hybrid Optimization-Based Algorithm for the Single and Multi-Objective Achievement with Optimal DG Allocations in Distribution Networks,” IEEE Access, vol. 10, pp. 25669–25687, 2022, doi: 10.1109/ACCESS.2022.3155484.
- 8. A. R. Gupta and A. Kumar, “Deployment of Distributed Generation with D-FACTS in Distribution System: A Comprehensive Analytical Review,” IETE Journal of Research, pp. 1–18, Jul. 2019, doi: 10.1080/03772063.2019.1644206.
- 9. C. M. Castiblanco-Pérez, D. E. Toro-Rodríguez, O. D. Montoya, and D. A. Giral-Ramírez, “Optimal placement and sizing of d-statcom in radial and meshed distribution networks using a discrete-continuous version of the genetic algorithm,” Electronics (Switzerland), vol. 10, no. 12, Jun. 2021, doi: 10.3390/electronics10121452.
- 10. Sabarinath. G and T. G. Manohar, “Application of Bird Swarm Algorithm for Allocation of Distributed Generation in an Indian Practical Distribution Network,” International Journal of Intelligent Systems and Applications, vol. 11, no. 7, pp. 54–61, Jul. 2019, doi: 10.5815/ijisa.2019.07.06.
- 11. B. Pottukkannan, Y. Thangaraj, D. Kaliyaperumal, M. I. Abdul Rasheed, and M. Petha Perumal, “Integration of solar and wind based dgs with dstatcom in distribution systems using modified bat algorithm,” Gazi University Journal of Science, vol. 32, no. 3, pp. 895–912, 2019, doi: 10.35378/gujs.358228.
- 12. A. A. Ghavifekr, A. Mohammadzadeh, and J. F. Ardashir, “Optimal Placement and Sizing of Energy-related Devices in Microgrids Using Grasshopper Optimization Algorithm,” Feb. 2021. doi: 10.1109/ PEDSTC52094.2021.9405951.
- 13. P. Prakash, “Optimal DG Allocation Using Particle Swarm Optimization,” in Proceedings - International Conference on Artificial Intelligence and Smart Systems, ICAIS 2021, Mar. 2021, pp. 940–944. doi: 10.1109/ ICAIS50930.2021.9395798.
- 14. A. R. Gupta and A. Kumar, “Annual energy savings with multiple DG and D-STATCOM allocation using PSO in DNO operated distribution network,” in Advances in Intelligent Systems and Computing, vol. 698, Springer Verlag, 2019, pp. 1–10. doi: 10.1007/978-981-13-1819-1_1.
- 15. R. Vempalle and P. K. Dhal, “Optimal placement of distributed generators for maximum savings using PSO-SSA optimization algorithm,” in Proceedings of the Confluence 2021: 11th International Conference on Cloud Computing, Data Science and Engineering, Jan. 2021, pp. 624–629. doi: 10.1109/ Confluence51648.2021.9377189.
- 16. S. Salkuti, “Optimal Allocation of DG and D-STATCOM in a Distribution System using Evolutionary based Bat Algorithm,” International Journal of Advanced Computer Science and Applications, vol. 12, Dec. 2021, doi: 10.14569/IJACSA.2021.0120445.
- 17. D. B. Prakash and C. Lakshminarayana, “Multiple DG placements in radial distribution system for multi objectives using Whale Optimization Algorithm,” Alexandria Engineering Journal, vol. 57, no. 4, pp. 2797–2806, Dec. 2018, doi: 10.1016/j.aej.2017.11.003.
- 18. A. Eid, S. Kamel, H. M. Zawbaa, and M. Dardeer, “Improvement of active distribution systems with high penetration capacities of shunt reactive compensators and distributed generators using Bald Eagle Search,” Ain Shams Engineering Journal, vol. 13, no. 6, Nov. 2022, doi: 10.1016/j.asej.2022.101792.
- 19. K. S. Sambaiah, “Renewable energy source allocation in electrical distribution system using water cycle algorithm,” Materials Today: Proceedings, vol. 58, pp. 20–26, 2022, doi: 10.1016/j.matpr.2021.12.569.
- 20. A. Eid, “Allocation of distributed generations in radial distribution systems using adaptive PSO and modified GSA multi-objective optimizations,” Alexandria Engineering Journal, vol. 59, no. 6, pp. 4771–4786, Dec. 2020, doi: 10.1016/j.aej.2020.08.042.
- 21. R. Kandpal and A. Sharma, “Impact of Lockdown on Operation of Distribution System with Renewable Energy Sources and D-STATCOM,” in 2022 IEEE Delhi Section Conference (DELCON), Feb. 2022, pp. 1–7. doi: 10.1109/DELCON54057.2022.9752949.
- 22. A. Ranjan Srivastava, M. Khan, F. Y. Khan, and S. Bajpai, “Role of Renewable Energy in Indian Economy,” in IOP Conference Series: Materials Science and Engineering, Oct. 2018, vol. 404, no. 1. doi: 10.1088/1757-899X/404/1/012046.
- 23. S. Singh, M. Singh, and S. C. Kaushik, “Feasibility study of an islanded microgrid in rural area consisting of PV, wind, biomass and battery energy storage system,” Energy Conversion and Management, vol. 128, pp. 178–190, Nov. 2016, doi: 10.1016/j.enconman.2016.09.046.
- 24. “National Renewable Energy Laboratory (USA). https://www.nrel.gov/research/data-tools.html”.
- 25. K. Mahesh, P. Nallagownden, and I. Elamvazuthi, “Optimal placement and sizing of distributed generators for voltage-dependent load model in radial distribution system,” Renewable Energy Focus, vol. 19–20, pp. 23–37, Jun. 2017, doi: 10.1016/j.ref.2017.05.003.
- 26. V. V. S. N. Murty and A. Kumar, “Mesh distribution system analysis in presence of distributed generation with time varying load model,” International Journal of Electrical Power and Energy Systems, vol. 62, pp. 836–854, 2014, doi: 10.1016/j.ijepes.2014.05.034.
- 27. Y. M. Atwa, E. F. El-Saadany, M. M. A. Salama, and R. Seethapathy, “Optimal renewable resources mix for distribution system energy loss minimization,” IEEE Transactions on Power Systems, vol. 25, no. 1, pp. 360–370, Feb. 2010, doi: 10.1109/TPWRS.2009.2030276.
- 28. Albadi, Mohammed, El-Saadany, and Ehab, “Demand Response in Electricity Market: An Overview.”
- 29. S. Widergren, C. Marinovici, T. Berliner, and A. Graves, “Real-time pricing demand response in operations,” 2012. doi: 10.1109/PESGM.2012.6345195.
- 30. A. K. Lal Karn and S. Kakran, “Operation Management of Microgrid Supplying to the Residential, Industrial and Commercial Community using Different Demand Response Techniques,” Jun. 2022, pp. 1–6. doi: 10.1109/ icepe55035.2022.9798064.
- 31. N. G. Paterakis, O. Erdinç, and J. P. S. Catalão, “An overview of Demand Response: Key-elements and international experience,” Renewable and Sustainable Energy Reviews, vol. 69. Elsevier Ltd, pp. 871–891, Mar. 01, 2017. doi: 10.1016/j.rser.2016.11.167.
- 32. “Live hourly pricing.” https://hourlypricing.comed.com/live-prices/
- 33. A. Khurana, V. V. R. Kumar, and M. Sidhpuria, “A Study on the Adoption of Electric Vehicles in India: The Mediating Role of Attitude,” Vision, vol. 24, no. 1, pp. 23–34, Mar. 2020, doi: 10.1177/0972262919875548.
- 34. L. Sørensen, K. B. Lindberg, I. Sartori, and I. Andresen, “Analysis of residential EV energy flexibility potential based on real-world charging reports and smart meter data,” Energy and Buildings, vol. 241, Jun. 2021, doi: 10.1016/j. enbuild.2021.110923.
- 35. Sandeep Dhundhara, Y.P Verma “Application of Micro Pump Hydro Energy Storage for Reliable Operation of Microgrid System”, IET Renewable Power Generation, vol. 14, Issue 8, 2020.
- 36. S. Dhundhara, Y. P. Verma, and A. Williams, “Techno-economic analysis of the lithium-ion and lead-acid battery in microgrid systems,” Energy Convers. Manag., vol. 177, pp. 122–142, 2018
- 37. B. Singh and A. K. Sharma, “Network Constraints Economic Dispatch of Renewable Energy Sources with Impact of Energy Storage,” International Journal of Computing and Digital Systems, vol. 11, no. 1, pp. 423–440, 2022, doi: 10.12785/ijcds/110135.
- 38. C. Sabillon, A. A. Mohamed, B. Venkatesh, and A. Golriz, “Locational Marginal Pricing for Distribution Networks: Review and Applications.”
- 39. S. Mirjalili, S. M. Mirjalili, and A. Lewis, “Grey Wolf Optimizer,” Advances in Engineering Software, vol. 69, pp. 46–61, 2014, doi: 10.1016/j. advengsoft.2013.12.007.
- 40. J. H. Teng, “A direct approach for distribution system load flow solutions,” IEEE Transactions on Power Delivery, vol. 18, no. 3, pp. 882–887, Jul. 2003, doi: 10.1109/TPWRD.2003.813818.
Note
- *Corresponding author: [email protected]