
12
Energy and Sustainable Development

Statue of famous American folk song writer Woody Guthrie in front of the Grand Coulee Dam on Columbia River in Washington State, USA. Grand Coulee is a multipurpose project for regulation of river flow, flood control, electric generation, and irrigation water for farmlands. Three power stations with total nameplate capacity of 6809 MW is the largest power plant in the US. The pumped storage hydroelectric power plant supports economic development in the region by generating electric energy as well as providing water for agricultural irrigation.
Source: © H&O Soysal
12.1 Introduction
Current state and progress of communities rely on productive use of natural resources. Food and water supply, industrial production, construction of infrastructure, operation of all equipment, and transportation involve use of abundant energy. Deployment of energy sources, on the other hand, interacts with availability of fresh water, clean air, fertile soils, and biodiversity; vital elements for sustainable development.
Energy systems are not isolated from the rest of the world. In fact, energy is the essential part of nature. Energy systems use diverse natural resources as primary energy sources. Energy use, on the other hand, impacts natural resources in many ways. Evidently, consumption of conventional energy sources at the current rate depletes hydrocarbon deposits that have formed over millions of years in the earth. Meeting the largest fraction of the world's energy need by burning fuels pollute the air, water, and soil; all critical elements of life. Air pollution leads to acid rain and global warming, causing changes of the ecosystem and climate in long term.
Energy and water are reciprocally interdependent. Energy systems use water for production of primary sources as well as cooling fluid for thermoelectric power plants. A considerable amount of energy is needed to extract, treat, and convey water for irrigation, industrial processes, and public use. Farming, fishery, dairy products, and the food industry rely on continuous availability of fresh water and energy. In addition, land use to extract and process fossil fuels, building dams for hydroelectric generation and biofuel production competes with agricultural fields needed for food production.
This chapter discusses the interactions of energy, water, and food supply considering pollution and climate change issues. First, effects of energy systems on ground level air pollution, acid rain, and climate change will be reviewed. Then, interactions of energy, water, and food supply will be discussed. Consumption at the users' end will be tracked back to exploitation of natural resources to produce the supplied fuel mix. The last section will discuss the environmental benefits of distributed energy production from clean sources.
12.2 Sustainable Development Goals
Sustainable development of any community depends primarily on energy, water, and food supply. The World Commission on Environment and Development defined sustainable development as “development that meets the needs of the present without compromising the ability of future generations to meet their own needs” (WCED 1987, p. 41). In this definition, the term “needs” includes access to clean water, food, sanitation, services, and high‐quality energy sources for all communities around the world, especially in poor regions.
Maintaining the environment's ability to meet the needs of the future generations is the key factor for sustainable development. Furthermore, the United Nations has set forth seventeen sustainable development goals (SDG) to be achieved by 2030. SDG‐7 specifically targets “access to affordable, reliable, sustainable, and modern energy.” SDG‐6 targets the universal access to affordable, safe, and clean drinking water, as well as sanitation for all individuals. Sustainable development goals SDG‐6 and SDG‐7 are closely interlinked. According to the World Health Organization, 2.1 billion persons around the world have limited access to safely managed drinking water. Many areas without direct access to water do not have access to modern energy systems either.
Domestic water services include availability, quality, and access to main sources used by households for drinking, cooking, personal hygiene, and other uses. In some remote areas, clean water is still extracted from wells or springs using buckets and hand pumps. In some urban areas, insufficient or interrupted water supply enforces individuals to carry water in containers and use limited amounts of water. Most limitations are associated with lack of continuous reliable energy supply to water services (Figure 12.1). Another target of SDG‐6 is reducing the number of populations without managed sanitation services. Wastewater collection and treatment is closely linked to the availability of modern, reliable, and continuous energy services (SDG‐7). A population of about 4.5 billion persons does not have safely managed basic sanitation (WHO/UNICEF 2019). Unreliable energy results in disruptions of adequate water supply, sanitary services, and treatment of wastewater, which all threaten the public health (WHO/UNICEF 2019).
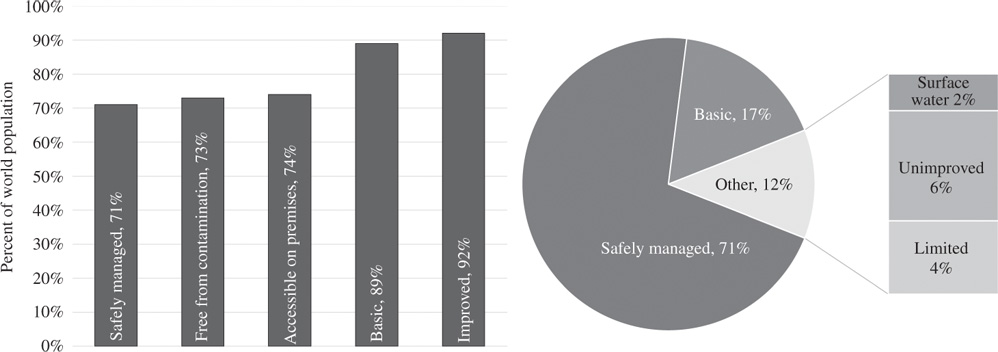
Figure 12.1 World population's access to drinking water.
Source: WHO/UNICEF Joint Monitoring Programme for Water Supply, Sanitation and Hygiene (JMP); https://washdata.org/monitoring/drinking-water (accessed 8/14/2019).
Both access to water and energy impact food supply. SDG‐2 targets ending hunger, achieving food security, and improved nutrition. Supply of irrigation water requires energy. In underdeveloped regions of the world, agriculture is challenging because of freshwater availability. In developing and developed countries water use for irrigation or energy has been debated for decades between agriculture and energy sectors. Energy use for food spans from farmlands to the consumers. While agriculture and fishing are not energy intensive, transforming agricultural produces into food, beverage, and food products is energy intensive. Transportation, refrigeration, and marketing of food products rely on continuous energy supply. Food processing, cooking, and refrigerated food storage constitute a considerable part of residential and commercial energy consumption.
All goals stated in sustainable development agenda of the United Nations directly or indirectly involve adequate supply of energy (UN 2015). Sustainability, reliability, and affordability of energy supply are central to access clean water, modern sanitation, food, and health services. Urban infrastructure, security, quality education, industrial development, and economic growth also depend on uninterrupted energy supply. Goals involving mitigation of climate change and pollution, protection of natural resources on land and water require cleaner energy conversion and efficient use of secondary sources.
12.3 Environmental Impacts of Energy Systems
Energy systems are major contributors of water, land, and air pollution. Fossil fuel and biomass burning power plants and all vehicles using combustion engines pollute air by releasing carbon dioxide, toxic gases, and microscopic particles. Coal burning power plants produce a huge amount of solid waste, which is typically discarded as landfill. Although some part of the solid waste that occurs from burning fossil fuels is used to make industrial materials as a side product, the remaining part pollutes the soil, ultimately reaching plants with ground water. Large power plants use water from rivers and lakes for cooling. If special precautions are not taken, coal‐fired power stations may release toxic compositions containing mercury, arsenic, and lead that are absorbed especially by fish and seafood. Heat discharged to the environment changes the ecosystem. Among all human activities, energy production and use are the main causes of gas emissions that lead to the alarming phenomena known as acid rain and global warming.
12.3.1 Ground Level Air Pollution
Air pollution that occurs at the lowest level of the atmosphere is specified as ground‐level air pollution. Major components of the ground‐level air pollution are toxic gases such as carbon monoxide, sulfur dioxide, nitrogen oxides, ammonia (NH3) compounds, microscopic particles called particulate matter (PM), and volatile organic compounds (VOC).
Carbon dioxide is not considered an air pollutant since it is also produced by the respiration of humans and animals and recycled naturally by plants through the photosynthesis process. But excessive amounts of carbon dioxide released from fuel combustion that the vegetation cannot handle reduce the air quality and cause respiratory problems for humans and animals. In addition, carbon dioxide emission produced by burning fuels leads to other environmental issues that will be discussed in the following sections.
In large metropolitan areas and industrial regions, extreme ground‐level air pollution builds up a dark yellow or brown haze under certain weather conditions. This combination of smoke and fog, commonly called “smog,” contains ground‐level ozone (O3) and a number of chemicals, including toxic gases, carbon dioxide (CO2), soot, dust, and VOC such as benzene, butane, and other hydrocarbons. Smog has several long‐term adverse health effects on people living in metropolitan and industrial areas. However, sometimes wind can carry smog to distant smaller cities and rural locations (EIA 2016).
Carbon monoxide (CO) is formed from incomplete combustion that occurs in wildfires and burning of low‐quality fuels and biomass in traditional stoves. It is a colorless, odorless, and poisonous gas that reduces the ability of red blood cells to supply oxygen to the brain and other organs. Low levels of carbon monoxide slow down body functions, reflexes, and may impair judgment. It more severely affects pregnant women and people with heart diseases. High levels of carbon monoxide, especially in closed spaces, may be lethal.
According to the World Health Organization (WHO), in 2012 nearly three million persons worldwide died prematurely for reasons attributable to outdoor ambient air pollution. Lung diseases including cancer, heart disease, and stroke were among the lethal consequences of air pollution (WHO 2016, p. 44, Table 5). With the current increase of energy supply, the International Energy Agency (IEA) projects this number to reach 4.5 million by 2040.
Energy‐related human activities are main sources of ground level air pollution. Fuel combustion for electric power generation and industrial heating, industrial processes, transportation vehicles, ineffective use of low‐quality fuels and conventional biomass in less developed regions are major sources of human‐caused air pollution.
12.3.2 Acid Rain
All fossil fuels contain a small amount of sulfur, which reacts with oxygen during combustion to form sulfur dioxide (SO2). In addition, various nitrogen oxides represented as NOx (nitric oxide NO, nitrogen dioxide NO2, nitrous oxide N2O, and others) form as fossil fuels burn. Oxidation compounds of sulfur and nitrogen react with water vapor and other chemicals in the atmosphere in the presence of sunlight to form sulfuric and nitric acids. The acidic mixture in the atmosphere dissolves in clouds and fog, then eventually comes down to the ground with raindrops, resulting in the phenomenon called “acid rain.” While the soil can neutralize some part of the acid, the ground water can still be acidic in regions where power plants and heavy industry using low quality coal and oil products pollute the air excessively. Acidic ground water changes the ecosystem in rivers and lakes and damages the plants, ultimately deteriorating forests and vegetation.
12.3.3 Greenhouse Effect and Climate Change
Transparent substances transmit the visible range of the light spectrum at different rates depending on the wavelength. A surface heats by absorbing the sunlight and emits longer wavelength infrared (IR) radiation which is partially blocked by the atmosphere. For instance, we all have experienced that on a sunny and cold winter day a closed space behind glass window warms up. This is because the window glass allows the visible part of sunlight but stops most of the IR reflected from heated interior surfaces. Increased heating caused by this phenomenon is known as “greenhouse effect” because it is used in agricultural greenhouses to grow plants in cooler weather.
Certain gases such as water vapor, carbon dioxide, methane, and others grouped as greenhouse gases (GHG) change the rate at which the atmosphere transmits the IR radiation reflected from Earth's surface that warms up by sunlight during the day. The natural greenhouse effect regulates the temperatures on Earth allowing normal seasonal changes. However, the modified greenhouse effect caused by a combination of gases released from human activities changes the thermal balance of the Earth causing local increase or decrease of temperature.
In addition to the greenhouse effect, the ozone layer at higher levels of the atmosphere (stratosphere) protects the Earth from the ultraviolet (UV) radiations coming from the Sun. It was discovered that certain gases such as sulfur hexafluoride (SF6), hydrofluorocarbons (HFCs), and perfluorocarbons (PFCs) destroy the ozone layer at certain parts of the stratosphere. The combined consequences of the greenhouse effect and depletion of the ozone layer lead to a gradual temperature change in the long term, mostly perceived as “global warming.” Regional changes of average temperatures result in climate change. At the 21st convention of United Nations Framework on Climate Change (UNFCC), 196 countries reached a consensus to limit the global temperature rise 2 °C above the pre‐industrial era temperature levels by the year 2100.
Carbon dioxide, nitrous oxide (N2O), methane, and fluorinated gases (F‐gases) are the main contributors to the greenhouse effect. Figure 12.2 shows the components of the most significant greenhouse gases in the global emission (IPCC 2014). Carbon dioxide and nitrous oxide are the dominant greenhouse gases produced by combustion of fossil fuels, biomass, and solid waste. Fluorinated gases are mostly released during industrial processes. Four sub‐categories of fluorinated gases are hydrofluorocarbons (HFCs), perfluorocarbons (PFCs), sulfur hexafluoride (SF6), and nitrogen trifluoride (NF3).
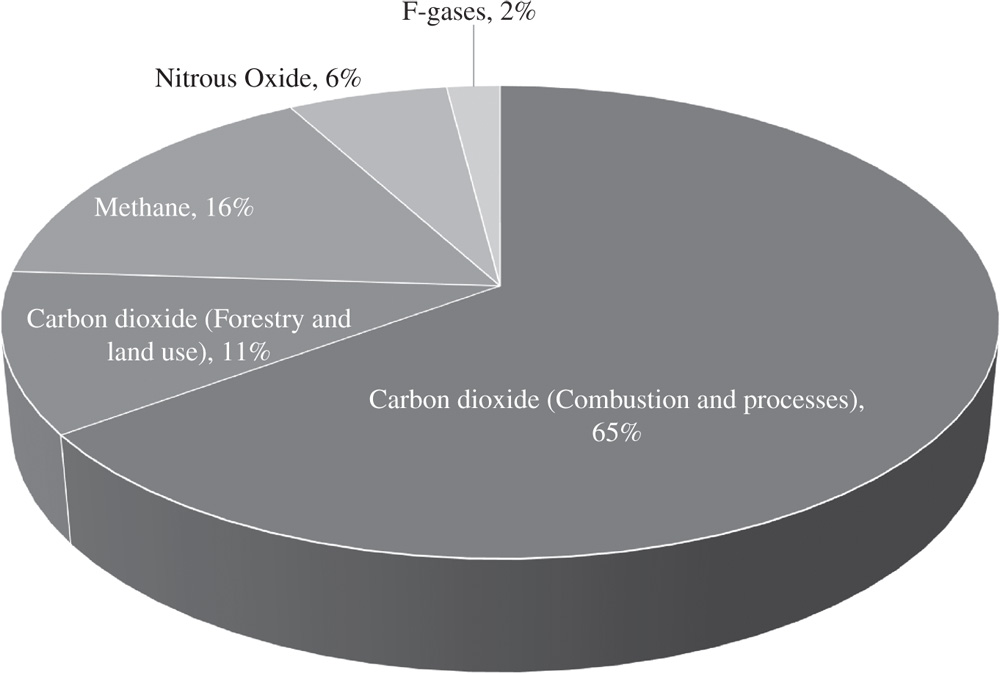
Figure 12.2 Composition of global greenhouse gas emission by mass.
Source: IPCC (2014).
Combustion of fossil fuels releases considerable amounts of carbon dioxide and water vapor resulting from the oxidation of hydrocarbons. Water vapor concentration in the atmosphere is mostly balanced by natural precipitation. Forests and vegetation offset some part of the CO2 concentration in the atmosphere by photosynthesis. However, human activities release much more CO2 than the natural cycle can remove. The excess CO2 contributes to the climate change by increasing the greenhouse effect.
Methane is the largest byproduct of natural gas, therefore it is a valuable fuel. Although in small amounts, natural gas pipelines, and gas and oil processing facilities may leak methane to the atmosphere. A larger amount of methane is discharged naturally from coal mines and oil wells. If the discharged methane is not used on‐site or commercialized as a byproduct, it is freely burned (flared) rather than released into the atmosphere to prevent its greenhouse effect. Methane also occurs naturally from the digestion process of livestock (mostly cows), fertilizers, organic waste, sewages, and swamps. Volcanic eruptions, geysers, mines, and wildfires also release a mixture of carbon monoxide, carbon dioxide, sulfur oxides, and methane to the atmosphere.
Human activities have significantly increased the GHG concentration in the atmosphere over more than 150 years, since the industrial revolution. Fossil fuel fired electric generation, transportation vehicles powered by internal combustion engines, heavy construction and farming equipment, industrial heat production, chemical processes, and building heating systems are major sources of human made GHG emissions. Figure 12.3 shows the share of human activities in global GHG emission.
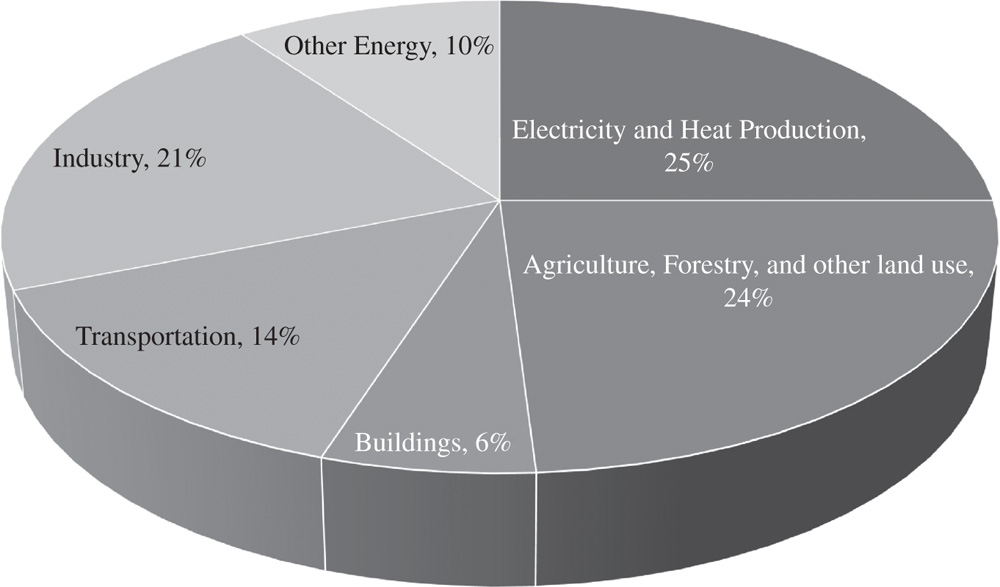
Figure 12.3 Sources of greenhouse gas emission.
Source: IPCC (2014).
The global warming potential (GWP) of greenhouse gases are expressed relative to the equivalent amount of CO2 in the atmosphere that would produce the same greenhouse effect. GWP of CO2 is unity. Although the concentration of methane, nitrous oxide, and fluorinated gases are much lower than carbon dioxide, their lifetime in the atmosphere is longer, and their greenhouse effect is larger. The GWP of methane and nitrous gases released from energy‐related applications are listed in Table 12.1 (IPCC 1996). The largest amount of fluorinated gases is emitted from industrial processes rather than energy conversion.
Table 12.1 Global warming potential of greenhouse gases.
Source: Climate Change 1995, The Science of Climate Change: Summary for Policymakers and Technical Summary of the Working Group I Report, (IPCC 1996, p. 22).
| Global Warming Potential (GWP) | |||||
| Species | Chemical formula | Lifetime (yr) | 20 yr | 100 yr | 500 yr |
| CO2 | CO2 | variable | 1 | 1 | 1 |
| Methane | CH4 | 12 ± 3 | 56 | 21 | 6.5 |
| Nitrous oxide | N2O | 120 | 280 | 310 | 170 |
| Fluorinated gases | CxHyFz | Variable | 460–16,300 | 140–23,900 | 42–34,900 |
The average greenhouse gas emissions of selected fuels are listed in Table 12.2 based on the values compiled by the US EPA Greenhouse Gas Reporting Program. Although the amounts of methane and nitrous oxide are much lower than the amount of carbon dioxide, their greenhouse effects are higher. To obtain the GWP of each gas, the values should be multiplied with the corresponding GWP given in Table 12.1.
Table 12.2 Greenhouse gas emissions from combustion of selected fuels used in USA.
Source: US EPA Greenhouse Gas Reporting Program web site (accessed on 7/25/2019) https://www.epa.gov/ghgreporting.
| CO2 | CH4 | N2O | |
| Fuel type | kg/GJ | g/GJ | g/GJ |
| Anthracite coal | 98.3 | 10.4 | 1.5 |
| Bituminous coal | 88.4 | 10.4 | 1.5 |
| Sub‐bituminous coal | 92.1 | 10.4 | 1.5 |
| Lignite coal | 92.6 | 10.4 | 1.5 |
| Coal coke | 107.7 | 10.4 | 1.5 |
| Municipal solid waste | 86.0 | 30.3 | 4.0 |
| Petroleum coke (solid) | 97.1 | 30.3 | 4.0 |
| Plastics | 71.1 | 30.3 | 4.0 |
| Tires | 81.5 | 30.3 | 4.0 |
| Agricultural byproducts | 112.0 | 30.3 | 4.0 |
| Peat | 106.0 | 30.3 | 4.0 |
| Solid byproducts | 100.0 | 30.3 | 4.0 |
| Wood and wood residuals | 88.9 | 6.8 | 3.4 |
| Natural gas | 50.3 | 0.9 | 0.1 |
| Landfill gas | 49.4 | 3.0 | 0.6 |
| Other biomass gases | 49.4 | 3.0 | 0.6 |
| Biodiesel (100%) | 70.0 | 1.0 | 0.1 |
| Ethanol (100%) | 64.9 | 1.0 | 0.1 |
| Rendered animal fat | 67.4 | 1.0 | 0.1 |
| Vegetable oil | 77.3 | 1.0 | 0.1 |
The amount of greenhouse gas emissions depend on the fuel mix and technology. Table 12.3 shows the estimated average emission factors for common secondary sources delivered to end users. Emission factors for electricity depend on the fuel mix used for generation. Since electric generation stations powered from various primary sources supply an interconnected electric grid and regional interconnections exchange electric power, it is more reasonable to consider the national average emission. Local fuel mix and resulting emissions in the US can be obtained from the EPA Power Profiler web site (EPA 2019b). Table 12.3 also shows emission factors of various fuels burned in commercial boilers, reciprocating engines, and small turbines. The given values include the precombustion emissions that occur during extraction, processing, transformation, and transportation of fuels.
Table 12.3 Emission factors for end‐use of common secondary sources.
Source: Deru and Torcellini (2007, p. 12, Tables 9 and 11).
| Source | CO2 equivalent | Unit |
| Electric generation (US National Average) | 0.76 | kg/kWh |
| Commercial boiler | ||
| Bituminous coal | 2929.00 | kg/ton |
| Lignite | 2437.00 | kg/ton |
| Natural gas | 2.42 | kg/1000 m3 |
| Residential fuel oil | 3595.00 | kg/1000 l |
| Distillate fuel oil | 3222.00 | kg/1000 l |
| LPG | 1927.00 | kg/1000 l |
| Stationary reciprocating engine | ||
| Gasoline | 3139.00 | kg/1000 l |
| Distillate fuel oil | 3212.00 | kg/1000‐l |
| Natural gas | 2.64 | kg/1000 m3 |
| Small turbine | ||
| Distillate fuel oil | 3222.00 | kg/1000 l |
| Natural gas | 2.45 | kg/1000 m3 |
12.3.4 Carbon Footprint of Consumers
Carbon footprint generally refers to the total GWP of all gas emissions caused by energy related activities. Carbon footprint is associated with energy consumption rather than production, and it is expressed in tons of CO2 equivalent gas emission per year. It is not limited to the on‐site direct carbon dioxide emission from burning fuels but also includes the greenhouse effects of all gases released throughout the supply chain of fuels, electricity, and all other energy carriers delivered to users.
Calculation of the carbon footprint requires comprehensive data including GWP of all fuels used on‐site including greenhouse gas emissions that occur during their production, processing, transformation, and delivery. Several institutions have developed spreadsheets and online tools to help consumers estimate their carbon footprint. For example, the Energy Profiler® developed by the US EPA gives the fuel mix used for electric generation in an interconnection and the GWP per unit electricity delivered to consumers. The Carbon Footprint Protocol of the World Resources Institute calculates the carbon footprint of a company, city, country, and other entities. Simple calculations can be made by using GWP of common fuels given in Table 12.3.
The Sankey diagram in Figure 12.4 illustrates carbon emissions produced by energy use in the US in 2014 (LLNL‐DOE 2015). In the flowchart, only the emissions attributed to their physical sources are considered. Since emissions resulting from combustion of fuels in residential, commercial, industrial, and transportation sectors are not shown, the diagram does not realistically represent the carbon footprint of the country. However, it shows the areas where opportunities exist to reduce the carbon footprint of the country.
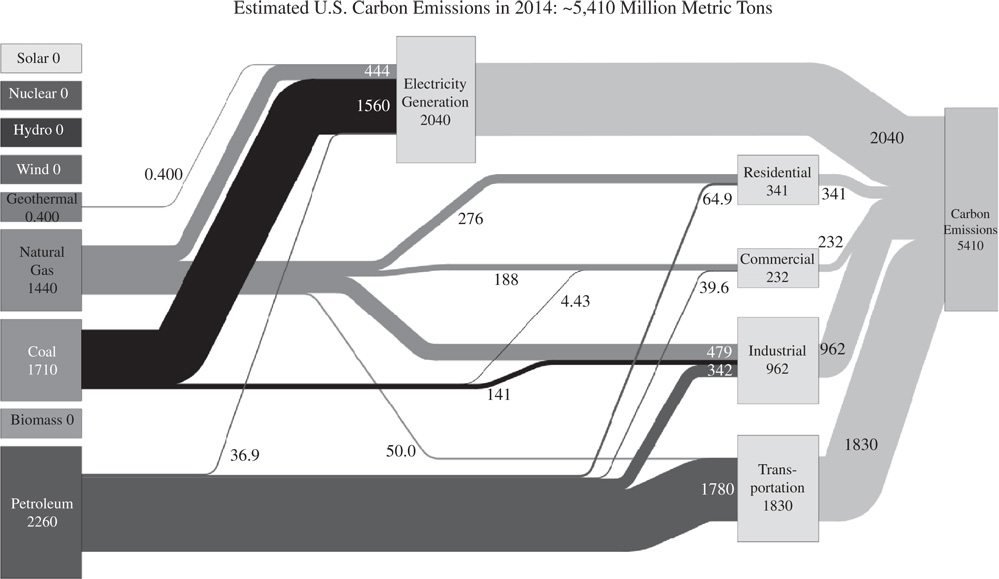
Figure 12.4 Carbon emissions from energy usage of sectors in the USA.
Source: LLNL 2015. Data is based on DOE/EIA‐0035(2015‐03), March, 2015. Prepared by Lawrence Livermore National Laboratory and the Department of Energy.
Electric generation and transportation are the major sources of carbon emissions. Average greenhouse gas emissions and total CO2 equivalent emissions of electric generation plants in the US are listed in Table 12.4. Fossil fuel burning power plants are clearly the major sources of greenhouse gases, and replacing such power plants with renewables would significantly avoid carbon emissions.
Table 12.4 Average greenhouse gas emissions of power plants in the US by primary energy source.
Source: US EPA eGrid database 2016 (EPA 2019a).
| CO2 (kg/MWh) | CH4 (kg/GWh) | N2O (kg/GWh) | CO2 equivalent emission rate (kg/MWh) | |
| Coal | 1278.4 | 140.6 | 21.0 | 1285.1 |
| Gas | 1156.2 | 20.4 | 2.4 | 1133.0 |
| Oil | 1391.3 | 56.7 | 11.1 | 1392.0 |
| Geothermal | 43.2 | 0.0 | 0.0 | 43.2 |
| Biomass | 113.1 | 175.7 | 23.8 | 122.3 |
The US national average of greenhouse gas emission is 760 kg/MWh (Table 12.3). Although regional grids are connected to each other, the energy exchanges to balance load flow do not have a significant effect on local emission rates. Users may approximate the carbon dioxide equivalent emissions due to the consumption of grid electricity on site considering the fuel mix of the utility that supplies their region. Transmission and distribution losses must be added to the on‐site consumption to obtain the total actual electricity delivered from generation plants. In the US, transmission losses range between 4.79% and 5.63%, with the national average of 4.95%. The Power Profiler online calculator (https://www.epa.gov/energy/power-profiler#/) is a useful tool to estimate the contribution of consumers in the US to the greenhouse gas emissions by using grid‐supplied electricity. On‐site electric generation from wind and/or solar energy is an effective way to reduce the end‐users carbon footprint.
The transportation sector mainly relies on petroleum derivative liquids. Electric powered public transportation, hybrid vehicles (HVs), and electric vehicles (EVs) reduce both dependence on petroleum and the carbon footprint. However, electric public transportation and EVs still indirectly cause emissions through electric generation. Therefore, reducing the emissions created by electric generation while increasing the share of electric power in transportation would reduce the carbon footprint of countries more successfully.
12.4 Energy, Water, and Food Interactions
Water, food, and energy are crucial necessities for human life, well‐being, and economic growth of the society. On one hand, water is essential for production of fuels and cooling of power plants. On the other, energy use is vital for a range of water processes, including extraction, treatment, desalination, purification, and transport of fresh water. These two necessities are strongly interrelated since energy conversion needs water, and treatment and supply of fresh water needs energy.
Both water and energy are the major elements of the modern food supply chain. Agriculture relies on adequate water for irrigation and fuel to operate farming equipment. Processing of agricultural produces and meat needs clean freshwater and reliable electric supply. Continuity and reliability of electric supply is critical for refrigerated food storage. Transportation and distribution of food products use fuels.
Water pollution is inevitable during production and transformation of secondary energy sources. Agricultural pesticides and chemicals used in the food industry ultimately drain to freshwater sources. In addition, greenhouse gases released from production and use of energy is the major cause for climate change, which would affect the water and food supply in long term.
The hybrid Sankey diagram prepared by the U.S. Department of Energy's Water‐Energy Technology Team (Figure 12.5) illustrates the interactions of energy and water flows in the US from sources to consumer sectors. Energy values are estimated for 2011; water values are based on available data from 2005 to 2011 (DOE 2014). The diagram clearly shows how water and energy flows are interdependent. A significant amount of water is used for cooling of thermoelectric generation units. The largest fraction of the cooling water is discharged to the ground surface and some part is drained to the oceans. While the total amount of water remains constant, energy production uses about half of the water available from all sources. Agriculture, which is the main source for the food industry, uses about one‐third of the total available water mainly for irrigation. On the other hand, public water supply and wastewater treatment services depend on electric energy. Although the water and energy usages are different for each country, the interactions shown in Figure 12.5 is a typical example for the developed part of the world.
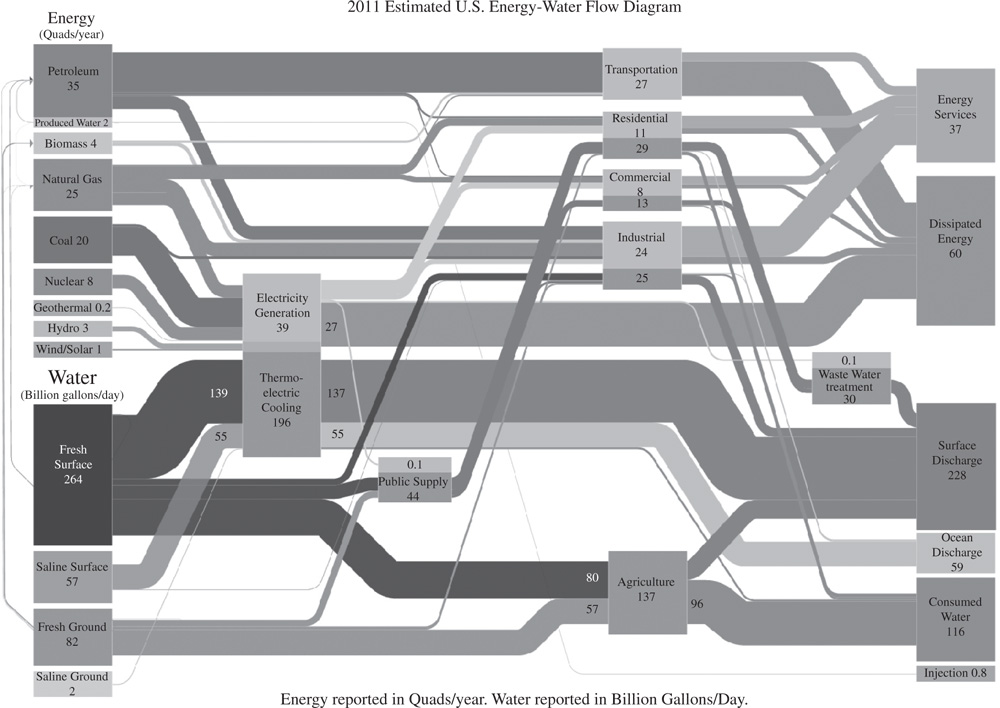
Figure 12.5 Water and energy interdependency in the USA.
Source: DOE 2014, p. 10, Figure 2.1.
12.4.1 Water Sources
About 71% of the Earth's surface is water‐covered. Oceans hold approximately 96.5% of all the water on earth. Water also exists in the air as vapor, and in the form of clouds, fog, and humidity. Freshwater sources are grouped as surface and ground water. Water accumulated in rivers, streams, reservoirs, and lakes is surface water. Snow, icecaps, and glaciers are freshwater reserves in solid form. Water penetrated in the ground as soil moisture or accumulated below the land surface in the soil is called groundwater. Surface and groundwater sources are regenerated via the natural cycle.
Aquifers are large, deep layers of sand and gravel that store or transmit groundwater. Some aquifers contain water from the ice age. The recharging rate of aquifers is extremely slow compared to a human lifetime; therefore, they are considered non‐renewable water sources. Major aquifers located under the Midwest and the high plains regions in the US provide ground water resources for several states. According to USGS, the water levels in aquifers is being rapidly depleted by growing irrigation and contaminated by fertilizers and herbicides used in agriculture.
Freshwater containing small amounts of dissolved chemicals may be used for irrigation, public services, cooling, and certain industrial processes. Most freshwater sources must be disinfected, filtered, and purified to be used as drinking water. Non‐freshwater (brown water) resources include saltwater, urban or industrial wastewater, and agricultural drainage water. Such water sources contain minerals, bacteria, algae, and other contaminants above levels acceptable for specific end‐uses. Brown water can however, be purified to supplement freshwater resources. All water treatment facilities consume energy in the form of heat or electricity.
12.4.2 Water Use for Energy
Worldwide, energy systems withdraw about 10% of all available water mainly for power plant operations, as well as production of fossil fuels and biofuels (IEA 2016). In the US, nearly half of all available water is used for energy as seen in Figure 12.5 (DOE 2014).
According to the IEA World Energy Outlook 2016, 397 billion cubic meters (bcm) of water was used in 2014 worldwide for energy related purposes (IEA 2009, p. 13). Figure 12.6 shows the global water withdrawals and consumptions for primary energy production and power generation. Power generation units withdraw considerably more water (350 bcm) than primary energy production facilities (47 bcm). Generation stations, however, return a large part of the withdrawn water to the same source while a considerable amount of water used for primary energy production is smaller, and is evaporated or transferred to another source. Evaporated water will eventually return to the ground as precipitation but not necessarily to the same location, therefore energy‐related operations may cause water shortage in regions where water availability is limited.
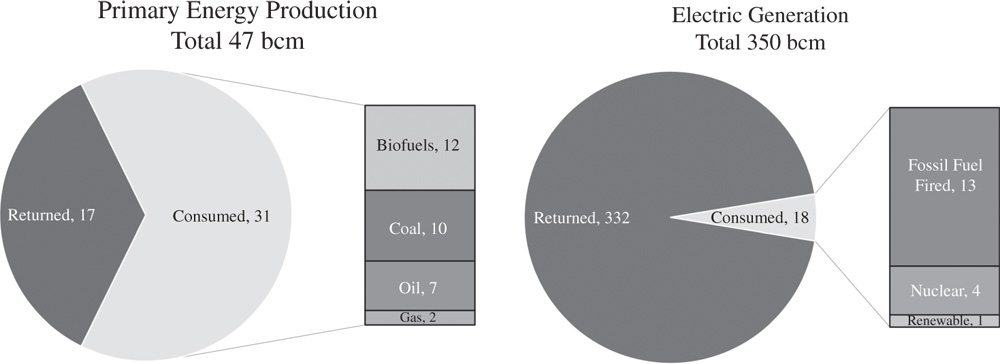
Figure 12.6 Global water withdrawals for primary energy production and electric generation in 2014.
Source: IEA (2016, p. 13, Table 1).
Extraction and processing of primary energy sources worldwide used 47 billion cubic meters of water in 2014. About 35% of this water returned directly to the ground while 65% evaporated or drained to other sources. Water withdrawal for primary energy production varies over a wide range depending on the type of fuel and operation. Among primary sources, biofuels consume the largest portion of water, followed by coal and oil production.
Water is mainly needed for cultivation of biomass feedstock. The water input comes from precipitation and irrigation. Part of the water returns to the ground, and part is evaporated or absorbed by the plants. The amount of irrigation water depends on the soil characteristics and climate. For example, ethanol corn grown in the northern plains of the US needs more groundwater irrigation than the East Central region. In regions where significant irrigation is needed, biofuel farmers may have to pump water out from aquifers, which are not sustainable water resources. In addition to irrigation, biofuel production requires considerable amounts of water for grinding, liquefaction, separation, and steam drying.
Ethanol is one of the most popular biofuels mixed with gasoline. Ethanol can be produced from various plants such as sugarcane, soybean, corn, and cellulosic fibers. Cellulosic ethanol production consumes 1.9–5.4 gal of water for each gallon of ethanol produced, but if switchgrass and forest wood residue is used as feedstock, no additional water is used for irrigation. Corn ethanol production is, however, extremely water‐intensive. Dry mill operations to produce corn ethanol consume about three gallons of water for one gallon of ethanol. Water consumption from corn farming to production of corn ethanol can be as high as 160 gal of water per gallon of ethanol produced. Table 12.5 shows the volumes of water consumed to produce one unit volume of corn ethanol by the US Department of Agriculture regions (Wu and Chiu 2011).
Table 12.5 Water consumption to produce one unit volume of corn ethanol in the US.
Source: Wu and Chiu (2011, p. 34, Table 5).
| USDA region | Region 5 Iowa, Indiana, Illinois, Ohio, Missouri | Region 6 Minnesota, Wisconsin, Michigan | Region 7 North Dakota, South Dakota, Nebraska, Kansas |
| Share of US ethanol production (%) | 50 | 15 | 23 |
| Corn irrigation (groundwater) | 12 | 19 | 224 |
| Corn irrigation surface water | 2 | 3 | 12 |
| Ethanol production | 3 | 3 | 3 |
| Total without co‐product allocation | 17 | 25 | 239 |
| Total with co‐product allocation | 11 | 17 | 160 |
In coal production, water is used for mining as well as processing. In some coal mines, groundwater must be removed before production can begin. The highly contaminated water may be treated to be used as freshwater. Coal preparation and handling facilities use considerable amounts of water for separation of coal from soil and other minerals. Water is frequently sprinkled during surface mining and coal storage to prevent fires.
Conventional and unconventional oil drilling techniques use water for extraction. Primary oil recovery in conventional wells is based on bringing the oil, gas, and water mixture to the surface by natural pressure. As oil wells age, production from primary recovery declines and secondary recovery, also known as water flooding, is used to enhance extraction. In secondary recovery, separate wells are drilled to inject water into the formation. Whereas much of the injection water is recycled, fresh groundwater may be also needed. Enhanced oil recovery (EOR) is a used to improve oil production. One of the EOR methods is carbon dioxide injection to reduce surface tension. Steam, or micellar polymer injection is used to reduce the viscosity of the crude oil. Injection water requirements vary with recovery technology. While primary recovery needs about 0.21 gal freshwater to extract one gallon of crude oil, secondary recovery may need up to 8.6 gal of water per gallon of crude oil. Water intensive EOR technologies may use as much as 343 gal of water to extract one gallon of crude oil. Based on 2005 production data, 1171 million gallons per day was used in 2005 for EOR technologies (Wu and Chiu 2011, p. 45, Tables 8 and 9).
Hydraulic fracturing techniques used for unconventional oil and gas recovery require large amounts of water. Surface mining of oil sands and steam‐assisted gravity drainage (SAGD) technologies used to reduce the viscosity of extra heavy oil are also water intensive. In addition to withdrawal, chemicals used for fracturing present a risk of ground water contamination.
About 70% of the electric power is generated in thermal power stations. Such generation units withdraw the largest fraction of water for cooling a working fluid circulated in heat engines or equipment heated because of the losses. Cooling is particularly an essential part of thermoelectric generation. Throughout the thermodynamic cycle, the condenser discharges part of the heat in the working fluid to a low temperature sink, which is mostly a river, lake, or sea inlet. A larger amount of the cooling water returns to the source while some evaporates or drains out to another source. Water evaporated during electric generation or drained to sea is consumed since it is not returned to the freshwater sources. Advanced air‐cooling techniques and combined heat and power (CHP) generation systems have reduced the amount of water withdrawn and consumed by power generation. Renewables includes bioenergy, geothermal, concentrating solar power (CSP), solar photovoltaics (PV), and wind. PV and wind generation units do not use water. Bioenergy, geothermal, and CSP withdraw cooling water as other thermoelectric generation.
12.4.3 Energy Use for Water
Collection, treatment transfer, and distribution of freshwater rely on energy supply. Energy is mainly needed for extraction of groundwater and surface water, transfer from one location to another, filtration, distillation, purification, and distribution of clean water to the users. Figure 12.7 illustrates the major processes from the water sources to end‐users and from end‐users back to sources. All steps of this block diagram involve some form of energy.
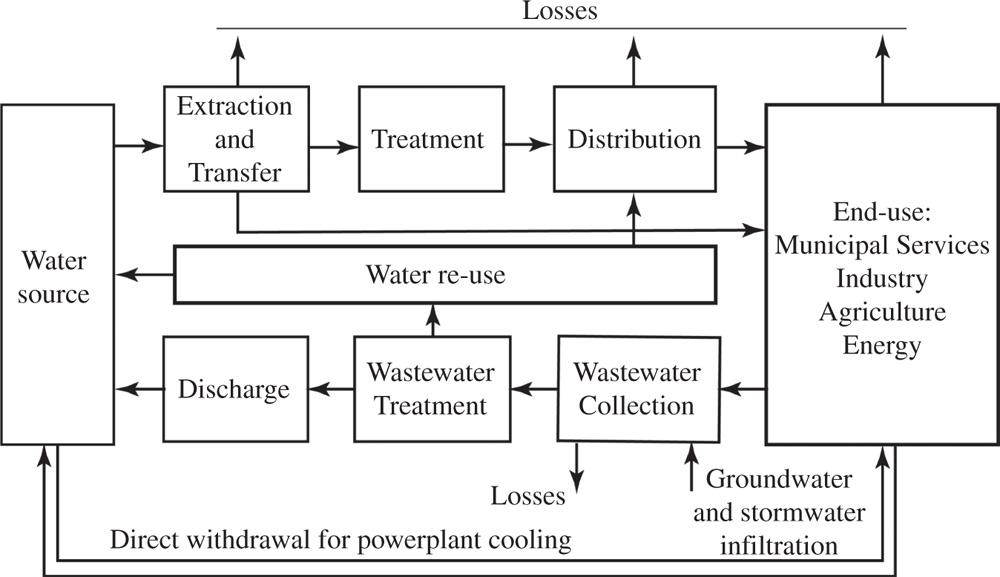
Figure 12.7 Energy‐related segments of water processing.
Water sources include groundwater, surface water, and salt water. Freshwater can be directly extracted from the ground or collected from surface water sources. In regions where freshwater sources are scarce, desalination facilities produce freshwater from saltwater drawn from seas and oceans. Water collection and desalination are the most energy intensive processes. Extraction of groundwater and transfer over long distances to treatment facilities uses electric energy to operate pump motors. Desalination processes involves evaporation, which is also energy intensive. Various fuels as well as renewables such as geothermal or solar energy can be used to produce heat needed for the desalination process.
Water treatment processes includes filtration, decontamination, purification, and softening. The treatment process is mostly electric powered. The water distribution system adjusts water pressure and conveys clean water to end‐users. Some industrial processes may withdraw untreated water directly from extraction facilities or surface water without passing through the distribution network. Cooling water for industry and electric generation is typically withdrawn from the surface water or saltwater sources and returned to the same source. Some part of the cooling water is lost by evaporation.
Industrial and municipal wastewater treatment plants use electric energy to circulate water between storage pools and a wide variety of purification processes to remove contaminants. Wastewater may be collected and discharged directly by gravity or by forced circulation using pumps. Part of the treated water may be re‐used, and the rest is returned to the sources.
Estimation of water related energy consumption is complicated because specific processing facilities use energy for many other purposes too. While some developed countries offer relatively realistic information about water‐related energy consumption, estimation of energy used for global water supply is based on surveys and assumptions, and is often unreliable data.
Energy intensity for water supply depends on the type, location, and characteristics of water sources. Surface water carried by a river may be simply collected in a pond by gravity, but extraction of groundwater from wells depends on the depth and pump efficiency. Desalination technologies consume significant amounts of energy to remove dissolved salts from water. Desalination plants use energy‐intensive distillation or reverse osmosis technologies, as distillation requires evaporation of large amounts of water. A reverse osmosis process pressurizes water to pass through semi‐permeable membranes. The amount of energy consumption in all desalination methods depends on the salinity of the source water. For example, seawater desalination requires significantly more energy than slightly salty river water.
Topography, distances, and pumping efficiency are the main factors that affect energy used for water conveyance. Energy used in treatment processes depends on the quality of both the water source and the freshwater supplied to users. Wastewater treatment energy is also subject to the composition of the rejected water (CEC 2005). Table 12.6 shows energy intensities of main segments of the water cycle estimated for water treatment and pumping in California.
Table 12.6 Energy intensity of water treatment and pumping in California.
| Water cycle segments | kWh/million gallon |
| Treatment | |
| Drinking water treatment | 100–16,000 |
| Wastewater treatment and distribution | 1100–4600 |
| Pumping | |
| Water supply/conveyance | 0–14,000 |
| Primary drinking water distribution | 700–1200 |
| Recycled water distribution | 400–1200 |
| Groundwater for agriculture | 500–1500 |
Based on the estimates of the IEA, the global energy use for water services is around 120 million tons of oil equivalent (Mtoe) per year. More than half of this energy is consumed in the form of electricity, totaling 820 TWh, which represents about 4% of the total global electricity consumption (IEA 2018). Figure 12.8 show the fraction of energy use for various activities related to freshwater supply and wastewater treatment in the world.

Figure 12.8 Global energy use for water services.
Source: IEA (2018, p. 3,Figure 1.1).
Globally, the largest amount of electricity is used for freshwater extraction. Wastewater collection and treatment plants consume about one‐quarter of the electric power delivered for all water services. In developed countries, energy used for wastewater treatment can rise up to 40%. Approximately 20% of electricity is consumed for distribution and delivery of water to consumers. Although seawater desalination is one of the most energy‐intensive processes, electric use is smaller because other primary sources such as solar and geothermal are used to evaporate saltwater for distillation.
12.4.4 Energy Invested for Energy
Extraction, process, and delivery of energy sources to end‐users require a certain energy input; for example, drilling oil wells, opening mineshafts, and surface‐mining use heavy equipment that consume gasoline or diesel fuel. Transport systems to carry extracted coal, oil, or gas to processing plants consume various energy sources. Mechanical or chemical processes to obtain better quality and usable fuels also consume energy. Agricultural equipment, machines, and vehicles to grow feedstock for the biofuel industry needs refined petroleum products (gasoline, diesel, kerosene, lubricants, etc.) for their operation. In addition, all kinds of fuels are transported to the end‐users by trains, trucks, and ships, which also consume energy.
The indicator known as “Energy Return on Energy Invested” is the ratio of energy acquired from a fuel to the total energy consumed for its production, including processing, transportation, and delivery to consumers. This dimensionless ratio is represented by the acronyms EROEI, ERoEI, or simply EROI.
The concept of energy return on energy invested was originally defined in the 1970s, when the cost and future availability of oil became a concern. The expression below is the general definition of EROI:

EROI should not be confused with conversion efficiency, which is the ratio of the output to the input energy. Efficiency is always less than unity (or 100%) since the output energy of a conversion device is smaller than the input energy due to losses. EROI, however, must be greater than unity to benefit from a resource. In other words, a resource is more beneficial if it can produce more energy than the energy used to make it available to consumers.
Estimation of the EROI is often challenging and depends on which point of the energy supply chain it is defining. From the point of production to the consumer, energy involved in transportation and distribution services indirectly affect the overall EROI.
EROIst is the standard EROI obtained as the ratio of the energy acquired at point of production to the sum of direct and indirect energy used to explore the source, reach the reserve, and extract that energy. It is estimated for the energy produced at the mine mouth, wellhead, or farm gate. Direct energy is the sum of all energy used on site to extract or produce the primary energy source. Indirect energy is the offsite energy to explore the sources, produce materials, manufacture equipment, build structures required for production, and support the production on site. Equation 12.2 is the most common EROI definition used to compare different primary sources. Table 12.7 shows estimated EROIst for common fuels.

Table 12.7 EROIst for various energy resources used in the US.
Source: Murphy and Hall (2010).
| Resource | EROIst |
| Domestic oil and gas | 11–18 |
| Imported oil | 18 |
| Natural gas | 10 |
| Coal | 80 |
| Bitumen from tar sands | 2–4 |
| Shale oil | 5 |
| Nuclear | 5–15 |
| Hydropower | > 100 |
| Wind turbines | 18 |
| Solar PV | 6.6 |
| Flat plate solar collectors | 1.9 |
| Concentrated solar collectors | 1.6 |
| Sugarcane based ethanol | 0.8–10 |
| Corn based ethanol | 0.8–6 |
| Biodiesel | 1.3 |
EROIpou is the ratio of the energy acquired at the point of use to the total energy invested to find, reach, extract, process, and supply that energy to end‐users. The denominator includes additional energy needed to deliver the resources to consumers. For example, the fuel consumed by trucks, trains, and ships to carry the fuel to the point where it is used are included in the calculation.

EROIext extends the EROIpou by including additional energy required to enable the use this energy. For example, the energy used to maintain the transportation infrastructures such as roads, bridges, etc., that are necessary to use transportation fuels is considered in the estimation.

EROI analysis is important for cost‐benefit comparison of various resources, assessment of the resource feasibility, and evaluation of the commercial viability of a potential resource. However, selected boundaries must be consistent to make meaningful comparisons. Different definitions of EROI are illustrated in Figure 12.9
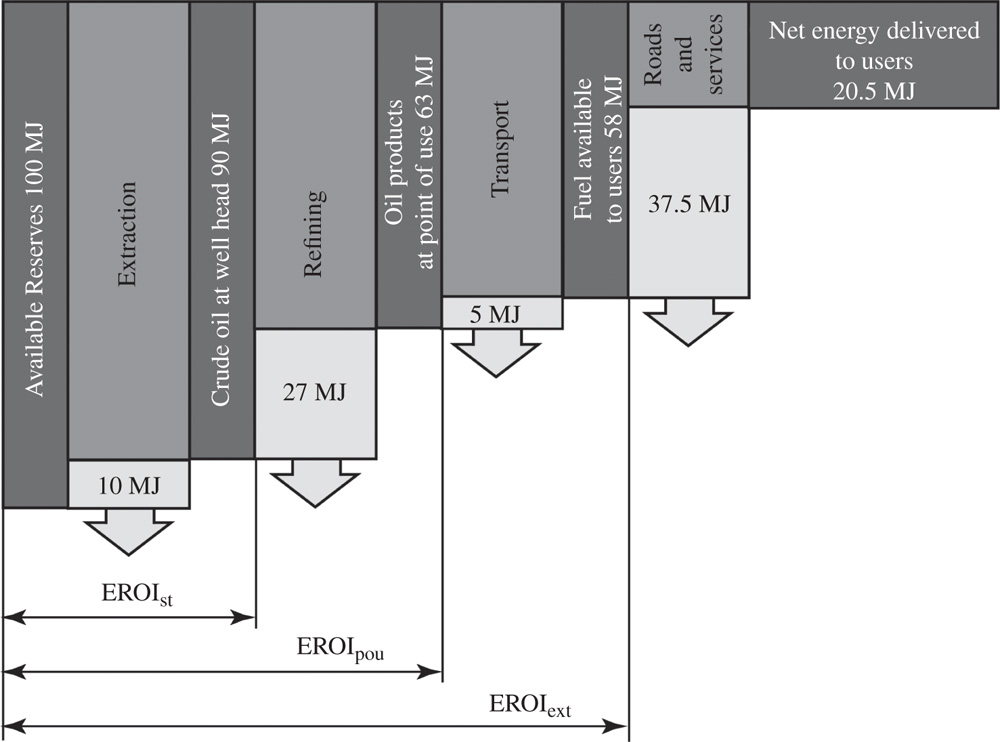
Figure 12.9 An example of EROI boundaries for petroleum.
Source: Gagnon et al. 2009.
Energy production and consumption data are available at a great accuracy from databases provided by several institutions (e.g. US Energy Information Administration, International Energy Agency, United Nations, World Bank, etc.). Therefore, energy returned to society is usually determined quite easily. However, estimation of the energy consumed to produce the usable energy source requires reliable and accurate industrial, commercial, and agricultural data.
Studies show that a fuel cannot sustain without the support of other fuels if the EROI at the mine‐mouth or farm‐gate is less than 3 : 1 (Hall et al. 2013). Therefore, with current technologies, many alternative energy sources are not sustainable if not subsidized with fossil fuels.
EROI is not the only factor considered in social and economic decisions. For example, coal has higher EROI than natural gas; however, natural gas replaced coal in residential space heating because gas is cleaner, more cost efficient, and easier to transport. Global electric generation, on the other hand, still depends on low quality coal abundantly available in many regions of the world.
Biodiesel and corn‐based ethanol have lowest EROI compared to other energy sources. In the United States, motor gasoline is blended with about 10% corn‐based ethanol to meet the requirements of the 1990 Clean Air Act. In many cities with high smog levels the use of reformulated gasoline (RFG) has been required since 1995. The US Energy Information Administration (EIA) estimates that blending motor gasoline with 10% ethanol reduces the fuel efficiency by about 3%. Addition of corn‐based ethanol to gasoline has been a source of public debate because of lower EROI, efficiency decrease, and land use. Similarly, lower EROI and environmental impacts rose public concerns about the use of oil sands, and shale gas (Table 12.7).
12.5 Energy Management
Energy management is coordination of planning, development, and operation of an energy system to supply energy needs of the society. Proactive and balanced management of production, conversion, and distribution of energy sources is central for sustainable development of a society since all energy related activities are closely related to natural resources, freshwater availability, air quality, food supply, and global climate changes. Sensible energy management considers cost‐effective and reliable operation of the energy system while preserving natural resources, protecting the environment, and observing ethical values. Energy management activities can be performed at various levels including resource management; coordination of fuel transportation; balancing electric generation, transmission, and load flow; facility management; and building energy management. To simplify, we can group such activities into two major groups as resource coordination and load‐side energy management. All layers of energy management are obviously linked since energy system is a whole from resources to final consumption.
12.5.1 Resource Coordination
Energy resource coordination is proactive administration of all available energy sources to allow production of fuels, electricity, and other energy carriers necessary for operation and development of a society. Primary energy mix that feeds a country's energy system depends on many factors including resource availability, development goals, economic conditions, international agreements, and political decisions. Typically, national and local administrations develop policies to regulate long‐term use of the available resources. In free democratic countries, public opinions, concerns, and reactions weigh in political preferences.
Utilization of energy sources in a country affects the global balance of natural resources, economic development, and climate change. The United Nations Framework Convention on Climate Change (UNFCCC), Organization for Economic Cooperation and Development (OECD), Organization of Petroleum Exporting Countries (OPEC), Intergovernmental Panel on Climate Change (IPCC), and other international organizations set common goals that constrain the exploitation of energy resources to protect mutual interests of the member countries.
The decision of OPEC members in 1974 to limit oil production that led to the worldwide oil crisis has been a crossroad in the evolution of the global energy industry. The 1997 Kyoto Protocol and subsequent Paris Agreement in 2017 signed by the leaders of the UNFCC member countries set international goals to reduce the risks and effects of climate change. The Paris Agreement significantly affects long‐term energy policies and resource allocations around the world.
Large rivers are critical resources for energy, agriculture, and transportation. Interests of competing sectors are typically resolved through national regulations. However, many big rivers cross political boundaries of several countries. According to the United Nations Department of Economic and Social Affairs (UNDESA), 145 nations around the world have territories within international river basins. The timing and flow rate of water released by upstream users has crucial implications downstream. For example, agricultural users in a downstream country may need water for irrigation at the same time as an upstream country needs it for hydroelectric generation. Many countries sharing cross‐border rivers have negotiated the use of water resources and signed agreements. In some situations, however, disputes over shared water resources may escalate to international conflicts. As of 2006, out of 145 agreements on transboundary water resources, 57 were on hydropower management (UNDP 2006, p. 222, Figure 6.2).
Significant financial investment is necessary for exploration of resources and development of infrastructure for extraction, processing, and distribution of energy sources. Historically, large multinational companies have dominated oil exploration and recovery projects. Coal mines, hydroelectric dams, and nuclear facilities are typically developed by consortiums of large multinational companies. Such complex projects need long‐term commitments and significant support of governments. Consequently, resource coordination for sustainable development of a national energy system depends principally on socioeconomic factors and national policies rather than resource availability and possible technical options.
12.5.2 Supply‐side Energy Management
The purpose of supply‐side energy management is coordination of activities involving production and distribution of secondary energy sources to the consumers. Since continuous supply to consumers relies on the effectiveness of the distribution network, preferences have shifted from lower to higher energy‐intensity fuels. Hence, throughout the evolution of energy systems, liquids replaced solid fuels and gases replaced liquids. In modern energy systems, liquid fuels derived from petroleum and liquefied petroleum gases (LPGs) are primarily used in the transportation sector and mobile applications, while natural gas and electricity are essential energy sources for residential and commercial sectors. Hydrogen is emerging as an energy carrier for both transportation and stationary applications.
Management of fuel supply relies on a transportation network from production facilities to retail dealers. Although fuels can be stocked for an extended time in physical storage facilities, fuel production ideally must follow the consumption. Therefore, supply‐side energy management is mostly driven by the supply‐demand balance, which affects energy prices. Energy cost, in turn, impacts the composition of the consumed energy mix.
Energy transfer in the form of electric power enables supply of a fuel mix including renewables, nuclear energy, municipal solid waste, and low quality fuels that are not cost‐effectively supplied to consumers. Electricity can be converted to all other forms of energy needed for practical applications. From an energy management standpoint, the largest challenge of electric supply is direct storage of electric energy. Although the unit cost of batteries is decreasing with modern technologies, electric storage in large amounts is expensive. Therefore, electric power must be generated as much as it is consumed at any time.
Consumption of electric power depends on consumer activities. Industrial and commercial consumers draw more electric power during operation hours. Residential users consume more electricity during the evening hours for lighting and entertainment. Street and building lighting also need more electric power after dark. In an interconnection that combines diverse groups of users, time variations of the electric consumption become smoother. As an example, monthly and hourly variations of the electric demand in the state of New York are illustrated in Figure 12.10.
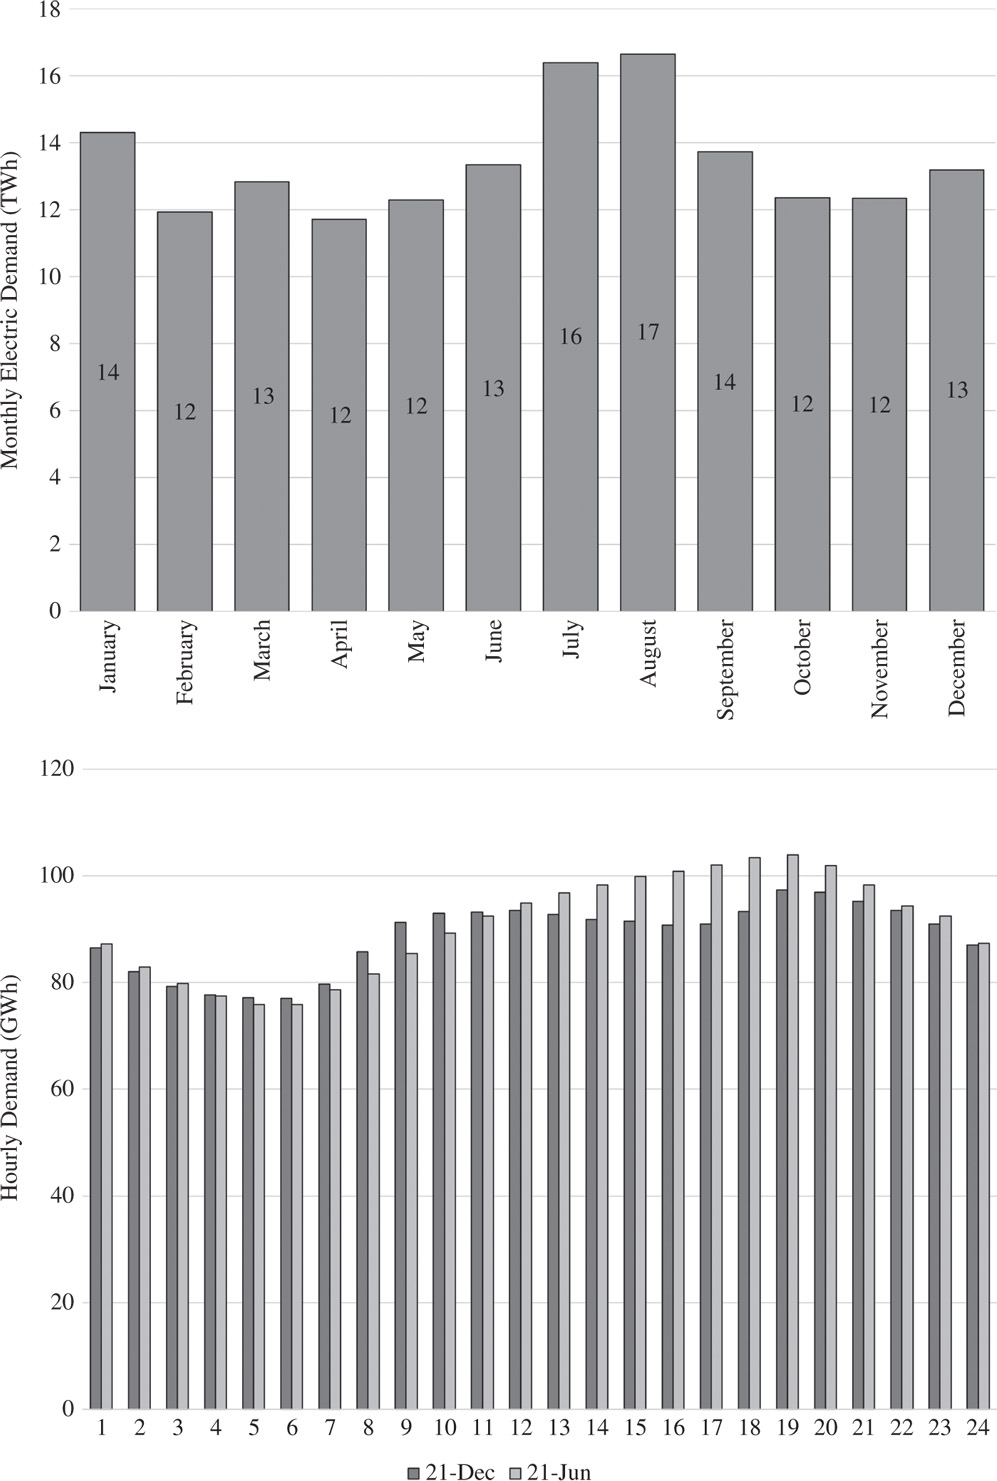
Figure 12.10 Monthly and daily variations of electricity demand in 2018 load in New York.
Source: EIA, U.S. Electric System Operating Data, https://www.eia.gov/realtime_grid (accessed 8/13/19).
Separate regional grids are generally electrically linked to create larger interconnected network. In the continental US, three main interconnections comprise 10 regional grids (Figure 12.11). The US grid has interconnections with Canadian and Mexican grids, this North American interconnected network is managed by North American Electric Reliability Corporation (NERC). National electric grids of countries in Europe and Asia are as well interconnected. Individual interconnections may implement different load management strategies to optimize the operation of the electric supply system, but cross‐boundary interconnections are managed based on common quality and reliability standards.
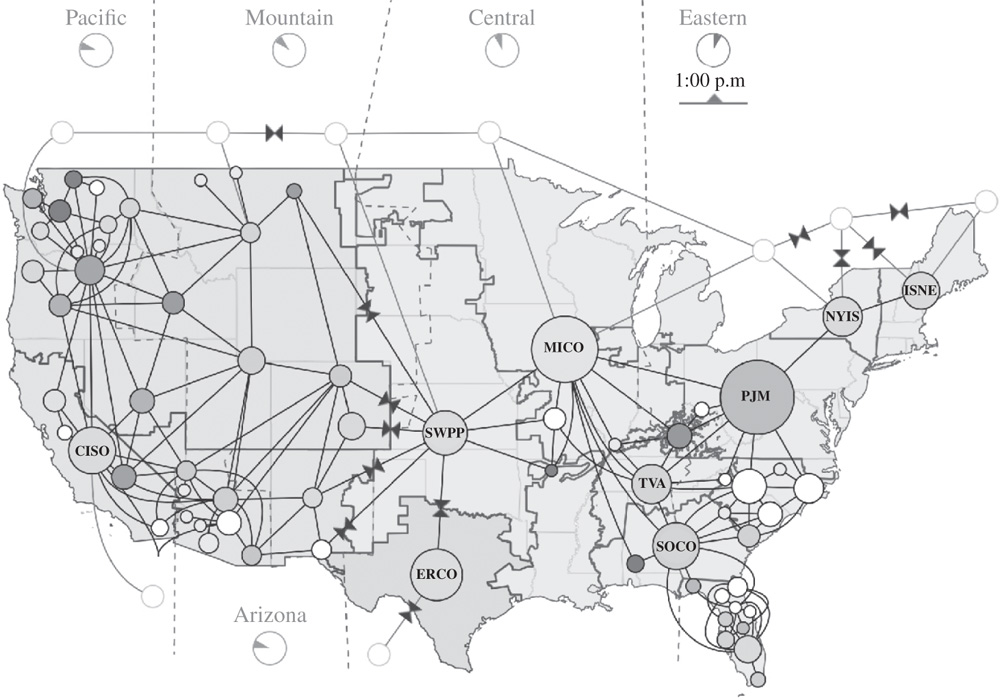
Figure 12.11 Electric interconnections in the continental United States.
Source: Diagram provided by EIA website https://www.eia.gov/realtime_grid (accessed 8/29/2019).
Controllability of generation stations depends on the primary energy source used and conversion techniques. For example, the output power of gas‐burning and hydroelectric stations can be controlled more easily than nuclear power plants as the demand changes. On the other hand, the output of wind and solar generation change continuously over a wide range with variable wind speed and solar irradiance.
For cost‐effective operation of the electric supply system, larger generation facilities that have higher initial cost are loaded near their installed capacity as much as possible. Such units are called base‐load power plants. Smaller units that are easier to control are operated at variable output power to supply load peaks.
To balance supply and demand variations, various types of electric generation facilities are interconnected to supply diverse groups of consumers spread over a wide geographic area.
Power outputs of generation stations are coordinated in such a way that the total electric generation equals the total consumption at any instant. In an interconnected network, energy flow between generation plants and consumers continuously changes. Pumped‐storage hydroelectric plants enable bidirectional energy flow depending on the supply‐demand balance. At late night, when electric consumption is lower, these facilities pump water to a higher pool to store excess electricity in the form of potential energy. At peak hours, water stored in the higher pool is used to generate electricity.
Electric power generation offers additional opportunities in coordination of energy flow from production to end‐users. Primary sources that cannot be directly delivered to consumers and low‐quality fuels that are not cost‐effective for long distance transportation or unsuitable for use in industrial, commercial, or residential applications can be included in the fuel mix for electric generation. For example, long‐distance transportation of lignite is not cost‐effective because of its low heating value and relatively higher water content. In addition, it is not suitable for most industrial, commercial, or residential heating applications because of the higher amounts of ash, air pollution, and solid contaminants it produces. However, lignite can be used to generate electricity in a power plant installed close to the mine. The large amounts of ash and residues that cannot be recycled for industrial byproducts are typically transported back to the mine for landfill. Another example is coordination of electric generation and natural gas production to optimize the supply‐demand balance of both energy sources. Most residential and commercial buildings use natural gas for heating in winter. In summer, however, electric consumption increases because of air conditioning use. Therefore, natural gas production facilities can be operated at higher capacity year‐round if the excess natural gas is used for electric generation in summer to fulfill the increased air conditioning load.
The main objectives of supply‐side energy management programs include optimizing the energy mix and providing consumers with reliable and affordable energy services. Since energy supply is a strategic issue for welfare and economic development of a nation, governments control energy supply by laws, standards, regulations, and codes. In many countries, state‐owned establishments provide essential energy production and distribution services. In a monopolized economy, energy mix used for electric generation and energy prices are centrally determined by the administrative offices, leaving no options to consumers.
Starting from the 1980s, the concept known as “deregulation” has introduced competition into the electric power industry in several states of the US. In deregulated energy markets, energy prices vary among companies and consumers can choose their energy provider. Hence, consumer choices may eventually affect the composition of primary sources, methods used for electric generation, and supply‐side energy management procedures.
12.5.3 Load‐side Energy Management
Consumers have several options to meet their energy needs using various fuels, electric power, and other energy carriers. The types of secondary energy sources depend on the final application. For example, various fuels, electricity, or district steam can be used for heating; but light fixtures, household appliances, communication devices, and computers use electricity exclusively. The main objective of the load‐side energy management is optimization of the energy consumption by selecting suitable energy sources and controlling the operation of devices to maintain the desired level of productivity and comfort. Conscious consumers also consider the impacts of their final energy use on the environment and natural resources.
Load‐side energy management is mainly implemented in buildings and facilities. Improving energy efficiency is the first step to save energy. Well‐insulated building envelopes, effective use of daylight, and passive solar heating significantly reduce the energy consumption in buildings (Soysal et al. 2016).
Consumers use a diverse combination of secondary sources to meet their energy needs; typical sources used in buildings are electricity, natural gas, fuel oil, LPG, and biomass (wood pellets, firewood, etc.). In developed countries, electricity and natural gas are the main supply for residential consumers. In less developed and poor regions, conventional biomass, charcoal, and coal is extensively used. Use of low‐quality fuels impact air quality, produce excessive solid waste, and lower the living standards.
Space and water heating, ventilation, air conditioning, cooking, refrigeration, washing, and powering various consumer electronics devices are among major end‐use applications. The consumption of each source changes depending on the activities and outdoor temperature, showing short‐term (hourly) and long‐term (seasonal) variations. Figure 12.12 shows an example household in a moderate climate using only natural gas and electricity. Natural gas consumption is higher in winter and electricity consumption is higher in summer because of air conditioning. Seasonal variations of natural gas and electricity consumption of similar users vary by climate.
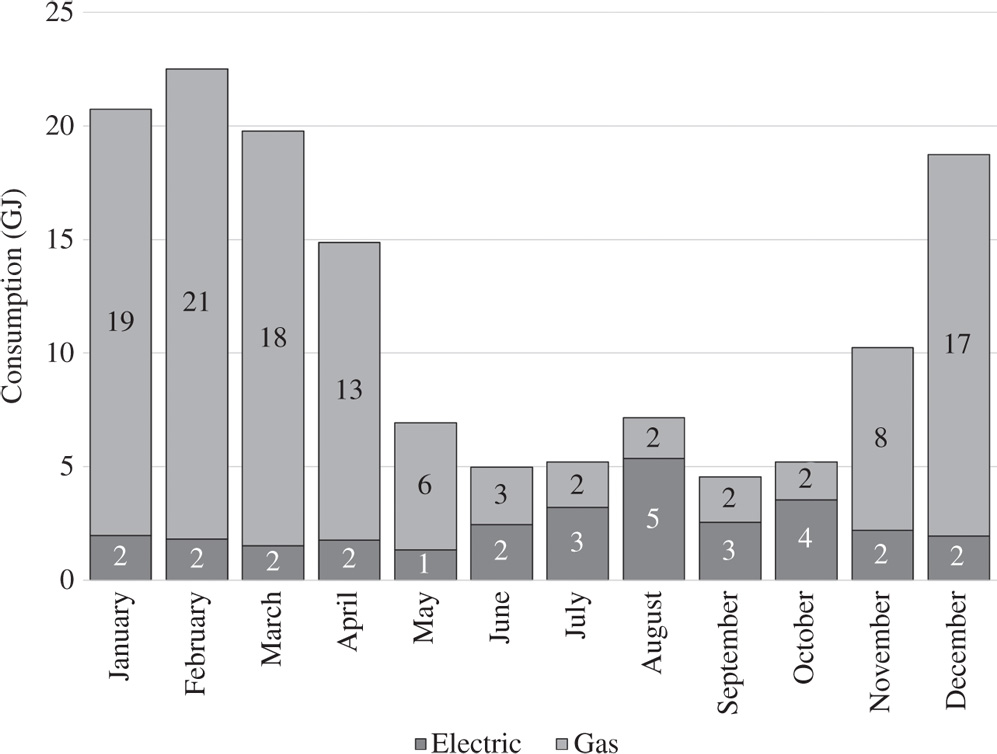
Figure 12.12 Monthly energy consumption of a typical residence in a moderate climate using natural gas for space and water heating, electricity for all other applications.
Energy profiles of consumers affect the management of energy sources. Beside the total energy need, energy flow rate is also an important parameter for reliable and continuous energy supply. Utilities try to forecast variations of demand in advance to plan daily and seasonal energy supply strategies. Government policies may impose particular ways and timing of nationwide consumption of certain energy sources. Implementation of daylight‐saving time and restriction of driving private cars in certain days are examples of policies for regulation of energy usage.
Pricing strategies are effective ways to modify the consumers' energy demand profiles. Instead of charging a fixed‐rate for electricity, utility companies may apply tiered pricing that increases the price rate when consumption exceeds certain thresholds. Time‐of‐use pricing changes the kilowatt‐hour price according to days of the week and hours of the day depending on the peak demand times. In general, weekends are off‐peak since businesses and some industrial facilities are not open. Peak hours of the workdays vary by seasons. In winter, electric demand is generally higher from 7 to 11 a.m. and from 5 to 7 p.m. In summer months, these time slots are mid‐peak, and from 11 a.m. to 5 p.m. electric demands peak mainly because of air conditioning. During off‐peak hours the price rate of electricity can be as low as half the rate charged during on‐peak hours. In order to implement time‐of‐use rates, the utility company must install smart meters that record the time of energy use at the entry point of each customer.
During the energy crisis in the 1970s, the concept of energy conservation has evolved. To avoid confusion with the fundamental “conservation of energy” principle of physics, we will use the term “energy conservation” for various ways of avoiding unnecessary energy consumption. Energy conservation is basically reducing the energy consumption by avoiding certain applications. In extreme energy shortage periods, especially during the energy crisis, some governments restricted lighting of streets and public places, illumination of buildings during non‐working hours, and decorative lights, and even applied scheduled electric outages up to several hours during peak‐hours. Whereas such strategies may be short‐term solutions to energy problems, they have adverse impacts on productivity, social life, education, health, public services, and security. Improving energy efficiency, rather than restricting energy usage, is a rational long‐term solution for sustainable development.
The following basic principles can be applied to save energy in buildings and facilities:
- Operating equipment only when needed and as much as required
- Eliminating simultaneous use of heating and cooling equipment
- Setting temperatures at appropriate levels
- Using passive solar heating and lighting effectively
- Supplying heaters and coolers from the most efficient sources
- Minimizing energy losses by using energy‐efficient equipment
- Operating power equipment around the design specifications.
Energy flow in buildings and facilities can be optimized by using dedicated feedback control systems. A typical building energy management control system (EMCS) collects energy‐related information by temperature, humidity, occupancy, and light sensors installed at multiple points in the building. Computer software processes the information received from sensors and energy meters, then turns on or off HVAC (heating, ventilation, and air conditioning) units, lights, and electric devices to optimize energy consumption. Some of the equipment may have individual sensors and feedback control systems.
Equipment used in buildings can be grouped as critical, non‐critical, and deferrable. For example, communication, data processing, and security systems are usually critical equipment and require uninterruptible power supply. Equipment that can tolerate short‐term energy interruptions like refrigerators, home entertainment, water heaters, cooking ranges, and non‐emergency lighting are non‐critical. Appliances that can be used at a scheduled time like a clothes washer, dryer, and dishwasher are deferrable equipment. Classification of equipment depends on the activities supported by the supplied energy. For example, lighting is critical in an emergency and surgery rooms, and elevators may be critical equipment in a public high‐rise building.
If electric prices change based on the monthly consumption (tiered pricing) or depending on the time of day (double tariff), EMCS may schedule the operation of some deferrable electric loads to minimize energy costs. A laundry washer and dryer, and dishwasher can be programmed to automatically operate during late‐night hours when electricity is cheaper. Some customers can install electric heaters with thermal storage like hot water tanks or heavy concrete blocks. Heaters are operated when the electricity price is lower, and stored thermal energy can heat the building all day.
If on‐site electric generation from renewable sources contributes to the energy purchased from a utility, deferrable equipment may be operated when the renewable source is available. In a warmer climate, solar generation can supply air conditioning in midday when the sun is higher, and AC is more needed. In an agricultural facility where wind power is used to generate electricity, water pumps may be operated during windy hours and water stored in a tank at high elevation can be used for irrigation as needed. If on‐site solar and/or wind powered generation is backed up with some kind of energy storage, EMCS may include a forecast‐based schedule to coordinate battery charging and discharging times with supply of deferrable loads (Soysal et al. 2019).
Load‐side energy management is linked to the use of primary resources and protection of the environment. National and international institutions have developed programs to increase the public awareness about the importance of energy use. These programs also encourage energy efficiency at the consumer end. Some examples are certification programs developed by the US Green Building Council's Leadership in Energy and Environmental Design (LEED), Passive House Institute (PHI) based in Germany, Passive House Alliance US (PHAUS), and Energy Star program of the US EPA. Governments offer rebates, tax refunds, and various financial incentives to promote the use of energy‐efficient appliances and building materials based on the certified improvements. The International Energy Agency publishes energy data and reports for researchers and policymakers, and the International Protocol for Climate Change (IPCC) provides detailed information about environmental impacts of energy production and consumption. Links to the web sites of these institutions are listed at the end of this chapter.
12.5.4 Site Energy and Source Energy
Energy used on‐site by consumers is often referred to as site energy. Fuels, electricity, and other energy carriers delivered to end‐users are produced by processing and transforming primary energy sources. Equipment used to extract or produce primary sources requires energy and some part of the primary sources are lost during screening, cleaning, and refining processes. In addition, trucks, trains, and various marine vessels that carry fuels from the production facilities to consumers also consume fuels. Electric generation from primary sources result in considerable conversion losses due to the thermodynamic cycle used in thermal generation and heat losses in generators. Electric transmission lines, transformers, and switchgear in the transmission system also dissipate part of the generated electricity in the form of heat. Consequently, significant amounts of source energy are used to produce clean and convenient secondary energy sources delivered to the end‐users.
Consumers are usually more focused on the retail cost and convenience of delivered fuels and energy carriers as they try to optimize the composition of their fuel mix. Consumer preferences and efficiency of energy conversion equipment used on site, however, affect the overall efficiency, effectiveness, and sustainability of the whole energy system. Source energy is an equitable common unit to evaluate the energy performance of end users, particularly residential and commercial buildings.
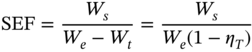
Source energy factor (SEF), also known as source‐site ratio is a dimensionless indicator that reflects the total quantity of primary energy sources used to deliver unit energy to consumers in some usable form. In other words, when a consumer uses a certain amount of fuel or electricity on site, SEF times the used energy is drawn from primary resources.

For fuels, source energy includes the energy used to extract, process, and transport the primary source to the consumer. Electricity is generated from a wide variety of fuels and sources using different types of conversion systems. The overall efficiency of electric generation systems depends on the fuel mix and the efficiency of technologies used to transform energy from one form to another in the conversion chain. Additional transmission losses occur until the generated electric power reaches the end users. SEF for the energy used on site is calculated using Eq. 12.5.
Electricity and natural gas are the most common energy sources for residential buildings. Coal, fuel oil, kerosene, propane, and LPG are other popular fuels used for space and water heating in individual buildings. Large commercial complexes, campuses, industrial plants, hospitals, and community services may also use energy carriers such as district steam, hot water, and chilled water for heating and cooling functions. In addition, some consumers supplement their fuel mix with on‐site electric generation, solar heating, or ground source geothermal heating and cooling systems. Each energy source used or produced on site affects the source energy consumption in different proportions. Therefore, to compare the efficiencies of buildings it is necessary to convert all site energy sources into the corresponding source energy using their source‐site ratios.
12.5.4.1 Direct Use of Fuels
Coal, natural gas, and petroleum products are common fuels delivered to consumers for space and water heating. In industrial and service facilities, diesel fuel may be used for power and emergency electric generation. Source energy corresponding to the derived fuels used on site includes the energy needed for extraction and processing as well as the losses that occur in transportation and distribution of the fuel.
The Energy Star standard created by the US EPA and Department of Energy in 1992 evaluates the energy performance of appliances, equipment, and buildings. Later, many countries including European Union, Canada, Australia, Japan, New Zealand, and Taiwan adopted similar programs to provide an equitable assessment of the energy performance of buildings. For the purposes of the Energy Star program, the EPA recommends the national source‐site ratios shown in Table 12.9.
As part of the Energy Star US EPA has developed an online source called Portfolio Manager® to guide consumers in evaluating the energy performance of buildings, appliances, and energy conversion equipment. Table 12.9 shows the source‐site ratios used for common fuels delivered to consumers in Energy Star Portfolio Manager (EPA 2018).
Table 12.8 Source energy factors for common fuels.
Source: Deru and Torcellini (2007).
| Fuel | Source energy factor | Higher heating value | |
| Anthracite coal | 1.029 | 12,700 Btu/lb | 29,539 kJ/kg |
| Bituminous coal | 1.048 | 12,155 Btu/lb | 28,270 kJ/kg |
| Subbituminous coal | 1.066 | 8818 Btu/lb | 20,509 kJ/kg |
| Lignite coal | 1.102 | 6465 Btu/lb | 15,038 kJ/kg |
| Natural gas | 1.092 | 1010 Btu/ft3 | 37,631 kJ/m3 |
| Residual fuel oil | 1.191 | 149,500 Btu/gal | 41,666 kJ/l |
| Distillate fuel oil | 1.158 | 138,700 Btu/gal | 38,656 kJ/l |
| Gasoline | 1.187 | 100,000 Btu/gal | 27,870 kJ/l |
| LPG | 1.151 | 91,000 Btu/gal | 25,362 kJ/l |
| Kerosene | 1.205 | 135,000 Btu/gal | 27,870 kJ/l |
12.5.4.2 Use of Grid Electricity
In residential and commercial buildings about half of the energy is consumed is in the form of electricity. The largest portion of electric power delivered to consumers is generated at centralized generation plants.
Table 12.9 Average source‐site ratios for fuels and energy carriers used on site.
Source: EPA (2018).
| Energy type | USA | Canada |
| Electricity (grid purchase) | 2.80 | 1.96 |
| Electricity (on‐site solar or wind installation) | 1.00 | 1.00 |
| Natural gas | 1.05 | 1.01 |
| Fuel oil (1,2,4,5,6, diesel, kerosene) | 1.01 | 1.01 |
| Propane and liquid propane | 1.01 | 1.04 |
| Steam | 1.20 | 1.33 |
| Hot water | 1.20 | 1.33 |
| Chilled water | 0.91 | 0.57 |
| Wood | 1.00 | 1.00 |
| Coal/coke | 1.00 | 1.00 |
| Other | 1.00 | 1.00 |
Electricity generated at large centralized power plants is delivered to consumers via an electric grid over long distances through transformers, transmission lines, and cables. Losses that result from heating of transmission lines and transformers must also be considered in estimating the primary energy equivalent of electricity used on site.
An interconnected system supplying a country or region usually consists of several regional networks where different types of primary sources are used for electric generation. Energy converted to electricity at power plants reaches the consumers through transmission and distribution networks where Wt units of energy are lost. For grid electricity, the SEF is expressed in Eq. (12.6), where Ws is the total source energy consumed to generate We units of electric energy. In this equation, ηT represents the losses of the electric grid.
For consistency, the same unit must be used for all energy involved in the calculation. Energy data published in official databases can be used to estimate the SEF for a certain region or country.
Source‐site ratio of electricity generated in a fossil fuel burning power station depends on the type and quality of the fuel and efficiency of the conversion technology used. An interconnected electric grid is supplied by diverse types of power stations using various primary sources and operating at different conversion efficiencies. The source‐site ratio differs from one interconnection to another because of the fuel mix and types of the generation facilities. Every national or regional electric grid exchanges energy with other electric grids. For example, the continental United States is supplied by three separate interconnections with connections to each other, as well as cross‐border interconnections with Canadian and Mexican grids. Electric grids continuously exchange electric power to balance the regional energy flow. Therefore, the fuels and efficiency of all generation units are used to obtain a more realistic source‐site ratio for a large area interconnection.
From the consumer perspective, electricity seems to be the most efficient energy carrier. In fact, electricity is generally cleaner, safer, more controllable, more accessible, and easier to be converted into various forms of energy than other fuels. However, as Table 12.8 shows, electricity drawn from the electric grid may consume more primary sources than other secondary sources used for the same purposes. Therefore, from the holistic perspective, using grid electricity for heating purposes is less efficient than direct use of other fuels. For heating and cooking purposes, the use of grid electricity should be reserved for small domestic appliances with heating components and to systems that cannot be directly supplied from other energy sources like lighting, ventilation, cooling, refrigeration, power equipment, audio‐visual sets, computers, communication devices, control equipment, and security systems. Plug‐in or battery‐operated power equipment and tools are generally more efficient than their alternatives burning petroleum derivatives since some fraction of the grid electricity is generated from renewable sources and large conversion systems used in electric generation are more efficient than small engines.
Many industrial plants use grid electricity for process heating, metal melting, drying, and other thermal purposes mainly because of its controllability, local efficiency, simplicity, and cleanness. Such facilities consume considerably more primary sources compared to their counterparts directly burning fuels. Industrial heating applications are justifiable if CHP or renewable heat sources like solar or geothermal energy are not available or feasible.
12.5.4.3 On‐site Electric Generation
Some consumers choose to generate electricity on site for several reasons. Hospitals, data centers, security services, communication centers, cell phone towers, airports, and military bases are critical infrastructures that require continuous energy supply. These facilities need to install emergency backup systems to generate their own energy when the grid power becomes unavailable. Diesel, gasoline, and natural gas are common fuels for such emergency generation systems. Renewable energy sources with battery backup can be also used for smaller loads. Industrial, commercial, and residential consumers may want to install their own generation systems using solar arrays and wind turbines to reduce or offset their energy bills. The number of net zero energy buildings has increased due to rising and volatile energy prices. Remote facilities such as remote homes, farm buildings, highway rest areas, or recreation facilities may generate their own electricity because the utility grid is either unavailable or too expensive to access. Usually, solar and wind power with or without battery backup are economic choices for such end‐users.
The SEF can be estimated based on the fuels or primary energy used to generate electricity. If wind, solar, or small hydroelectric generation systems are used, the SEF is unity because the energy source is a renewable primary source and practically no transmission losses are involved. For generation systems that use non‐renewable fuels, the efficiency of the generation system should be included in the estimation of the overall source‐energy factor.
12.6 Chapter Review
This chapter discusses the economic development aspects of energy production, conversion, and use. Sustainable development requires meeting the current needs without compromising the ability of future generations to meet their own needs. Basic needs of all communities around the world include access to clean freshwater, sanitary services, food supply, and adequate energy supply. While all these commodities are interrelated, reliable and continuous energy supply is central to the availability of others. However, energy‐related activities are the major sources of ground‐level air pollution, acid rain, and global climate change.
Significant amounts of water are used for energy production and processing. Most of that water is evaporated or heavily contaminated. Energy conversion uses water for cooling purposes. While the amount of water used for conversion is greater, the larger fraction returns to the same source.
Extraction, purification, and distribution of freshwater and wastewater management use energy; worldwide, the largest amount of electricity is used for freshwater collection. In developed countries, municipal and industrial wastewater treatment can consume as much energy as freshwater extraction.
The ratio of the total energy used for extraction, processing, conversion, and distribution to the energy used is represented by an indicator named EROI, which stands for “energy return on energy invested.” The value of EROI depends on the boundary at which it is defined. Wellhead or farmgate EROI is the ratio of the energy acquired to the energy consumed to find and extract (or produce) the energy source. The denominator of point‐of‐use EROI includes in addition the energy used for fuel processing and delivery. Higher EROI is more desirable since a larger amount of energy is acquired by consuming smaller energy. Hydropower has the highest EROI value among all energy sources. Coal, oil, and natural gas have higher EROI than biofuels.
Coordination of planning, development, and operation of an energy system to supply the needed energy is known as energy management. Resource coordination, supply‐side energy management, and load‐side energy management are interlinked and assure effective use of resources while minimizing the environmental impacts.
Energy delivered to consumers is produced using a mix of various primary sources. Source‐site ratio relates energy used on site to all primary sources consumed for production, conversion, and transportation of secondary sources supplied to end‐users. Electricity has higher source‐site ratio than fuels because of the conversion losses.
Carbon footprint of energy consumers includes the carbon dioxide equivalent of all greenhouse gases released throughout the energy supply chain from extraction and production of primary sources to the delivery of fuels, electricity, and all types of energy carriers to the point of use.
In conclusion, sustainable development of the humanity depends on sensible use of energy without exhausting the available resources and by preserving water and food supply, eco diversity, and global climate.
Review Quiz
- Which organization established the sustainable development goals?
- OECD
- United Nations
- OPEC
- IEA
- Which one of the gases below has higher global warming potential?
- Carbon dioxide
- Methane
- Nitrous oxide
- Carbon monoxide
- In a thermoelectric power station water is mainly used for
- cooling the working fluid.
- cleaning the facility.
- fuel processing.
- fuel production.
- Which process below consumes more energy than others?
- Freshwater extraction
- Water purification
- Wastewater treatment
- Water transport
- Which gas below is not considered a toxic pollutant?
- Carbon monoxide
- Sulfur dioxide
- Nitrous oxide
- Carbon dioxide
- Which type of electric power plant below has the highest emission rate?
- Nuclear
- Geothermal
- Coal fired
- Natural gas
- In energy systems EROI means
- total energy used to produce and deliver an energy source.
- energy returned over the input of a conversion system.
- energy recovered on input energy.
- energy resources gained over financial investment.
- A fuel is more preferable if it's EROI is
- larger.
- smaller.
- zero.
- negative.
- Which energy source below has the highest source‐site ratio?
- Coal
- Fuel oil
- Electricity
- Natural gas
- Production of which secondary energy source uses the largest amount of water?
- Petroleum
- Nuclear energy
- Natural gas
- Electricity
Answers: 1‐b, 2‐c, 3‐a, 4‐c, 5‐d, 6‐c, 7‐a, 8‐a, 9‐c, 10‐d.
Research Topics and Problems
Research and Discussion Topics
- Draft a paper on the energy use for purified water sold in PET bottles.
- Estimate the total CO2 equivalent greenhouse gas emission of your home over one year using the information from utility bills and additional fuels purchased.
- Compile data from official websites and draft a report discussing the environmental and economic implications of adding ethanol to gasoline.
- What are the environmental benefits and possible challenges of storing and purifying rainwater on site for domestic use?
- What are the environmental implications of producing artificial snow in a large ski resort?
Problems
- Efficiency of a 100‐MW thermoelectric power station is 30% when it operates at full capacity. Compare the GWP of this power plant (a) when bituminous coal is burned as a primary source. and (b) if the station is converted to natural gas assuming that its efficiency remains the same.
- A 50‐gal residential water heater burns 250‐Therm in one year (1 Therm = 105 Btu). If the same size electric water heater powered from the utility grid provides the same amount of hot water, how much source energy would each heater consume?
- How much electric energy is consumed to fill a 3000‐gal tank installed on a 150 ft tower? Assume 80% efficiency for the motor and pump.
- 4. A car has the average fuel consumption rate of 16 miles per gallon. (a)
- How much carbon dioxide is released per mile if the fuel is regular gasoline? (b)
- How much carbon dioxide is released per mile if the fuel contains 10% ethanol?
- Estimate the amount of water used to supply a 100‐W lightbulb for 10 hours in the US grid?
- Given the emission rates of electric generation in a region, calculate the carbon footprint of a household that consumes 8000 kWh in one year. CO2: 725 kg/MWh; SO2: 1.7 kg/MWh; NOx: 1.6 kg/MWh.
- The fuel mix of an electric utility is given below. Determine the total carbon equivalent greenhouse gas emission per kWh electric usage. CO2: 563 kg/MWh; SO2: 0.54 kg/MWh; NOx: 0.41 kg/MWh.
- Calculate the yearly source‐energy consumption for the residence with the energy consumption profile described in Figure 12.12.
- A farmer uses electricity supplied from the utility grid to pump irrigation water from a 50‐m deep well. Assuming 80% overall efficiency of the pumping system, calculate the energy intensity in kWh/l for 500 l per minute flow rate.
- Estimate the carbon dioxide emission avoided in one year by using on‐site solar energy for water heating in a residence where in average 40 l/day of water is heated 25 °C above ambient temperature.
- Estimate the yearly carbon dioxide offset by using twenty solar landscaping lights from dusk to dawn instead of twenty 5 W lightbulbs supplied from grid electricity.
- A family uses 12 000 kWh electric energy in one year. (a) Calculate the electric energy generated by the power plants in the region to supply this family considering 4.49% total transmission and distribution losses. (b) Given the fuel mix of the electric utility supplying the information below, estimate the carbon footprint of this family due to electric usage.
Regional fuel mix: Gas (16.7%); Coal (49.8%); Nuclear (27.6%); Hydro (0.9%); Wind (3.2%); Biomass (0.6%); Solar (0.1%); Oil (0.4%).
Recommended Web Sites
- EPA Energy Star: www.energystar.gov
- WRI Greenhouse Gas Protocol: https://ghgprotocol.org
- Intergovernmental Panel on Climate Change (IPCC): https://www.ipcc.ch
- International Energy Forum: https://www.ief.org
- NREL BeOpt: https://beopt.nrel.gov
- NREL Building Optimization Tool: https://beopt.nrel.gov
- Passive House Institute (PHI): https://passivehouse.com
- Passive House Institute US (PHIUS): https://www.phius.org
- United Nations Sustainable Development Goals (SDG): https://www.un.org/sustainabledevelopment
- United Nations Water: https://www.unwater.org
- US Environmental Protection Agency (EPA): https://www.epa.gov/energy
- US EPA Power Profiler: https://www.epa.gov/energy/power-profiler#/
- US Green Building Council: https://new.usgbc.org
- World Energy Council (WEC): https://www.worldenergy.org
- World Resources Institute (WRI): https://www.wri.org
References
- CEC (2005). California's Water‐Energy Relationship. Sacramento, CA: California Energy Commission.
- CPUC (2010). Embedded Energy in Water Studies Study 1: Statewide and Regional Water‐Energy Relationship. Sacramento, CA: California Public Utilities Commission Energy Division.
- Deru, M. and Torcellini, P. (2007). Source Energy and Emission Factors for Energy Use in Buildings. Golden, CO: National Renewable Energy Lab.
- DOE (2014). The Water‐Energy Nexus: Challenges and Opportunities. Washington DC: US Department of Energy.
- EIA (2016). Energy and Air Pollution‐World Energy Outlook Special Report. Paris: Energy Information Agency.
- EIA, 2019. U.S. Energy Consumption by Source and Sector, 2018. [Online] Available at: https://www.eia.gov/totalenergy/data/monthly/pdf/flow/electricity.pdf [Accessed 4 August 2019].
- EPA, 2018. Energy Star Portfolio Manager Technical Reference: Source Energy. [Online] Available at: https://www.energystar.gov/buildings/tools-and-resources/portfolio-manager-technical-reference-source-energy [Accessed 4 August 2019].
- EPA, 2019a. Emissions & Generation Resource Integrated Database (eGRID). [Online] Available at: https://www.epa.gov/energy/emissions-generation-resource-integrated-database-egrid [Accessed 16 August 2019].
- EPA, 2019b. Power Profiler. [Online] Available at: https://www.epa.gov/energy/power-profiler#/ [Accessed July 2019].
- Gagnon, N., Hall, C.A.S.,.a., and Brinker, L. (2009). A preliminary investigation of energy return on energy investment for global oil and gas production. Energies (http://www.mdpi.com/journal/energies) 6.
- Hall, C.A.S., Lambert, J.G., and Balogh, S.B. (2013). EROI of different fuels and the implications for society. Energy Policy (http://www.elsevier.com/locate/enpol) 10.
- IEA (2009). Bioenergy – A Sustainable and Reliable Energy Source, Main Report. Paris: International Energy Agency.
- IEA (2016). Water Energy Nexus (Excerpt From World Energy Outlook 2016). Geneva, Switzerland: International Energy Agency.
- IEA (2018). Energy, Water, and the Sustainable Development Goals (Excerpt From World Energy Outlook 2018). Paris: International Energy Agency.
- IPCC (1996). Climate Change 1995, The Science of Climate Change: Summary for Policymakers and Technical Summary of Working Group I. Cambridge, New York: Cambridge University Press.
- IPCC (2014). Renewable Energy Sources and Climate Change Mitigation. New York, NY: Cambridge University Press.
- LLNL‐DOE, 2015. Carbon Flow Charts. [Online] Available at: https://flowcharts.llnl.gov/commodities/carbon [Accessed 15 August 2019].
- Murphy, D.J. and Hall, C.A.S. (2010). Year in Review – EROI or Energy Return on (Energy) Invested. Annals of the New York Academy of Sciences.
- Soysal, O.A., Soysal, H.S., and Guy, J. (2016). Evaluating the cost‐benefit of an energy‐efficient house. Journal of the National Institute of Building Sciences. February, Vol. 4(1): 16–20.
- Soysal, O. A., Soysal, H. S., and Manto, C. L., 2019. Method and instrumentation for sustainable energy load flow management system performing as resilient adaptive microgrid system. USA, Patent No. 10,169,832.
- UN, 2015. Transforming Our World: The 2030 Agenda for Sustainable Development. [Online] Available at: https://sustainabledevelopment.un.org [Accessed 14 August 2019].
- UNDP (2006). Human Development Report 2006 – Beyond Scarcity: Power, Poverty, and the Global Water Crisis. New York: United Nations Development Programme.
- WCED (1987). Our Common Future. Oxford: Oxford University Press.
- WHO (2016). Ambient Air Pollution: A Global Assessment of Exposure and Burden of Disease. Geneva, Switzerland: World Health Organization.
- WHO/UNICEF, 2019. Joint Monitoring Programme (JMP) for Global Data on Water Supply, Sanitation and Hygiene (WASH). [Online] Available at: https://washdata.org/data [Accessed 14 August 2019].
- Wu, M. and Chiu, Y. (2011). Consumptive Water Use in the Production of Ethanol and Petroleum Gasoline – 2011 Update. Chicago: Argonne National Laboratory.