
2
Performing Engineering on Projects (Part I)
How do we do engineering on projects? Engineering projects are different from other projects, so learning to be an effective manager of an engineering project starts by understanding how we do engineering on projects. We accomplish this engineering through the engineering life‐cycle. In this chapter, I summarize key aspects of how we do the initial stages of the engineering life‐cycle, which are called “requirements analysis” and “design.” We will complete our overview of how we do engineering on projects in Chapter 3.
2.1 The Systems Method
2.1.1 Motivation and Description
In Chapter 1, we introduced the idea of a project life‐cycle – a series of steps or stages through which a project progresses toward completion.
Each stage can and should be governed by a set of guidelines – which we termed processes – whose level of rigor and detail should be adapted to the needs of each particular project.
A discipline called systems engineering, which is in many ways closely related to engineering project management, has developed what we might call the system method. This is intended to increase the likelihood that a system development effort will be successful, and achieves this increased likelihood of success by placing the focus on the behavior of the system as a whole, rather than exclusively on the parts and components.
Since the objectives are so similar, we can transfer much of this thought process from systems engineering to managing engineering projects. In fact, I tend to think of engineering project management as systems engineering supplemented by a specific set of management and people skills.
As I stated in the introduction to this book, I have come to believe – through long experience – that engineering projects are quite different from other projects (such as construction projects and artistic projects – and I have managed those too). The difference centers in something that later in this book we will call risk; engineering projects, since they are inventing something new and technological, have more risks, more profound risks, and risks that tend to be centered in engineering matters.
All of this has led me to the conclusion that one cannot be an effective manager of an engineering project without employing methods for project management that account for this specific nature of engineering projects. What I have learned is how to tailor and adapt the methods of ordinary project management to the specific needs and challenges of engineering projects, in many cases by drawing upon the methods and insights of systems engineering.
In this chapter (and continuing into the next), therefore, we will summarize how one performs engineering – in particular, systems engineering – on our engineering projects. With that background, in later chapters, we will be able to draw upon that knowledge to create those tailorings, adaptations, and new features that allow us successfully to address the challenges specific to managing engineering projects.
I will start by describing what I consider the systems method.
There is a natural tendency for engineers to focus on the parts and components of a system, such as computers, radios, motors, mechanical structures, and so forth. After all, they are visible, tangible artifacts; they are of a size and complexity that one can readily grasp; and some important portion of the actual system development effort involves the specification, selection, acquisition, and integration of these parts. Focusing on them is conceptually easy and comfortable.
But … it is usually the case that the reason we are building a complex system to accomplish a mission is that we desire or need something more than what is provided directly by these parts; that is, we aspire to create some emergent behavior, some “1 + 1 = 3” effect, wherein the new system will do something more than what is accomplished by the individual parts.
Let's consider an example or two. I am old enough to remember the first mobile telephones; they pretty much just had a numerical dial pad and two buttons marked “call” and “hang up.” They did not store phone numbers, but they were still a breakthrough; you could make a call while you were out and about, without having to depend on finding a phone booth.
But you needed to know the number that you were going to call. At one time, we all had little booklets into which we wrote the telephone numbers of friends and business associates. To use that mobile telephone, I would have to first look up the name of the person that I wanted to call in my little booklet, look next to their name where I had written their phone number, and then punch their phone number into my mobile phone. In the “mobile communications system” of those days (not so long ago!), storing phone numbers – and relating those stored phone numbers to names – was one function; making the actual phone call was another, separate, function.
At some point, this was improved through the introduction of a little electronic device into which I could enter the names and phone numbers of my friends and business associates. This was a big improvement (my handwriting is terrible).
But there were still two separate devices, each of which implemented a separate function.
Then, someone came along and realized that one could put both functions onto a single device. Even with no electronic integration between the two functions, this was an improvement, as I had to carry only a single device, keep only a single battery charged, and so forth.
But then something very different was introduced: Since those two functions (1 = storing phone numbers and relating those stored phone numbers to names; 2 = making the actual phone call) were both on the same device, it was now possible to allow these two functions to interact electronically. I could now just find my friend or business associate by name, and indicate that I wanted to call them. The actual phone number was automatically transferred from the first function to the second. This was a radical improvement in simplicity, ease of use, and reduction of errors!
It is also an example of what we mean by the term “emergent behavior.” The people that did this in essence created a capability that one might call “dial by finding a name on the list.” The capability to do that is not inherent in either of the “parts” (e.g. the list of names and numbers, and the phone itself), but instead “emerges” from the carefully controlled union of those parts. I like to think of such emergent behavior as a “1 + 1 = 3” effect that we are striving to create; or to use an old‐fashioned phrase, the “whole is greater than the sum of its parts.”1
Emergent behavior is critical in systems engineering and engineering projects. Almost every engineering project today is undertaken to achieve such emergent behavior. Once you realize this, then you realize that your focus as either the designer or the project manager needs to shift from being exclusively or primarily on the parts, to instead being on the system as a whole. This is the start of the systems method.
Of course, when we put parts together so as to create the desired emergent behavior, we are highly likely unintentionally to create other, undesired, unplanned emergent behavior. Such unplanned emergent behavior can range in impact from a nuisance to a serious safety hazard. As we will see later in this chapter, good designers therefore not only design their systems to provide the emergent behavior they want, they also design their systems so as to prevent other types of emergent behavior.
There is another motivation for the systems method: parts – even large parts that may look like they are complete systems – may not be usable without the complete system. Imagine having cars, but without roads, without filling stations, without traffic signals, without insurance, without spare parts and repair facilities and repair technicians, and even without traffic police. It would not work. It is the role of the systems method to help us figure out what are all of the parts that we must have; sometimes, the need for a part is obvious; sometimes, however, it is not. I have seen many systems that “forgot” what turned out to be a critical part; perhaps some data set that the computer program needed before it could operate, perhaps some special piece of test equipment, and so forth. The systems method provides a basis for actually determining early on in the project development cycle all of the parts that are needed. It does this through a technique called decomposition, wherein we conceptually break the system into segments, and then break those segments into smaller subsegments, and so forth. We in fact use decomposition throughout the systems method, decomposing different aspects of the system: the requirements, the design, the test program, and many other aspects of the problem are all analyzed through decomposition. We will say a lot more about this later.
There is yet a final motivation for the systems method: not only do we need all of the parts, but those parts must match and be in balance. Cars must be of a size that fits appropriately in the marked road lanes. The weight of the cars must be limited to that which the road can bear. The surface of the road must be reasonably smooth, but there is no reason to make it smoother than is necessary; that would certainly increase cost, and probably decrease reliability. Bumpers on all cars must be at around the same height. When we transitioned from leaded to unleaded fuel we had to ensure different sized nozzles at gas stations, sized so that people could not accidently put leaded fuel into a car that was designed for unleaded fuel.2 We had to figure out for how long we needed to sell both types of fuel, as not everyone could afford to buy a new car that used unleaded fuel right away (and the car companies could not have built that many cars in a single year, anyway). And so forth. Parts must match, and be in balance. We want the car to drive smoothly, and with only a reasonable level of noise. How much of that noise control is to be achieved by the road surface? By the tires? By the suspension? By the shock absorbers? These must not only be in balance in order to achieve the desired effects; we must avoid putting effort into improving a single part if the effect of that improvement at the system level is either not worth its cost, or if other factors prevent there from being any improvement at all!
Here's an example to consider: society will have another very complicated system transition as we start introducing driverless cars. For many years, perhaps for decades, we will have both driverless and human‐driven cars sharing the roads. How will insurance and liability work? Will we, at some point, require driverless cars to be connected to a network, so that we can route such driverless cars so as to even out traffic congestion? Will we at some point ban human‐driven cars? After all, human‐driven cars kill tens of thousands of people every year in the United States alone; once the driverless technology is really mature, such driverless cars are likely to be far safer than human‐driven cars. Will we then abandon lane markings, and let the driverless cars crowd together, so that we can fit many more cars on the same roads? Doing some of these things would seem to be essential in order to achieve the real benefits of driverless cars – many fewer accidents and fatalities, and the ability to fit far more traffic on the same roads with less congestion. Yet there will be significant social resistance to all of these changes. These are all examples of the questions we consider when using the systems method.
The systems method guides us through all of these issues (see Figure 2.1).
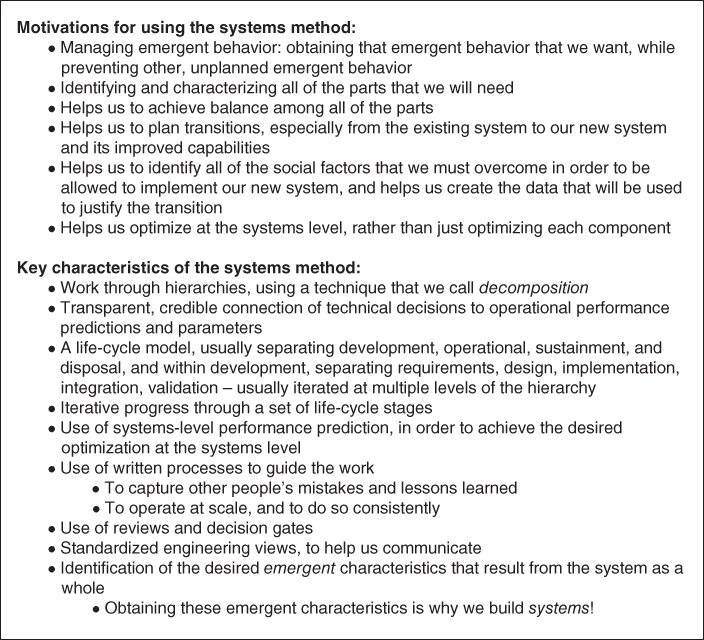
Figure 2.1 Motivations for employing the systems method; key characteristics of the systems method.
Figure 2.1 points out that one of the key characteristics of the systems method is the use of hierarchies and decomposition. You will see that we use hierarchies and decomposition over and over again in project management (and in this book). We describe the product or system we aspire to create by decomposing it into a hierarchy of parts. For example, in Figure 2.2, we depict and describe the world air transportation system by decomposing it into a set of constituent parts – airports, airplanes, and air traffic control – which form level 2 of our hierarchy. We can then decompose each of these level‐2 components further into smaller parts; in the figure, I have decomposed airplanes into fuselage, engines, avionics, and passenger equipment. The decomposition can then continue to further levels. Such decomposition into a hierarchy helps us understand complex entities.
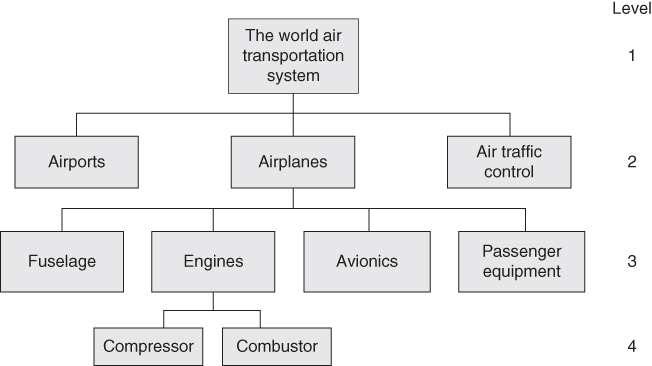
Figure 2.2 An example of decomposing a system into a hierarchy.
We will discover that we can use such hierarchies and decomposition to represent and analyze many other items, not just the systems and products themselves. In particular, we can use them to represent and analyze our methods and intermediate work products (e.g. requirements, design, approach to testing, and so forth).
In Chapter 1, we introduced the idea of a project life‐cycle, a series of steps or stages through which the project moves as it progresses. In Figure 2.3, I expand the list that we used in Chapter 1 to form my own version of the stages of the project life‐cycle; other people use slightly different versions of this list.
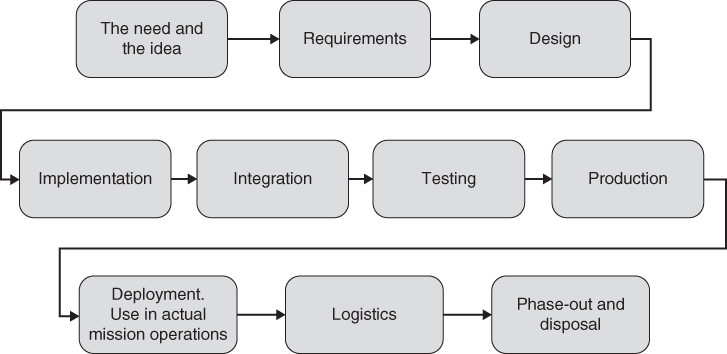
Figure 2.3 Neil's version of the stages of the project life‐cycle.
Next, I will describe each stage:
- The need and the idea. In this stage, we try to understand the stakeholders, their needs, and their constraints. What is their mission? How do they do it? What is their product? How do they do their mission today? Why is that how they do it? What constrains the possibilities? What do they value? How do they measure that value? We also look at technology, techniques, and capabilities that are available to use in building the system. What can they really accomplish? What are their limits and side‐effects? How mature are they (e.g. reliability, consistency, safety, predictability, manufacturability, etc.)? Can they be used productively in ways other than their original intent? In this stage, we are trying to understand broad needs and potential enablers, but not yet trying to define specific requirements.
- Requirements. The formal statement of what the new system is supposed to do, and how well it is supposed to do it. The what is a qualitative statement of a capability. For example, “The car shall be able to travel in both the forward and reverse directions, and the direction of travel shall be selectable by the driver.” The how well is a quantitative statement. For example, “The car shall average 30 miles per gallon of fuel under the following conditions: X, Y, and Z,” or “The noise level inside of the car shall not exceed 55 dB at speeds below 70 miles per hour, while traveling on road surfaces that meet the following conditions: A, B, and C.” Requirements (of both types) are written down and placed into documents called specifications. Meeting the requirements, as documented in the specifications, is usually mandatory; that is, you may not get paid (or may get paid less) if the system you deliver at the end does not meet every single requirement in the specifications. Requirements – like so much else in systems engineering – are created in a hierarchy: we create requirements for the system as a whole, and then for the major functional elements of the system, and perhaps even a level below that; we do this using the decomposition process.
- Design. The requirements say what the system is supposed to do, and how well it is supposed to do it. The design, on the other hand, says how all of this is supposed to be accomplished; for example, will our car use a gasoline engine, a diesel engine, or a battery with an electric motor. The design will likely be quite technical at times, specifying, for example, particular algorithms, particular materials, particular structural methods, and so forth. The design, like the requirements, is also created in a hierarchy: for the system as a whole, for the major components of the system, and so forth. Note, however, that the hierarchies for the requirements and the design are seldom, if ever, the same: one is a decomposition of what and how well, the other a decomposition of how. The two hierarchies are related, but they are not the same. The top level of the design hierarchy describes how the system as a whole will be implemented, and in particular, will describe how we are to achieve the emergent behavior desired for our system. Lower levels of the design hierarchy describe successively smaller pieces of our system, and how those pieces interact. The lowest level of the design hierarchy describes how each of the smallest pieces are to work internally.
- Implementation. Through the decomposition process embodied in the hierarchy for the design, we arrive at the bottom of our top‐down definition process (e.g. the left‐hand side of the “U”; see Figure 2.4, below): the naming and describing of each of the little pieces into which we have decomposed our system through the design process. We now have requirements specifications and designs for all of these little pieces and, therefore, we are ready to go and build them. Any given such piece might consist entirely of hardware; or entirely of software; or entirely of data; or some combination thereof. We may not need a hierarchy for this stage; we may commission a set of independent teams each to build one or more of those little pieces.
- Integration. When people started building systems, especially systems with lots of software in them, their original concept was to finish all of the implementation, then put all of the pieces together, and then proceed to test the system. It was quickly discovered that this seldom worked in a predictable and consistent fashion. The complete system, with its hundreds of separate parts and lots of software (nowadays, perhaps millions of lines of software code), turns out to be too complex for this sort of put‐it‐together‐all‐at‐once approach to work. So, gradually, the need for a phase between implementation and testing was recognized, which we now term integration. The purpose of the integration phase is to put the parts together, at first in small subsets of the whole, and gradually working one's way through the integration of ever‐larger subassemblies toward having the entire system. At this stage, we are not yet testing the system; instead, we are just trying to make it operate in an approximately correct fashion. Distinguishing integration from testing has been a gigantic boon to systems engineering and engineering project management; many projects today, however, still neglect the integration stage, and usually suffer greatly from that neglect. We will talk much more about the integration stage in the next chapter.
- Testing. Having conducted implementation (which builds all of the pieces of our system) and integration (which assembles all of the pieces of our system, and sorts out enough problems that the system operates in a reasonably correct fashion), we can then turn to the problem of testing our system. For most systems, we will do two different types of testing. First, we have our specifications that contain our requirements: the mandatory statements of what and how well for our system. We have to conduct some type of rigorous process to make sure that our system meets each and every one of these requirements. In this book, I call this first form of testing verification. Such verification, however, is not sufficient; I have seen plenty of systems which meet their requirements but were disliked by their intended users. Therefore, we must also assess a set of more subjective matters, such as “Can this system be used by the intended users, or is it too difficult for people with their education, experience, and training?” Or perhaps our systems is used by people who are in stressful situations (such as power plant operators, police, ambulance dispatchers, doctors, or soldiers); is the system designed in such a way that it can realistically be used by people under such stresses with only a reasonable number of errors? In this book, I call this second form of testing validation.
- Production. Our system development (e.g. all of the life‐cycle stages through testing) yields us one copy of our system. Sometimes – such as for a satellite project – that is the only copy of our system that we will build. But more often, we then make additional copies of our system. This making of additional copies of our system is called production. Production may range in scale from making 10 copies, to 1000 copies, to 1 000 000 copies, or today, even 100 000 000 copies. The techniques used for production will need to vary significantly, depending on the scale of the production required. We must also perform some testing to ensure that our production copies are correct; this testing is usually far less in extent than the testing we perform on the first article, however.
- Deployment. Our system needs to be placed into service. That is often a complicated endeavor on its own. For example, a satellite needs to be launched into space. Or a new billing system probably needs to be operated in parallel with the existing billing system for a while, before we disconnect the existing billing system and switch over to the new one. Or our millions of new mobile phones need to be sent to retailers and sold. This process of placing our new system into service is called deployment.
- Use in actual operation. Once our system is in actual use (e.g. we have completed a successful deployment), it can finally be used by the intended users, and bring them the benefits for which it was designed. But those users need support: someone has to create training materials for the new system, and perhaps even conduct actual training classes. Things break, and someone has to diagnose and fix them. To effect those repairs, we will need replacement parts; we need someone to make those replacement parts. It is likely that we will continue to find errors in the system – even after the test program has completed – and we will need to fix those errors. Most systems are operated for a long time, and our users expect us to design and implement improvements to the system over the course of the time that the system is operated. There are many other, related aspects of supporting our new system in effective operations.
- Phase‐out and disposal. All good things come to an end, and someday – perhaps long after we have retired – our system will reach the end of its usable lifetime and will need to be taken out of service. This can be a very complicated and expensive activity on its own, and in such cases, methods to implement the retirement and disposal of the system should be designed into the system from the very beginning. A satellite might need a special rocket motor to deorbit the satellite, so that it burns up in the Earth's atmosphere. A nuclear power plant needs to be designed so that all of the radioactive materials can be taken out when they are expended, and then properly stored or reprocessed. Even mobile phones (and other consumer devices that contain batteries) need special disposal procedures, so that we do not create inappropriate dangers through pollution caused by old batteries. In other cases, we may have to figure out how to safely retire and dispose of a system where no such preparations were made. The world has many dams, for example; all have finite lifetimes, but methods, materials, and funds to dispose of them are seldom worked out until the dam is ready to be retired.
This is our basic system life‐cycle; every project may have its own small variations and changes in nomenclature, but the general intent is usually very similar to that which I have described.
In each stage of the project life‐cycle, we perform a mixture of activities:
- Technical
- Project management
- Agreements
- Planning and replanning
- Monitoring
- … and so forth.
Each of these activities can and should be governed by a set of written guidelines – which we in this book will call processes – whose level of rigor and detail should be adapted to the needs of each particular project. An engineering process is simply a written description of the steps, guidelines, constraints, inputs, and outputs that we use to perform engineering activities. We will return to the subject of such project processes later on in this book.
2.1.2 Life‐Cycle Shapes
An interesting insight is that engineering project life‐cycles can have shapes. I will describe three of the most common such shapes: “U,” waterfall, and spiral.
I start with what I call the “U” diagram (Figure 2.4). The concept is clear: we start our project in the upper left, defining our requirements, and then creating our design. As noted above, these stages proceed in a hierarchy; we do requirements at the system level, and then for each smaller segment of our system. We do design at the system level, and then for each smaller segment of our system. That is, we perform the requirements and design stages by starting at the system level and working our way “down” the hierarchy (where “down” in this context signifies from the system level to ever smaller pieces of the system).
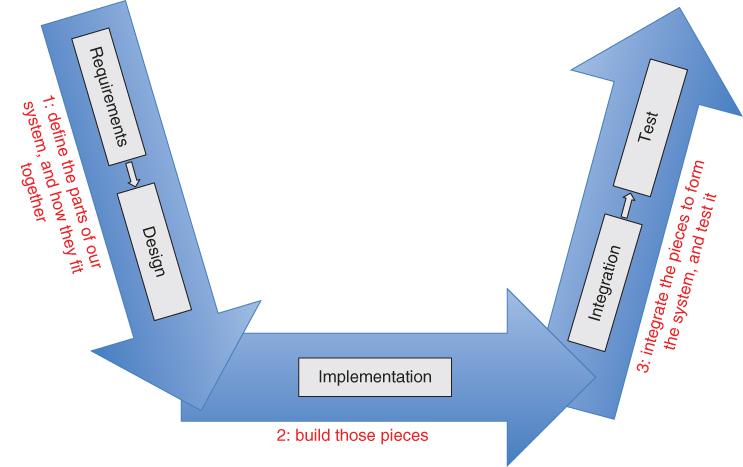
Figure 2.4 Neil's “U” diagram.
To make it clear what we mean by such a hierarchy, consider the example that we presented in Figure 2.2:
- The air transportation system can be considered to consist of the following major parts: airplanes, airports, and air traffic control. These items – airplanes, airports, and air traffic control – form the second level of this system's hierarchy.
- An airplane consists of parts too, such as the fuselage and the engine(s). Those parts form a third level of our hierarchy.
- An airplane engine also consists of parts, such as a compressor and a combustor. The compressor and combustor form a fourth level of our hierarchy.
We say that the requirements and design stages are performed top‐down, referring to the direction of motion through the hierarchies and through the “U” diagram.
Having completed our requirements and our design, we are ready to implement all the pieces of our system defined by our design. This portion of the diagram is drawn horizontally, because we may not use a hierarchy for this stage; we could just commission independent teams to implement each of the pieces we have defined.
We are then ready to move upward through the right‐hand side of the diagram. Having implemented all of the pieces, we start putting those pieces together, at first in small subsets of the system, and gradually progressing to larger subsets, until we finally have the entire system interconnected and operating to some initial degree of correctness; as noted above, I call this process integration. We then perform testing: the verification that our system is effective (e.g. satisfies all of its formal requirements) and the validation that our system is suitable (e.g. meets the needs and desires of its intended users). On this side of the diagram, we show the arrow pointing upward, because we progress from small pieces and subassemblies, through larger subassemblies, to the entire system; that is, in this portion of the diagram, we say that we are proceeding bottom‐up.
Many other people use a similar diagram, which they generally call the “V” diagram; it basically has the left and right sides of my “U.” But the “V” version of this diagram either omits the implementation steps, or it places that actual building of the pieces on the right‐hand side. I object to either of those approaches. Obviously, the implementation is important, and ought not to be omitted. Perhaps more subtle is the idea that the purpose of the left‐ and right‐hand sides of the “U” diagram is to show that these activities proceed in a hierarchy. The actual implementation of the pieces that we have defined through the decomposition on the left‐hand side, however, need not proceed in any sort of hierarchy; if we have decomposed our system into 500 little pieces, we might well build the 500 little pieces pretty much independent of each other. We resume working in a hierarchy (bottom‐up, on the right side of the “U”) when we start putting small numbers of those pieces together through the integration process. Hence my preference for the “U” shape over the “V.”
The “U” diagram does not depict the latter stages of the project life‐cycle (e.g. production, deployment, actual use of the system, retirement, and disposal); neither do the related “V” versions of this diagram. Instead, this “shape” concentrates on the stages that occur during the actual development of our system. Indeed, some of those later phases (e.g. use of the system in actual operations) are not actually “projects,” as I defined that term in Chapter 1; instead, they are what I defined as “continuous business operations.”
The next shape for a project life‐cycle that I will discuss is called the waterfall (see Figure 2.5). The so‐called waterfall method was introduced by Dr. Winston Royce in 1970.3 Dr. Royce's purpose was to bring some order to what he perceived as the chaos that seemed to him to be a recurring feature of large software development activities. His recommendation was for a series of particular steps to be undertaken in a particular order, while endeavoring to complete one step before beginning the next. He believed that the need to perform all of these steps was not universally recognized – he actually said that some customers believed that doing some analysis, and then doing the coding, was all that would be required to deliver a software product – and therefore, part of his goal was to advocate the use of the complete set of steps. Although his terminology is in some ways specific to software systems, you can see that, in concept, Dr. Royce's list of steps is not very different from the list of stages that I presented above.
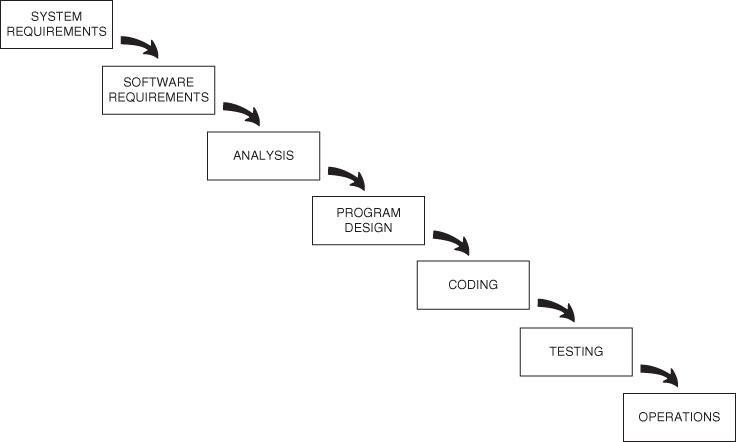
Figure 2.5 Dr. Royce's first depiction of the waterfall method.
Source: Used with the permission of Dr. Royce's son, Walker.
It is difficult to overstate how important and influential Dr. Royce's work has been. Large companies, like TRW and IBM, created corporate software development policies that more or less adopted Dr. Royce's approach in toto. So too did the US Department of Defense, and through the Department of Defense's contractual terms that mandated that companies who were building software (and later, systems) for the US Government follow those standards, in fairly short order the entire world was following the waterfall method.
There is an additional insight that Dr. Royce provided: a recognition that things do go wrong, and one might at times have to go backwards (Figure 2.6).
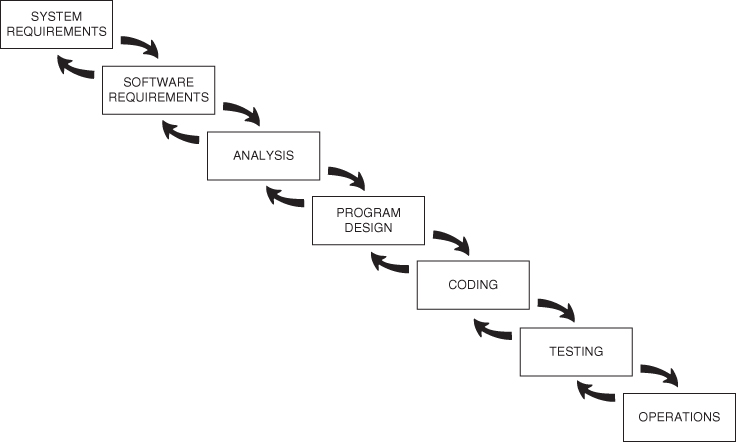
Figure 2.6 Dr. Royce's second depiction of the waterfall method.
Source: Used with the permission of Dr. Royce's son, Walker.
The depiction of Figure 2.6 is often misunderstood. If one just looks at the drawing but does not read Dr. Royce's paper, one might get the impression that one is allowed – even encouraged – to back up as many steps as wished. This is not so! Dr. Royce is very clear that the desired approach is to be thorough enough at each step that one never has to back up more than a single step. His original caption for this figure actual reads “Hopefully, the iterative interaction between the successive phases is confined to successive steps.”
The waterfall method contributed huge value through its “normalization” of the necessity for steps other than analysis and coding, and through its promulgation of the idea that there should in fact be a planned sequence of steps.
In short, the waterfall method was aimed at introducing some organization and structure into what was perceived to be an overly chaotic approach to systems engineering and engineering project management. But the waterfall method also implied a rigorous sequencing of (i) doing all of the requirements, then (ii) doing all of the design, then (iii) doing all of the implementation, and so forth; in fact, many of the corporate and government development policies that were created in the wake of Dr. Royce's paper said explicitly: finish one step before you proceed to the next, and go through the life‐cycle exactly once.
Experience, however, soon showed that this was too constraining to be practical for many projects, especially those of larger scale and complexity. At times, people would achieve success through an incremental approach that involved a sort of successive approximation, by building a well‐defined partial version of the system, operate that version for a while to gain additional insight, then build a second well‐defined partial version of the system, operate that version for a while to gain additional insight, and so forth.
What to do? Live with the perceived inflexibility of the waterfall method, or return to the pre‐waterfall chaos? Neither of those choices seemed very good.
Fortunately, someone came along and proposed a new method – and a new project life‐cycle shape – that solved this dilemma, allowing the continued rigor and organization of the waterfall method, while creating a structured framework for successful development through incremental, successive approximations of the eventual system. The person who first put this forward as a candidate formal method was Dr. Barry Boehm,4 in 1986;5 he termed it the spiral model. The spiral model (Figure 2.7) forms a third shape for a project life‐cycle.
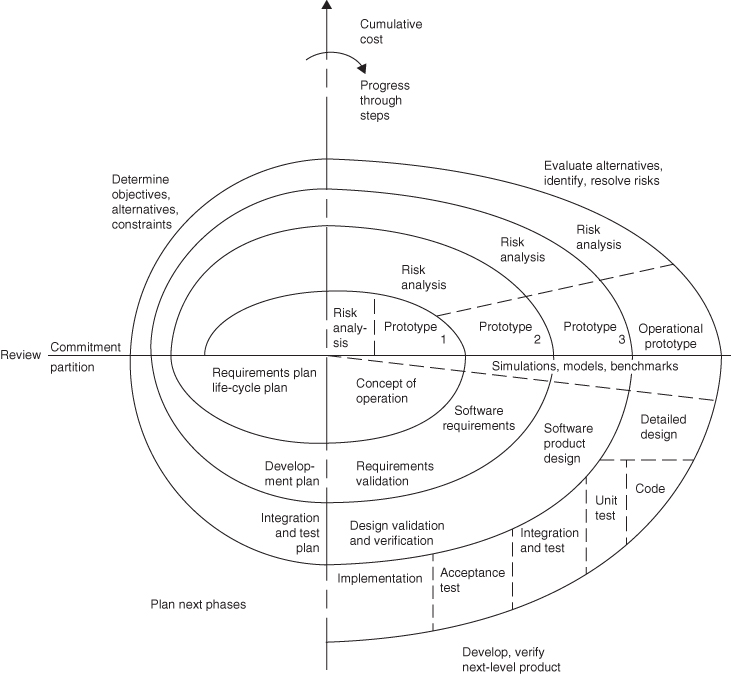
Figure 2.7 Dr. Boehm's spiral method.
Source: Used with the permission of Dr. Boehm.
The point of the spiral method is that we develop a carefully thought out partial version of our system, and then we deliver that partial version to the users (Dr. Boehm calls this a prototype in Figure 2.7, but this partial version, ideally, is actually used to accomplish real work), who then use it for actual mission operations. The development team observes these operations, and thereby gains new insights into what those users actually need and want. The developers then incorporate those new insights into their plans for the next increment – which Dr. Boehm calls a spiral – of the system. This way, features or omissions that might cause the system to be unacceptable to the users get found and fixed along the way. It turns out (we quantify this in the next chapter) that fixing things earlier in the project development life‐cycle costs far less than fixing them later. Fixing them earlier, of course, also increases the user's satisfaction with the system, and their confidence in the development team.
Again, it is difficult to overstate how important and influential Dr. Boehm's work has been. All of the same organizations that in the 1970s and 1980s created policies and directives mandating the use of the waterfall method modified those policies and directives in the 1990s to allow and encourage the use of the spiral method. As a result, some variation of the spiral method is used nearly universally on engineering projects today, especially engineering projects with lots of software (which these days is most of them). Legendary computer scientist Dr. Fredrick P. Brooks says of Dr. Boehm's spiral model, “I strongly believe the way forward is to embrace and develop the Spiral Model.”6
Other shapes are possible, and have been propounded in the literature. But for the purposes of this book, we will limit ourselves to these three project life‐cycle shapes.
2.1.3 Progress Through the Stages
Whatever shape your engineering project employs, you will use some type of orderly method to determine when you are ready to move from one life‐cycle stage to the next (e.g. from requirements to design, and so forth). This method is centered around a review, which is the data‐gathering and data‐analysis exercise that forms the basis for a formal decision process (e.g. are we ready to move to the next life‐cycle stage or not?). If we determine that we are not yet ready, we then determine what are the things that remain for us to accomplish, so that we are ready to move to the next life‐cycle stage. Generally, you want a large segment of the stakeholders for your project (the development team, your company's management, the buying customer, the using customer, the paying customer, and so forth) to participate in these reviews and decisions. We include all of these people, both in order to get a full range of opinions to inform your decisions, but also to build a social consensus about the correctness of that decision.
This process is often referred to as decision gates. We call these reviews gates because we may be allowed to pass through them at this time … or we may not; that is, the gate may be either open or closed. The reviews are intended to determine the adequacy of the system to meet the known requirements (specifications and process guidelines) and constraints. Reviews become progressively more detailed and definitive as one advances through the program life‐cycle.
In toto, reviews provide a periodic assessment of your project's maturity, technical risk, and programmatic/execution risk. Equally importantly, they help one improve/build consensus around the go‐forward plans; this is why you involve so many of your stakeholders in the review process. Reviews provide you – the manager of this engineering project – with the data you need to make the decision about whether to proceed to the next phase, or return to the previous one in order to resolve some issues.
As noted above, an important characteristic of the systems method is that we strive to optimize at the systems level, not at the component level. Even if we make each component of our system the very best possible, they may interact in a fashion that provides less than the best possible performance; since we are striving to make the system as a whole the best possible, we must look at the interactions of the components, in addition to the performance of each individual component.
This may have other benefits. For example, I have frequently discovered that I could make do with a less capable version of some component in a system and still get the system‐level performance and capacity that I needed. It would be a waste of money to have paid for a better version of that particular component; limitations that arise out of the interactions of the components might prevent the improved version of that component from having a positive effect on the system as a whole.
This quest for system‐level optimization can lead to useful insights too. I once had a radio vendor on a military command‐and‐control system come to me and say that they had figured out (for a price!) how to make the signaling rate of their radio become twice as fast as it was at present. In the coordinate system of value for a radio designer, being twice as fast is of high value indeed. The radio signaling rate is an example of what I will later call a technical performance measure; this is an objective measurement within what I like to call the engineer's coordinate system of value. But before making a decision to pay that money for faster radio, I had my system‐level modelers insert a model of that faster radio into our system‐level performance model. We had created a set of metrics that measured the performance of the system not only in technical terms, but also in terms of the operational benefit to the intended users; this is what I will later call an operational performance measure, and it forms an objective measurement within what I like to call the customer's coordinate system of value (Figure 2.8). For example, we had created a metric that predicted the level of casualties on each of the opposing sides in a battle scenario; if our system design was going to add value to the customer (in this case, the US Army), the ratio of the number of enemy casualties to the number of US Army casualties should be higher than for the same battle scenario when our system was not used. We called this the loss‐exchange ratio; a higher loss‐exchange ratio indicated a better design, because that was a metric that the intended users of the system valued.
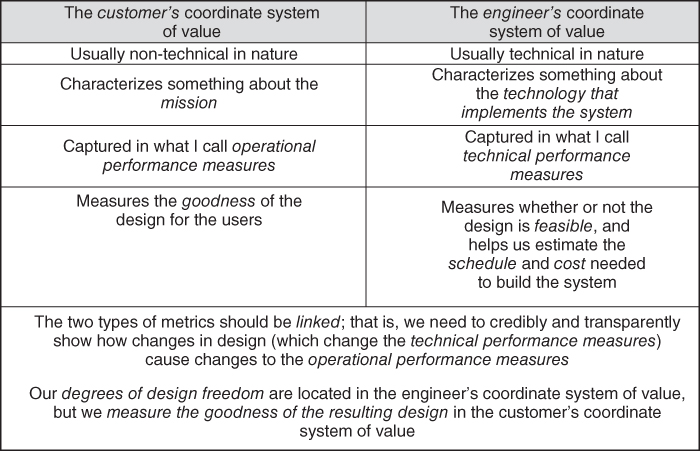
Figure 2.8 The two coordinate systems of value, and the two types of objective measurements.
When we plugged the radio with the doubled signaling rate (a highly favorable technical performance measurement, in the engineer's coordinate system of value) into our system model, the result was no improvement at all in the system's overall performance, as measured by the loss‐exchange ratio! Therefore, in the customer's coordinate system of value, the faster radio had no value.
But we did not stop there; I asked the radio vendor and the modeling team to work together to figure out why the performance at the system level did not improve. They discovered that there was a subtle bottleneck, and this insight led to an idea for a different improvement that the radio vendor could make: leave the signaling rate the same, but decrease the time it took for the radio to acquire the channel and synchronize the encryption process. This was a far less expensive change to make than doubling the signaling rate, but led to a major improvement in system‐level performance.
My lesson: You should always ask why! And you cannot trust your intuition; the interactions inside of a complex system make it very difficult to intuit the system‐level impact of a change to a component.
We – not the Army – created the loss‐exchange ratio metric. But clearly, this metric would have more value to our design team if the customers and eventual users agreed that this metric actually reflected their coordinate system of value, that is, a better score on this metric would indicate a system that the users would actually find to be better. So, you need to take the effort to socialize your ideas for operational performance metrics with your customers, users, and other stakeholders. I like to achieve what I call the transfer of emotional ownership to the customers. This signifies that in some real sense, the metric has become theirs, rather than mine. For example, after socializing the loss‐exchange ratio metric with the US Army for several months, I learned that the Army modeling organization had started using that metric as the primary output of their own system performance models; our metric was now driving internal Army decision‐making about the future of our system. That is a transfer of emotional ownership! When you achieve that, you are building credibility with your customers, users, and other stakeholders.
Another aspect of the systems method is that we employ written guidance regarding our methods. We call such guidance processes. We have processes for every aspect of our engineering project: engineering, but also finance, hiring, managing our people, configuration control, contracting, procurement, testing, quality, safety, and many other items (many of which we will cover over the course of this book). Each process will specify in writing what is to be done, when, by whom, what the products will be, what artifacts will be created, how the work is measured and quality ensured, who approves the work and the artifacts, and many other aspects.
Figure 2.9 summarizes the range of processes that we use in an engineering project.
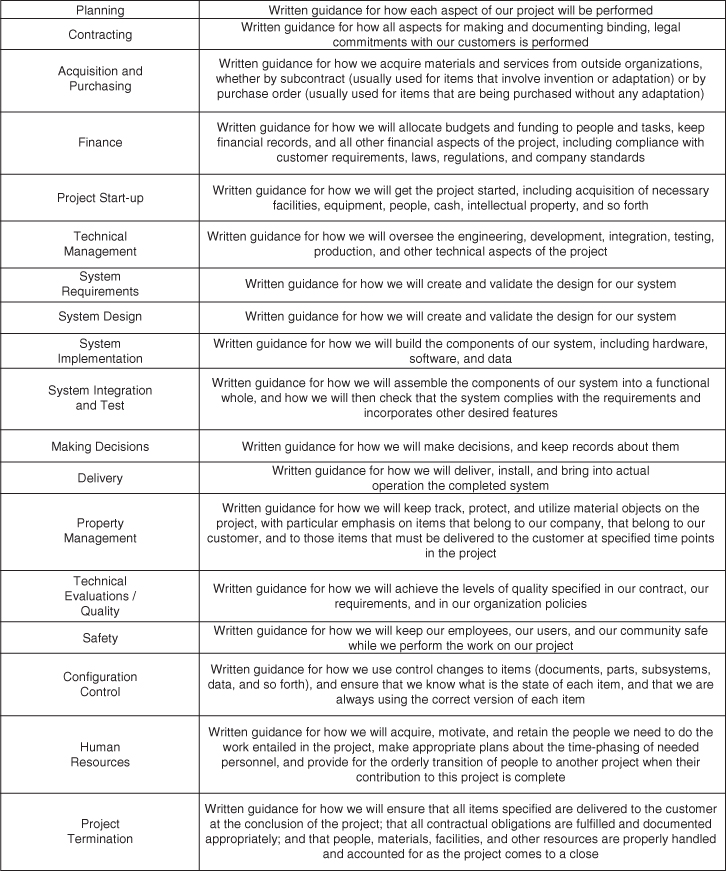
Figure 2.9 Examples of the range of processes that we use on an engineering project.
Why go to the trouble to create and employ such written process? Because engineering a complex system is hard. Dr. Eberhart Rechtin7 said that:
- Success comes from wisdom
- Wisdom comes from experience, and
- Experience comes from mistakes.
When possible, it is best to learn from the mistakes of others, rather than learning only from mistakes that one makes oneself. And that is the role of engineering processes – they allow us to learn from the mistakes of others. They are the “lessons learned” from past activities.
There is a caveat: processes are necessary – they help us be repeatable, and operate at scale. But processes by themselves are not sufficient to ensure a good design! We need both good processes and a good design. Good designs come from good designers, not from good processes.
Some companies have gone through a phase of assuming that good processes are in fact sufficient to ensure good design; the result was a series of expensive project failures.
We discuss how to achieve a good design later in this chapter.
Lastly, the systems method involves a lot of planning. We formulate and write plans about how we are going to perform each of the various aspects of the project, ranging from how we will validate the technical requirements, to how we will acquire the people with all of the specialized skills we need (and at the right time, and in sufficient quantity), to how we will keep our people (and the general public) safe as we perform this work.
2.2 Requirements
One of the first stages in the project life‐cycle is the process of creating and validating the requirements for our system.
Let's start by considering why we think about requirements. It is a fact that people often just do things, without having given a lot of consideration to the detailed nature of the problem, or without having spent a lot of time considering what is the best approach to use. Is that how successful people attack a problem?
I have been told that someone once asked the famous physicist Albert Einstein how he would allocate his time, if he had only an hour in which to solve a problem. His answer?
- 45 minutes to understand the problem
- 5 minutes to formulate a solution
- 10 minutes to implement the solution
(He left off verifying the solution.)
That is, Dr. Einstein would allocate 75% of his time just to the task of understanding the problem, before he started doing any actual work to formulate or create a solution.
On real engineering projects, we generally cannot allocate 75% of the time to this single task, but the point I take away from this (potentially apocryphal) story is that this particular highly successful person8 believed that the path to success entailed allocating a significant portion of time to the question of understanding the problem to be solved.
In systems engineering and in engineering project management, therefore, we try to understand the problem, and then we write down what we have decided.
Requirements is the term we use for the formal, written statement of the problem that we are trying to solve by building an engineered system. Requirements are a statement of what the system is supposed to do, and how well it has to do it. But requirements are not a statement of how the system does it; how it does it is the design (which we will discuss next). See Figure 2.10.
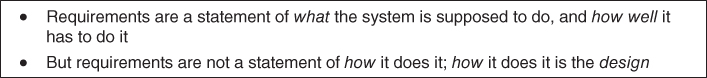
Figure 2.10 Definition of the terms requirements and design.
Let us illustrate this definition with an example. What is a car supposed to do? We might say that a project to create a car “shall provide a separate physical entity that is capable of moving under its own power over a paved road from one location to another, under the control of a human being.” That is a statement of what. We might also say that “The car shall be able to reach a speed of at least 50 miles per hour, sustained for 2 hours without needing to stop for refueling or any other purpose.” This is a statement of how well. The question of whether our car uses an internal combustion engine and gasoline, or an electric motor and a battery – or a hamster in a cage – is a question of design, that is, how we accomplish the what and the how well. We choose the design after we have specified the requirements; the what and how well requirements stated above do not tell us what type of engine to use. We might have a how well requirement about limitations on the pollution generated by the operation of our car, but ideally, that requirement does not tell us what type of engine to use either.9 Nor do either of our requirements determine whether the car should have three or four wheels, how large those wheels and tires should be, and other considerations of how; those are design decisions.
Here's another example. One of the US Army's short‐range air defense weapons – called the Avenger – has a missile operator in a turret on the back of a small truck (see Figure 2.11). There are eight missile tubes located on the top of this turret. A radar located somewhere else sees objects flying in the sky, and a computer makes a preliminary assessment about which ones are friendly aircraft and which ones might be hostile aircraft. Information about both types of aircraft are sent by a data radio to the depicted unit, which receives that information and displays it on a computer screen with a map. The weapons operator may select an aircraft that he thinks he may want to shoot down. But … before he is allowed to shoot, he is required by US Army policy visually to look at the aircraft through a magnifying optic, and make a determination, based on the training that he has received, that in fact this is a hostile aircraft (and not a friendly aircraft). Only after making such a visual identification may he press the button to shoot a missile. All of this, by the way, takes place while the depicted unit is moving, driving either on a road or cross country.

Figure 2.11 Avenger air defense weapon.
But how is the operator to perform this visual identification? When he selects the aircraft that he thinks he may want to shoot down, the turret on the back of the truck turns and elevates so that the magnifying optic is pointing at the correct aircraft, and the turret continues to adjust its position automatically, so as to keep that aircraft in the field of view of the optic. This process is called “slew‐to‐cue,” and there are written requirements defining exactly what the slew‐to‐cue process must accomplish, both what (e.g. “Upon designation of a candidate target aircraft by the operation, the computer shall compute and issue the appropriate commands to the turret's positioning motors so as to adjust the position of the turret in both azimuth and elevation, and to continuously update these positions as both the aircraft and the weapon continue to move”) and how well (e.g. “Upon slew‐to‐cue, 90% of the time, the designated aircraft will be in the narrow field of view of the launcher's optics”). Note that neither of the statements of what and how well says anything about how we will accomplish this; the choice of computer, programming language, algorithms, servo‐motors, rate sensors, and so forth is left to the design activity.
But suppose we were at the beginning of our air defense project. You do not yet have all of the information contained in the previous two paragraphs. What might we have when we started the project? Probably, we have only some statements of objectives and constraints from the customer, such as
So, what do you do next? My approach is to start by gaining an understanding of the customers, especially the eventual users. What is their mission? What are the constraints placed upon them? How do they accomplish their mission today? What do they like about the way they do it today, and what do they think needs improvement? Out of questions like these, you can start to distill a statement of what I call the customer's coordinate system of value (please review Figure 2.8): What do they value? How do they measure it?
Some of this might already be written down (in policy manuals, training manuals, and so forth), but much of it will not be. You have to go and talk to people, listen to people, and equally important, watch them while they work.
In my experience, it is vitally important that this knowledge be acquired by the engineers on the project; it is not sufficient for the project engineers to depend on other people (“domain experts”) for this knowledge. I find that we need to have both the domain knowledge and the engineering skills in a single brain. Only then are we able to create useful new insights.
Let's go back to our air defense example. After you read the manuals, talk to people, go on exercises, and watch air defense personnel train in their mission, and maybe even go to a theater of war and watch them conduct real operations, you can start creating a more detailed list of the key steps, functions, and attributes needed to accomplish the short‐range air defense mission. It might look like Figure 2.12. Are we done? Are those requirements?
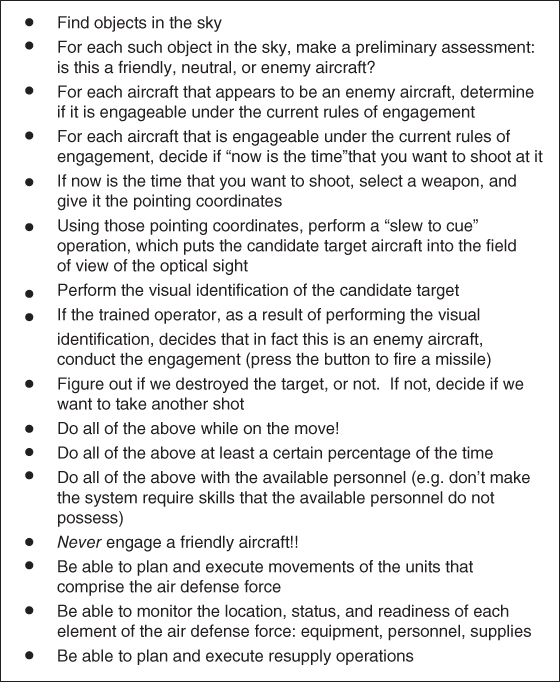
Figure 2.12 Key steps, functions, and attributes of accomplishing the short‐range air defense mission.
Unfortunately, no. Let us consider just the very first statement on that list: “Find objects in the sky.” Before we can declare that we have a viable requirement about finding objects in the sky, we have to consider items such as these:
- How small an object do we need to see?
- Are there limits on the speed of the object that we need to be able to see?
- Are there limits on the materials of which the object is made? Can we be satisfied with seeing airplanes made of metal; do we not have to see airplanes made of plastic?
- Do we have to provide 360° azimuthal coverage, or can we be satisfied with looking only in a particular direction?
- Do we need to look at all elevation angles, from the horizon to the zenith, or can we be satisfied with only looking at some lesser set of elevation angles? It might be expensive to build a sensor that can see all the way to the zenith, for example.
- How far out do we need to look (e.g. to what slant range?).
- Is it sufficient if we report only the slant range and azimuth of the objects we find in the sky? Or do we also need to report the elevation angle?
- In what coordinate system do we need to make our reports? In latitude and longitude? In some circular coordinate system centered on our sensor? In some circular coordinate system centered on a weapon?
- Is it sufficient to report the object just once? It is an airplane, and therefore will continue to move; how often do we need to send subsequent reports?
- How accurate do the measurements contained in our reports need to be? How is accuracy specified?
For each functional statement on your list (e.g. “Find objects in the sky”), we need first to figure out all of the detailed questions that the requirements must address, and then we must go and figure out all of the answers to those questions. We then phrase what we learned in a particular fashion: we use the verb “shall” to indicate that a sentence is a mandatory requirement; we use the verbs “is” or “are” to indicate that a sentence is a supplemental description, rather than a mandatory requirement; we place each statement with a “shall” in its own paragraph and with its own paragraph number. When we have done all of that, then we have the actual requirements.
Notice that some of the resulting requirements will contain numbers; these form the how well portion of the requirements.
Requirements are written down in documents called specifications. Therefore, a specification is a document used in acquisition/development, which clearly and accurately describes the essential technical requirements of an entity (system, subsystem, component, etc.).
On most projects, we will have a hierarchy of specifications; that is, we will have a specification that defines the requirements for the system as a whole, but we will also have subordinate specifications that describe in more detail the requirements for individual subsystems and components. On a typical large engineering project, this hierarchy of specifications is likely to be three or four layers deep, moving from (at the top of the hierarchy) defining the requirements for the system as a whole, to defining the requirements for smaller and smaller pieces (Figure 2.13). This hierarchy is usually called the specification tree. We break the requirements into these separate specifications because each subsystem and component is likely to be designed and built by a separate team, and it is convenient, and reduces errors, to have separate requirements specifications for each such team. By separating the subsystem and component requirements from the system‐level requirements, we also gain the benefit of being able to focus separately on the system‐level requirements, where so much of our desired emergent behavior will reside.
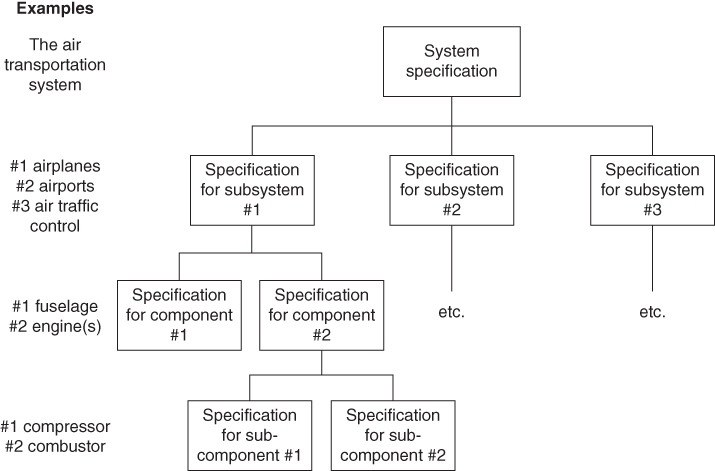
Figure 2.13 The specification tree.
Remember what we said about requirements: they define the what and the how well for our system, but not the how.
Specifications contain a little more than just the statement of the requirements; since it would be useless to write a requirement that is for some reason impossible to test, it has become customary to include in the specification an indication of the basic strategy by which each requirement will be tested. We return to this subject in the next chapter.
Specifications usually form a contractually binding commitment; that is, if the system you eventually deliver fails to implement some requirement, your company may be paid less for their services, or there may be some other form of penalty. We will therefore pay a lot of attention to making sure that our design is in fact implementing every single requirement in our specification tree.
How do we go about creating the requirements? Figure 2.14 defines the steps that I recommend. There are a few new terms in this figure, each of which are explained in the paragraphs that follow.
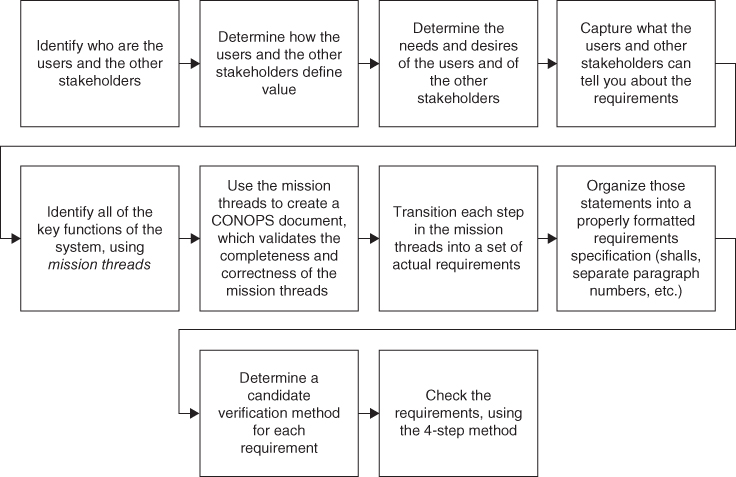
Figure 2.14 Creating the requirements.
We have already talked about some of these steps, but not all of them:
- Identify who are the users and the other stakeholders. We have already talked about this; we must know all of the users and the other stakeholders for our system. The buying customer is only one of those stakeholders, and it is likely that they are not users of the system at all. As we already discussed, there are likely many other stakeholders besides the users and the buyers.
- Determine how the users and the other stakeholders define value. We already talked about this one too; we must determine how the users and other stakeholders define value, in the context of our system. As noted above, we do this by reading, talking to people, listening, and watching the users perform the mission with their current tools and methods.
- Determine the needs and desires of the users and of the other stakeholders. Having determined how our users and stakeholders determine value, we are ready to determine what they need and want. This involves more reading, talking, listening, and watching. Many texts on requirements tell you only to consider documented needs, as you may not get paid for doing additional things (e.g. desires) that are not in your contract. I strongly disagree; the customers must end up being happy. This always involves figuring out what they want, in addition to what they need. You may well then try to get those items added to the contract (so that you can get paid for them), but you might elect to do some of them anyway, in the interest of establishing good relations and high credibility with the customer. When things go wrong (and things will go wrong at some point), you need the customer “on your side.”
- Capture what the users and other stakeholders can tell you about the requirements. Usually, the buying customer will have some written description of what they want to buy, and of course you start with that. But even if they do not, you must elicit that information from them.
- Identify all of the key functions of the system, using mission threads. Consider Figure 2.10; here, we tried to capture a list of all the major functions of our notional short‐range air defense system. How did we create that list? The method I advocate is to create mission threads, the major operational sequences of our user's mission. What are all of the external stimuli that cause our users to start some sort of a task? What is the sequence of steps (this sequence is what I call a mission thread) that they move through in order to accomplish each task? What are the results of each such sequence of steps? You can read Figure 2.10 and create a list of what were the likely mission threads that I had in mind when I created the figure.
- Use the mission threads to create a concept of operations (CONOPS) document, which not only describes the mission threads, the inputs, and the outputs, but also summarizes how often each mission thread is likely to be exercised during actual operations, identifies any timing constraints (e.g., a particular thread might have to be accomplished in fewer than 10 seconds), identifies other constraints (e.g. the requirement to perform the visual identification step) imposed by outside authorities, and so forth. You also write down what you have learned about why each of these items is done in this particular fashion. The CONOPS document allows you to validate the completeness and correctness of the mission threads.
- Transition each step in the mission threads into a set of actual requirements. Recall that we said items like those in Figure 2.10 do not constitute actual requirements. We discussed how we would turn just one statement from the figure (“find objects in the sky”) into actual requirements. Now, we must complete a similar process for every step along every one of our mission threads.
- Organize those statements into a properly formatted requirements specification. Over time, we have developed standardized formats, lexical conventions, and so forth for requirement specifications. These are often documented in government or company policy manuals, and include things such as the use of particular verbs for distinguishing actual mandatory requirements from explanatory materials (e.g. shall versus will), the use of a separate paragraph number for each individual requirement, and other conventions.
- Determine a candidate verification method for each requirement. Recall that earlier, I stated that in our requirements specification we also include a preliminary idea for how we will verify each requirement. It is possible to write requirements in a fashion that is difficult or impossible to verify, and we strive to avoid that (if for no other reason than we will not get paid until we have verified every single requirement!). In order to avoid such a situation, for each requirement we identify a candidate method (usually the candidate methods are inspection, analysis, demonstration, simulation, and assessment by operation) for verification, and include this verification method right in the specification.
- Check the requirements. We cannot consider something as important as a requirements specification complete until we have performed some type of check that it is complete and correct. I use a four‐step process that I learned from Jim Hines and Scott Jackson in 200910.
- Editorial check (format, grammar, spelling, punctuation, consistent use of terminology).
- Soundness check (no missing items or “to be determined,” quantitative values where required, positive statements [e.g. shall, rather than shall not], no statements of design [e.g. no statements of how, only statements of what and how well], no statements constraining external systems, validation of all assumptions).
- Substance check (complete, consistent, every requirement is necessary, appropriate level of constraints).
- Risk check (technical feasibility, consistent with budget and schedule, identify things that could go wrong, estimate likelihood and consequence of each, assess realism of available approaches to mitigate each risk should it actually occur).
Remember that we said requirements usually become a binding part of the contract. If you let the requirements say more than you intend, you may well have to foot the bill for building that extra capability!
Scott and Jim also have a cute acronym intended to remind us about the desired attributes of requirements, which I have modified slightly so that it now reads:
A requirement must be SMART
(Specific, Measureable, Achievable, Realistic, Testable)
These five attributes are essential, but there are other essential attributes of requirements too. For example, we have stated several times that the requirements are about what and how well, but not about how, because how is the design. The requirements should not unnecessarily constrain the design.
We also noted above that the requirements must be verifiable; and there are other important attributes of requirements too. But I have decided not to tamper with Jim and Scott's SMART acronym!
2.3 Design
2.3.1 The Design and its Process
The next phase in the development process of an engineering project is the design; we aspire to create a design that satisfies the requirements, but also one that is feasible and affordable to build.
We get a lot of “help” with the requirements; after all, our customers and our users understand well what they want the new system to do, and such what constitutes a major portion of the requirements. It is my experience that most systems eventually develop pretty good requirements, although it may take them longer to do so than they originally planned, and cost more money to do so than they planned.
But the design is a completely different matter; many systems simply have bad designs. Why might this be? For one thing, the customer and the users are generally not qualified to provide expert help with the design, in contrast to the way that they are qualified to provide expert help with the requirements.
How do I know that many systems actually have bad designs? More than once I have seen cases of two completed systems that do approximately the same thing, where one runs 100 times faster than the other. Similarly, I have seen cases of two completed systems that do approximately the same thing, where one is 1000 time more reliable than the other. I have then had the opportunity to examine these systems so as to find the root cause for the slower and less reliable performance, and therefore I can state with confidence that this gigantic gap in performance derived from specific (undesirable) features of their designs.
This finding has many interesting implications. First, having a 100× or 1000× range of outcomes for a critical parameter from an engineering project is shocking; mature disciplines do not have such large ranges of outcomes. Consider mid‐sized family sedans offered for sale that meet US emissions control requirements; the variation from best to worst in, for example, gas mileage is no more than 25%, not 100× (10 000%) or 1000× (100 000%). Something is going radically wrong inside the designs of the systems that exhibit such poor performance on such an important metric.
Second, a lot of engineering projects turn out to be problematic, in the sense that they end up far over budget, far behind their delivery schedule, and a shocking number (some studies say more than half of all engineering projects) are canceled before they complete, because of customer and user dissatisfaction with progress. The people who study these problem projects nearly all assign the blame to poor requirements. But I spent many years of my career as a designated fix‐it person for engineering projects that were in trouble, and I will tell you that they all had pretty good requirements. What they all lacked was a sensible, feasible design.
So, in light of the above, I have come to view the design as the critical portion of the engineering project development cycle. It is the stage that will likely make or break your project.
What is a design? In the previous section, we defined the requirements as the statements that tell us what the system is supposed to do, and how well it is supposed to do it; in contrast, the design tells us how the requirements are going to be accomplished. Consider a house: the requirements might tell us that the house needs to have four bedrooms and three bathrooms. The design tells us how we will satisfy those requirements: whether we will use wood or metal for the frame, whether we will use a raised structure or a concrete slab for the foundation, whether we will use casement or sliding windows, whether we will use wooden shakes or concrete tiles for the roofing materials, and so forth. We can build a house that meets the requirements – four bedrooms and three bathrooms – using either wood or metal as the framing material; both probably allow us to satisfy the requirements. But there may be other reasons for choosing one design approach or the other, reasons that have little to do with the requirements (e.g. “four bedrooms”). For example, if our house is going to be in a location with a really severe termite problem, we might not want to select wood for the framing material. But if wood is satisfactory, then using wood is probably a lot less expensive than using metal for the frame. A wood‐framed house can probably be built in less time than a metal‐framed one too. These are examples of alternative designs.
The process that we use to create a design centers around a method that we call the trade study. The trade study process helps us create a set of candidate alternative designs, helps us create a way to measure the “goodness” of each alternative, and finally allows us to select a preferred alternative, while also creating the data and the artifacts that will allow us to explain to our peers and stakeholders why we believe that it is the best possible alternative.
In the design process, there will seldom be a clear winner, in the sense that a particular alternative design is best in every category. That is why we call the process a trade; we make judgments (backed up by data and analyses) about which combination of positive and negative features achieves the best overall solution for our system. We strive not for perfection, but for a reasonable balance.
In this book, we are considering engineering projects, and therefore technology and technological concepts are central to the success of those projects. We therefore use engineering methods to guide project management decisions, and that in turn implies that we use data to help make decisions. The data that we use to measure the “goodness” of our candidate designs takes the form of two types of metrics: one that I call operational performance measures (OPMs), and one that I call technical performance measures (TPMs).
Why two types of metrics? Our degrees of freedom in creating alternative designs lie mostly in alternative technical concepts and approaches, and these are best measured using the technical performance measures. But we must also make sure that improved technical performance actually results in improved operational performance, as measured from the coordinate system of value relevant to the users, customers, and other stakeholders. We therefore also need to use the operational performance measures.
At first blush, one might believe that improved technical performance always leads to improved operational performance. That is simply not true. Remember the example a few pages back about the radio vendor who offered me a radio that sent and received data twice as fast as his current radio model? When we plugged twice the data rate into our system‐level model, the operational performance measures did not improve at all! This, then, is a real‐life example where dramatic improvement in a key technical performance measure did not result in any improvement in an operational performance measure.
In my experience, this is in fact a frequent occurrence; as a result, we must separately measure both technical performance measures and operational performance measures. We cannot abandon technical performance measures, as they are at the heart of our technical analyses that allow us to determine whether or not our design will in fact work. But we must somehow relate the effect of the technical performance measures to the operational performance measures. In the radio example cited above, we did that through a system‐level model. In other instances, we have done this through actual benchmark measurements. But however you choose to do it, it must be done.
Furthermore we must convince our stakeholders – most of whom are not engineers – that our predictions about operational performance measures are credible. So, we must be able to explain the connection between the technical performance measures and the operational performance measures in a credible and transparent fashion, even to our non‐technical stakeholders. This might be done by explaining the logic in the system‐level model, and then showing that we have calibrated that model by using it to predict the performance for a set of situations for which we can go out and make actual real‐world measurements. If the stakeholders understand and agree with the logic inside our system‐level model, and see that in a set of real‐world circumstances the system‐level model makes accurate predictions, then they may accept that when we use the model to make predictions about circumstances for which we cannot yet make measurements (e.g. how the new system will perform), the predictions may be believed.
I use the method depicted in Figure 2.15 in order to create a design. This figure introduces a few new terms, which will be described in the following text.
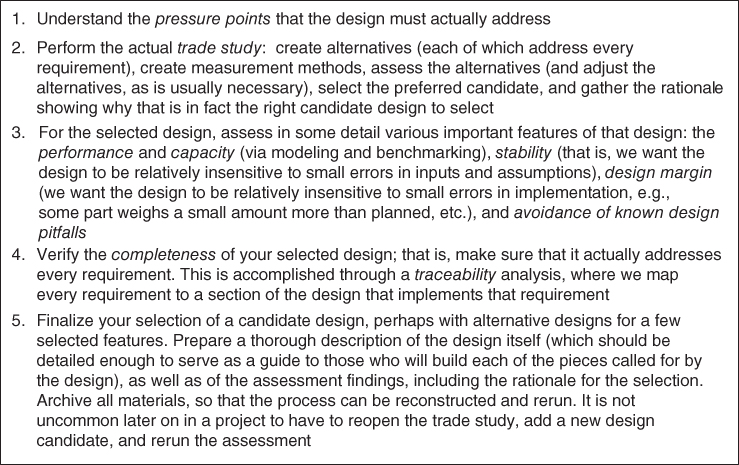
Figure 2.15 Steps to create a design.
Let's discuss each of these.
By a pressure point that the design must actually address, I mean that we must use our operational knowledge of the users and the mission to determine what are the real design drivers for the system. Do not depend on your customers to do this for you! They are not engineers and designers, and while they understand their mission well, they often have an imperfect understanding of how technology interacts with their mission.
Think of the short‐range air defense system that I described earlier. If the Army were to notice that only about one‐third of the missiles they fire at airplanes in the sky actually hit the target airplane, they might well conclude that they need a better missile. While this may sound reasonable, that conclusion may be completely incorrect! When I was actually designing such a system many years ago, we discovered that the Army gunners were actually taking very few shots; they were shooting at a target only about 10% of the time that they could have. Most of the time, the very short nature of the shot opportunity (a high‐speed jet flying very close to the ground passes you by in just a few seconds) meant that they were not even shooting 90% of the time. Instead of building a better missile, we decided that the pressure point in the design was to help the gunner get ready, and to cue him when a shot opportunity was coming up soon, so that he would not miss so many shot opportunities. A few years later, after we had finished an automated system designed to help gunners achieve more shot opportunities, not only were they taking nearly 10 times as many shots per day, but most of those shots were hitting the target airplane. It turned out that by using automation in the system to help the gunner find and take his shot opportunities, we were not only creating more shot opportunities, but also creating better shot opportunities, ones where the target airplane was closer, or otherwise situated so as to make it easier for the missile actually to hit the target airplane. They didn't need a better missile at all!
Think about that: not only did we create a revolutionary improvement in the performance of the system (almost a 10× improvement!), but we did it without making any changes at all to the item that the customers and users initially might have thought was the problem. We had to discover what was the real pressure point in the design. In this case, that pressure point was improving the number of shot opportunities that complied with the rules of engagement (and also improving the quality of those shot opportunities), rather than improving the probability of kill once a missile was launched. This was despite the fact that the major observable of poor performance was that most of the time, the missile missed the intended target – which made it seem like the problem was with the missile itself.
In my experience, this sort of focusing on the wrong aspect of the problem takes place quite frequently. Therefore, my design methodology always starts with the assessment and analysis needed to determine where the actual pressure point is in the design of our new system. There may well be more than one, of course.
Once we know the pressure points, we can turn to the trade study. I use the following steps to perform a trade study (Figure 2.16):
- Use the knowledge and insight we acquired about the customer in order to create operational performance measures, and then discuss those with the customer. Of course, we actually started this process while we were creating the requirements.
- Use the operational sequences to firm up a list of all the independent stimuli that can activate a mission thread in your system, and also define what is produced as the output of each mission thread. We started this when we prepared the concept of operations document as part of the requirements, but now we need to do it in more detail.
- Use these items – the lists of stimuli and the partitioning of steps that could be in parallel and steps that must be in sequence – to define all of the independently schedulable entities within your system. These are the system activities that can be started in response any sort of asynchronous stimuli, and can therefore operate at the same time as other system activities.
- Use the knowledge and insight we acquired about the mission, together with the requirements, to create operational sequences that describe how they perform this mission, the mission threads. This is a mechanism that helps you to ensure that every requirement is addressed by the design. We started this while we were creating the requirements too. Now we have to do it at a finer level of detail, showing which steps on the mission threads can be performed in parallel, and which must be performed sequentially.
- Use the list of mission threads and the list of independently schedulable entities to create alternative groupings of those entities into actual implementation groupings (e.g. the items that will actually comprise the separately buildable elements of the system).
- For every alternative implementation grouping, postulate a set of candidate implementation methods (e.g. software, digital hardware, analog hardware, electromechanical, and so forth). Perhaps there will be more than one for some of these categories (e.g. several software‐based approaches, each using a different algorithmic method). These form the set of candidate designs; we call this set of candidate designs the trade space. The candidates that you select for the trade space ought to be informed, of course, by your previous selection of a set of pressure points that the design needs to consider.
- Perform an assessment of the technical feasibility of each candidate design and eliminate from further consideration those that are deemed not feasible, or too risky.
- Using the technical performance measures and the operational performance measures, create a methodology for assessing the “goodness” of each candidate design, by which I mean how well this design balances the two key goals of the design process: (i) satisfying all of the requirements, while also (ii) being technically feasible, and at the same time also satisfying any other goals that may apply to this specific project (such as unusually high levels of reliability, if our system is safety‐critical, and so forth). What will you measure? How will you measure it? How do you ensure validity of the measurements and the predictions that you make from those measurements? What are the desired values for each measure? What are the minimum acceptable values for each measure? How do you combine and process the measurements into an overall assessment of “goodness” for a candidate design? What are the relative weightings you will give to each measurement as a part of that overall assessment? I provide a list and description of common assessment methods in Figure 2.17.
- Use that measurement and assessment methodology in order to perform the actual assessment of the goodness of each candidate design. This will probably be done multiple times, eliminating a few of the worst‐performing candidates each time, adding additional measures for the remaining candidates, perhaps using the insight from the measurements in order to create new candidates. Keep careful records documenting the rationale behind all decisions, even for those candidates that are discarded.
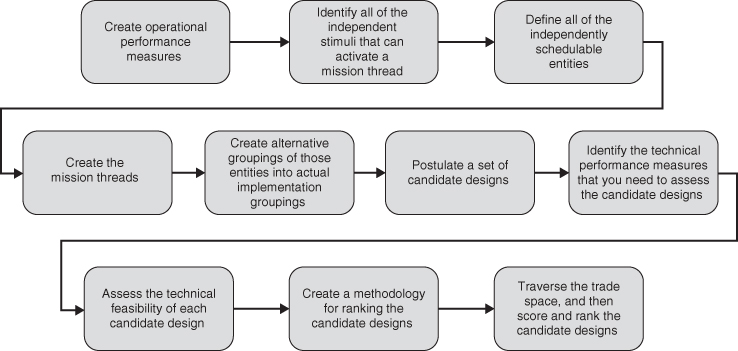
Figure 2.16 The trade study.
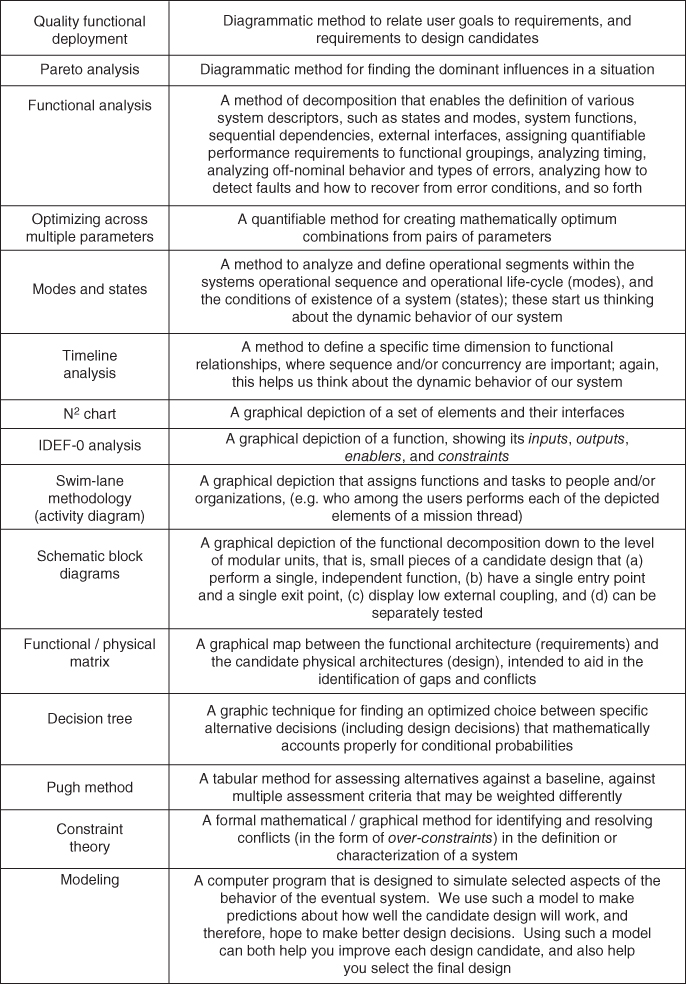
Figure 2.17 A list of candidate analysis methods for assessing the goodness of your design.
Since we will be assessing several candidates during the trade study, the depth of each assessment is necessarily limited. Once we reach the point, however, where we believe that we have our single selected design (perhaps with alternatives for a small number of selected points within that design), we can afford to assess that final candidate in more depth. This involves assessing the final candidate design in several ways:
- The performance and capacity of the design. Many systems fail because they fall significantly short of promised performance rate and/or capacity, so we try to avoid that risk by a careful assessment against those dimensions of our candidate design. This assessment will be done using some combination of modeling and actual benchmarking.
- The stability of the design. We want the design to be relatively insensitive to small errors in inputs and assumptions, so we assess our design by subjecting our system model to such variations in inputs, initial conditions, operating conditions, and so forth, and check to see that small variations in these factors lead only to small variations in the performance of our system, rather than to catastrophic degradations in our system. See Figure 2.18.
- Design margin. We want the design to be relatively insensitive to small errors in implementation too. For example, if some part ends up weighing a small amount more than planned, we want the impact on our system to be small (e.g. a tiny decrease in fuel economy, etc.) rather than catastrophic (e.g. our satellite fails to reach the intended orbit). It is a major portion of our role as designers to provide design margin; this will enable the system to work, even if a few things don't work as well as planned. A classic example is managing the weight of a spacecraft; there is a hard limit for how much weight the launch vehicle can take to the designated orbit. It you allocate all of that weight, and something shows up late a few pounds over, you are in big trouble. So, instead you should keep some design margin (in this case, unallocated weight) in your “back pocket.” As you get closer to delivery, you can allocate from your design margin to solve problems. This is analogous to the way the program manager allocates from her/his management reserve of funding (which we will discuss in a later chapter). But, at the same time, you cannot keep an unreasonable amount of design margin; it costs too much, and detracts from operational performance.
- Avoidance of known design pitfalls. I have seen a lot of system designs. Those that fail often share a small number of characteristics. So, I advocate checking that your candidate design avoids those known design pitfalls. See Figure 2.19.
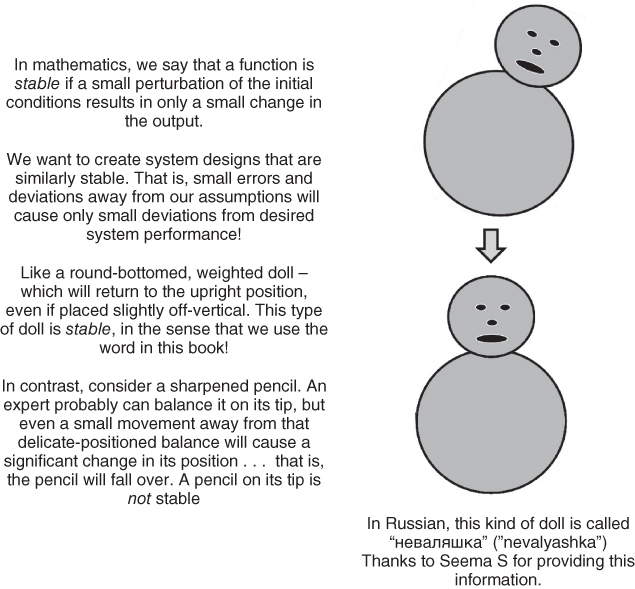
Figure 2.18 Stability in the design.
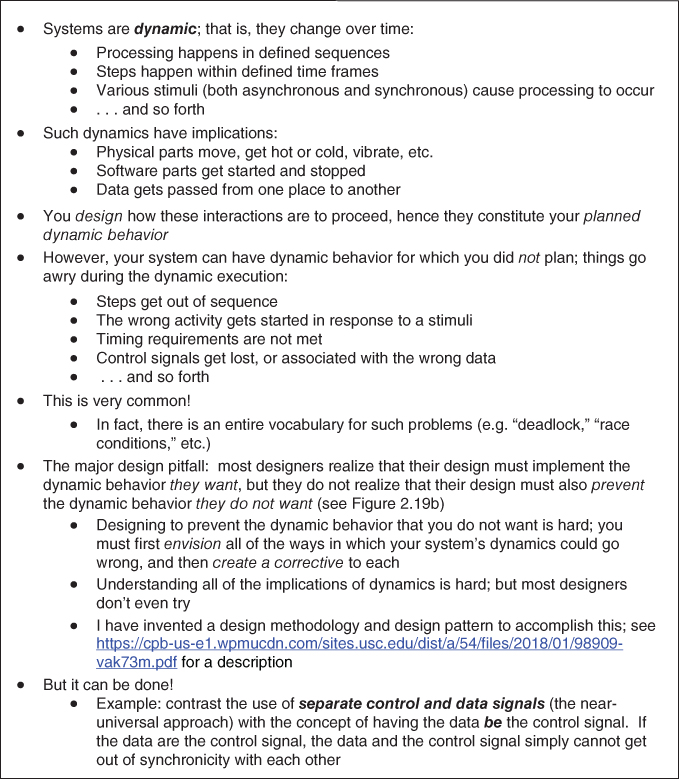
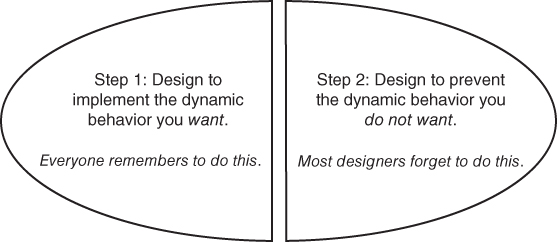
Figure 2.19 (a) Avoidance of known technical pitfalls in a system design. (b). Designing for the two types of dynamic behavior.
Of course, we may learn something from this assessment that causes us to adjust the design, or even to have to return to the trade study, create additional candidates, and reassess.
Once you have created a candidate design that appears to satisfy the requirements and meets your measures of goodness, then we need to do a more thorough analysis to show that this candidate actually meets all of the requirements. You inserted the functional requirements – the statements about what – into the mission threads, and used the mission threads to help create design candidates, so there is a reasonable chance that they are all addressed by the design. But we need to verify that. We do this by a traceability analysis, where we map every requirement to a section of the design that implements that requirement.
Furthermore, there are many other requirements: all of the how well requirements, which deal with reliability, capacity, timing, availability, and many other quantifiable matters. These are not usually addressed by a single step on a mission thread, but instead by a more subtle amalgam of elements within the design. Proving that they are addressed by the design is part of the traceability analysis too, but often the verification of the incorporation of the how well requirements must be verified through use of our system model and its predictions about the operational and technical performance measures.
2.3.2 The Design Hierarchy is Not the Same as the Requirements Hierarchy
A common mistake is to assume that the groupings created to organize the requirements – the functional groupings – are appropriate for organizing the design. My experience is that people who try to do this end up with bad designs. For the requirements, it is best to group things together that are functionally related, but we must group things differently for the design: when we design, it is best to group things together that support the implications of the steps that must be executed in sequence, and the freedom and performance improvement opportunities implied by steps that could be executed in parallel.
2.3.3 Modeling
Modeling appeared on the list in Figure 2.17, and in several other places I have made reference to the idea of a system‐level model that we use for making predictions about the behavior of our eventual system. Let me say a bit more now about modeling.
Modeling of some sort is used in most large system development efforts. These days, such modeling usually takes the form of a computer program that is designed to simulate selected aspects of the behavior of the eventual system. We use such a model to make predictions about how well the candidate design will work, and therefore hope to make better design decisions. Using such a model can both help you improve each design candidate, and also help you select the final design.
A typical computer‐based simulation model will simulate the components of a system, their actions and interactions, and the external interfaces (which provide stimuli to the system).
It is easy to code up a model; the first big issue is the credibility of the model. Why should anyone believe that the predictions from the model are reasonably accurate? Just because the computer says so is not good enough; computer models can at times make predictions which are wildly inaccurate. We use techniques such as the following to prove the validity and credibility of a model's predictions:
- Analytic validation. We check that the algorithms are coded correctly within the model.
- Calibration against benchmarks. We use the model to make predictions about things for which we already have actual measurements of a real system; we then believe that we can rely on the predictions of the model for additional situations.
- Assessment of the accuracy and risks of extrapolation beyond the benchmark data. Obviously, using the model to make predictions for situations where we do not have actual measurements is one of the primary purposes of employing a model. But such extrapolation necessarily entails some uncertainty; if you were doing an experiment where you were measuring the viscosity of water as you cooled it, and you made measurements at 60, 50, and 40 °F, you would conclude that cooling the water did not change the viscosity very much. You might therefore be tempted to extrapolate, and make a prediction about what would happen if you cooled the water to 30 °F.11 Since such extrapolation is a major purpose of our models, we must make explicit efforts to look for the non‐linearities, phase changes (such as the fact that water will freeze if cooled to 32 °F!), turbulence, queuing, and other major disruptions that would limit the range of validity of such extrapolations.
There is another big issue with models: How accurate is the model? We use the term fidelity: How faithful to the real world are the predictions of the model? Nor do we always need 10 decimal places of accuracy: How accurate is good enough for my purposes?
We start with the question of determining the necessary fidelity with an error budget analysis of the system. What is an error budget analysis?
Recall the air defense system that we described earlier in this chapter. We said that the gunner could not shoot a missile at an airplane until after a trained operator had conducted a visual identification of the target through an appropriate magnifying optic. The airplane, of course, is constantly moving. The vehicle with the missiles and the trained operator is moving, too. In order to get the magnifying optic on that vehicle to point at the correct airplane, there are a series of steps that must be completed, all within some degree of accuracy; if we do not achieve at least that accuracy, the optic may be pointing in the wrong direction. To achieve the necessary degree of overall accuracy, we must specify the degree of accuracy for each step along the processing chain, and then combine all of those individual errors correctly to arrive at an estimate for the overall accuracy. That is an error budget analysis; it tells you how accurate each component of your system needs to be in order for the system to meet its performance requirements (how well). Obviously, then, our model needs to be slightly more accurate than the actual system will be (there are ways of calculating exactly how much more accurate the model needs to be), in order to make useful predictions about our system.
One can then verify the achievement of that accuracy (at least for some scenarios and ranges of data) through benchmarking (that is, making measurements under controlled circumstances, such as in a laboratory, or under constrained field conditions). Furthermore, as you build the actual system, you can continuously re‐benchmark the model against the emerging actual system over a larger and larger range of scenarios and data.
Models are often nested or chained. An example of such nesting might be:
- A physics model of radio‐frequency propagation, which feeds …
- A model of an antenna, which feeds …
- A model of the antenna mast height, which feeds …
- A model of the received signal quality, which feeds …
- A model of successful packet completion rate, which feeds …
- A model of message completion delay (average and variance), which feeds …
- A model of end‐to‐end completion time and accuracy for a specific capability, which feeds …
- A measure of some system operational performance measure!
There are, however, many different ways to interconnect these models. Sometimes, they are all put together into a model‐of‐models, with fully automated interactions between each model. Other times, they are run separately, but the outputs from one are automatically fed into the next model in the chain (these are usually called federated models). Other times, the models are completely disjoint, and the outputs from one are manually transferred into the next model in the chain.
It is my experience that it is important that each model be maintained and operated by its actual creator; that creator is the expert who knows the limits of credibility for their own model better than anyone else, and having them maintain and operate that model, in turn, contributes to achieving better and more credible predictions. This motivates me usually to prefer the use of separate models with manual transfer of data! That sounds old‐fashioned, but better accuracy and credibility in my view is more valuable than automated interconnection.
We use the models to analyze our system and its candidate designs; that is, to determine how well each of our candidate designs performs. Since we are concerned with whether it meets the needs of the users, the model must finally reach the level of being able to make predictions about the operational performance measures, not just about the technical performance measures. This is a common failing of system models; many are designed only to make technical predictions.
2.3.4 Design Patterns
In the building construction business, there is something called the “building code,” which actually defines how certain portions of the design for a building must be accomplished. This lowers risk, in that these model design segments can be created by experts, and reused by average designers. This is an example of what I call a design pattern: a vignette for a small portion of a design that has been codified by some authority as working well, under the appropriate conditions.
The last bit about appropriate conditions is important; a bit of building design that is great for a single‐story private residence might be a disaster for a 30‐story office building (and vice versa).
We too can make use of design patterns in designing our engineered systems. There are plenty of such design patterns for us to consider: things like EtherNet, TCP/IP (the network transport standard for the Internet), various standards for electronic circuit cards so that they can plug into a standardized backplane, and both the client‐server and HADOOP data storage architectures; these are all examples of such design patterns.
In the context of the engineered systems that we are considering herein, things can be much more subtle than when the local city building and safety department tells you that you must have studs every 18" in the subfloor for the new room in your house (which is, of course, another example of a design pattern). The problem lies not in being unable to understand client‐server or HADOOP; rather, the problem lies in understanding when each is appropriate or inappropriate for our particular system. The range of design variation in buildings is far smaller than the range of design variation in engineered systems. This is in part due to the intrinsic complexity of today's engineered systems; something with 100 000 000 lines of software code is far more complex than an office building. But remember the examples cited above about staggering levels of variation in quality between apparently similar engineered systems; I cited ranges of 100× in speed and 1000× in reliability. A major cause of this variation is poor matching of design patterns to the specific nature of the system being designed (e.g. using client‐server when that is just a poor choice for the nature of the system).
Good system design organizations keep libraries of past system developments (successful or otherwise), and you can peruse those in order to gain insight about which engineering design patterns are likely to be effective for your system.
I wish I had a better answer for selecting design patterns; we need to use design patterns in our systems (our customers will expect it), but if we choose patterns that are inappropriate for our particular system, we are likely to end up being the next example of a system failure. I advocate careful benchmarking and modeling of your design patterns in the context of your system before finalizing selection. There is, in my experience, too much reliance on the idea that “this is a standard approach, so it ought to work for our system, too” without understanding whether or not such use is appropriate to the specific nature of your system.
2.3.5 Do the Hard Parts First
There is a temptation to start design (and implementation too) with the easy, low‐risk parts of the system. For example, there may be portions of a system that are reused from previous systems with only minor adaptations. Another favorite for early design activity is the user interface software.
These are among the easier aspects of the design, and some people like to start with them so that the team can make a lot of quick progress. This might be thought to help the team learn to work together, and to establish credibility with the customer.
While one can in fact make quick progress by concentrating at the beginning of the design (and implementation) phase on the easy parts, there are, in my experience, far better reasons to start the design and development phases with the hardest and/or highest‐risk portions of the system. If nothing else, this approach provides you with more time to work on these harder/higher‐risk portions, and it is often the case that having more time is a pretty effective element of a risk‐mitigation strategy. Beware of those who would have you concentrate first on the “low‐hanging fruit”!
2.3.6 Designs and Your Team
A former radio personality12 used to make his audience laugh by saying “… and all of the children are above average.” We laughed because we knew it could not be true – very few children can actually be materially above average. We also laugh because people recognize that they do tend to believe that too often about their own children.
There is actually a very important insight in this idea. You might be able to select the staff for a three‐person project so that everyone is above average. You cannot, however, realistically do that for a 30‐person project, nor for a 300‐person project. Most people on such larger projects will be … about average.
At the same time, it is often the case that a design requires that a small segment of very difficult and error‐prone work is spread across the tasks that many different people have to do. This was true, for example, in early implementations of cyber‐security techniques; every programmer had to implement a relatively small amount of very complex and highly error‐prone software code. Not surprisingly, the result was a lot of design and coding mistakes, causing very poor cyber‐security characteristics in the resulting system. If most of the designers and programmers on your project are average, you cannot expect them all to perform properly on very difficult tasks.
There is, however, a better alternative. It is possible to use the design process to isolate certain types of difficult and error‐prone tasks into a small segment of the implementation.13 You can then assign this isolated bit of work to a small set of experts. The overall difficulty of the entire project remains the same, but you have partitioned the design into (a small set of) difficult parts and (a large set of) less difficult parts. This matches the distribution of the difficulty of the work to the distribution of skills on your team: you have a small amount of difficult work, which is isolated into a small segment of the design and implementation, and you can therefore assign this difficult work to your small number of expert practitioners. You have a large amount of work of average difficulty, which you can assign to the remainder of the team. I have found that this approach significantly improves the outcome on real projects. This is a new and, I think, important design objective: matching the distribution of the difficulty of the work to the distribution of skills on your team.
A second example of how to use this technique involves the management of the system's dynamic behavior; I have found that this is a highly complex and error‐prone task, and one that has a significant impact on the overall success of the project. Remember what I stated above: most designers remember to design to implement the dynamic behavior they desire, but do not do nearly enough to prevent other (unplanned and undesirable) dynamic behavior. This is all very difficult work, especially the latter portion.
On many projects, responsibility for designing and implementing such controls is (perhaps inadvertently) spread out to every software package; because this is difficult work that ends up being performed by almost every member of the software team (most of whom are, after all, average in skills), this leads to poor technical performance, low system reliability, and lots of schedule and cost over‐runs. This was in fact the most common design flaw that I saw in all of those systems for which I was tasked to act as the fix‐it person.
To address this problem, I adapted technical concepts invented by some of my colleagues14 into a management and design methodology for isolating this complexity into a small segment of the design and software implementation, which allowed me to assign this difficult, error‐prone, but highly significant work to a small team of experts.
Good project managers have always tried to match people to assignments, but this quest was often confounded by the phenomena noted above: really difficult and risky tasks can creep into every single part of the system. Using the design process to avoid this problem by the sort of partitioning described above gives the project manager a new and powerful tool to improve the probability of a good outcome for their project. The design stage of your project is where you can do this.
2.3.7 Summary: Design
As I stated at the beginning of this chapter, in my experience, design is the make‐or‐break activity for most engineered systems. As you can tell from what we have discussed in this chapter, there are a lot of established practices that can get you going, but there is a lot that depends on judgment (which comes from experience) and art.
Design is also one of the most fun aspects of systems engineering. Learning to do it well will distinguish you from your colleagues.
In Figure 2.20 I summarize some of the key points we have discussed about the design activity in a format called IDEF‐0.
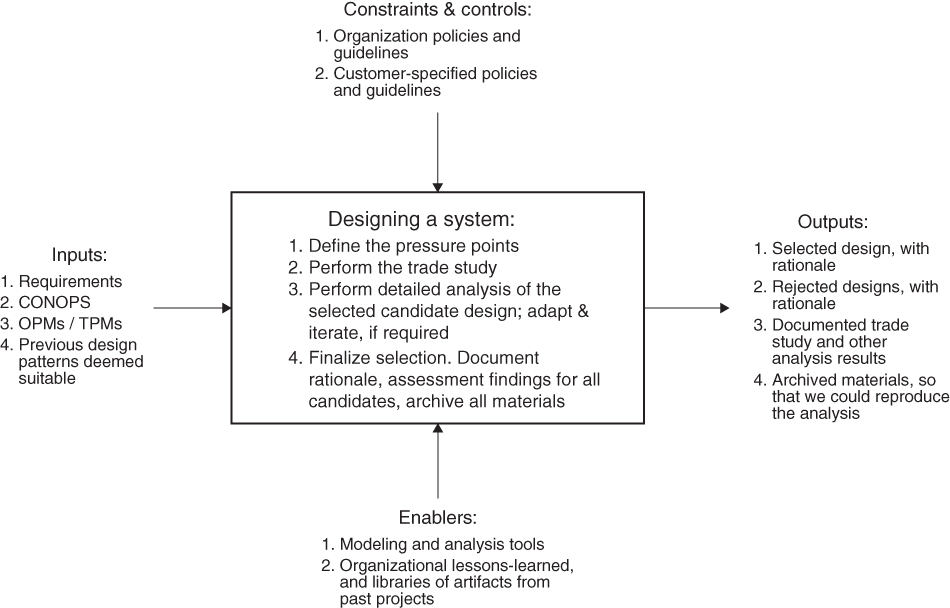
Figure 2.20 IDEF‐0 representation of the design process.
2.4 Interaction of the Requirements and Design Processes with Project Management Processes
As I stated in the introduction, one of the important characteristics of my approach to engineering project management is my emphasis on the uniqueness of engineering projects (as distinguished from other types of projects) and the resulting need to have the actual engineering activities influence the way we perform the project management activities. Figure 2.21 illustrates this.
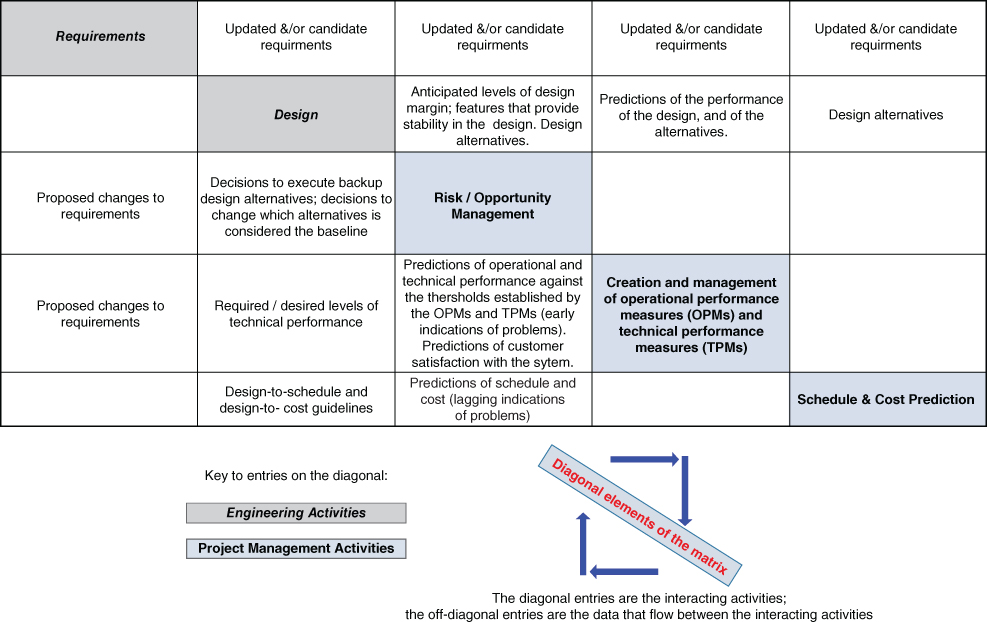
Figure 2.21 An example of how we tie engineering activities to project management activities.
This figure is in a format called an N2 chart. The N2 chart format was invented by Robert Lano.15 The diagonal entries (in the shaded boxes) are a set of interacting activities; the purpose of the chart is to examine and depict the interactions among these activities. In this N2 chart, there are five interacting activities, two engineering life‐cycle activities (requirements and design), and three project management activities (risk/opportunity management, creation and management of operational performance measures and technical performance measures, and schedule & cost prediction). As shown by the off‐diagonal elements (which show the data flowing between the interacting activities on the diagonal), there are extensive interactions between the two engineering activities and the three project management activities. In fact, as we will discuss in later chapters, we actually change the nature of these three (and other) project management activities due to the fact that this is an engineering project. For example, the analysis that we perform in those project management activities is adapted to the specific nature of this particular design. There are other ways too in which the project management processes are changed because this is an engineering project. We will return to this subject in more detail in later chapters.
2.5 Your Role in All of This
As the manager of an engineering project, you are not the chief designer; you have someone working for you who has that responsibility, and it is important that you allow them authority to match their responsibility. But, because the design is so important to the success of the project, driving the team to a good design is one of your most important tasks. Your role includes emphasizing the importance of creating a good design, ensuring that the metrics (operation and technical) created are suitable (and accepted/liked by the customers), visibly participate in the process as a way of continuously indicating its importance, motivate the right behaviors by the participants, and push for a thorough trade study guided by suitable metrics and performed with suitable rigor. Of course, the design also needs a good set of requirements, and you must do many of the same things in order to ensure the creation of a good set of requirements. But the design is where my experience suggests that projects succeed or fail. Allocate your time and emphasis accordingly.
I have come to see engineering activities as tending to fall into one or the other of two categories: routine tasks and those that are not routine tasks.
The routine tasks are those that require real work in order to be completed, but no original technical breakthroughs are needed. For example, perhaps our system has a computer screen that the users view. Various information needs to be displayed to those users on that screen. You decide to do this through a series of forms. The forms need to be designed and coded. No dramatic technical breakthroughs need to be made, but there is work that needs to be done. It might even be possible to plan and estimate this work. For example, if there are 100 such forms to be created, and similar forms have been created for previous projects, you might have data that says it takes about four hours of work for a single person to design, code, and unit test each form. Since there are 100 of them, you can estimate that creating the entire set will take around 400 hours, and since you have two people to do the work, the entire task will take about five weeks of calendar time. This is genuine and value‐added work – it truly contributes to the completion of the customer's mission – but it does not require the creation of new concepts, new approaches, new insights, or new techniques.
The second type of engineering activity is those that are not routine tasks; these are characterized by the fact that something has to be invented or created. Or the solution requires an insight or breakthrough of organization or structure, rather than routine application of known techniques. Here's a trivial but real example. It used to be the case that a person could type too fast on their computer's keyboard, and an occasional character would “drop”; that is, would not appear on the screen or in the document that you were typing. Even in the days of slower computers, this was not a problem caused by slow computers, nor was it solved by the advent of faster computers. Instead, it was solved by the realization that typing is an asynchronous activity; that is, each key‐press comes at a fairly random time. The sequential set of keystrokes made by a competent typist may seem like a fairly even stream of key‐presses to a human, but to computers that (even in the bad old days) operated in terms of milliseconds and microseconds, the keystroke‐to‐keystroke spacing has a significant random element. That is, there is a level of uncertainty about when the keystroke will arrive. What solved the problem was not faster computers, but instead the realization that whereas the computer operates internally on a completely synchronous basis – it essentially does exactly one operation per time period (in a modern computer, that time period is far less than a microsecond) – the typing of keystrokes is inherently an asynchronous operation; that is, the keystrokes are not evenly spaced in time, but instead the interval between keystrokes has a significant random element. What solved the problem was the realization that there was a conceptual difference to be bridged between the human's asynchronous action of typing and the computer's internal operational methodology of exactly even, synchronous processing. The solution would be described by a computer architect by saying that we realized that we needed the external facing interface to operate on an asynchronous basis, and then to queue up the received keystrokes into a storage area where they could be processed by the computer's synchronous internal structure. In technical jargon, we would say that the external interface was changed from a polling architecture to an interrupt‐driven architecture.
This example is in some sense a “small” discovery but was real enough at the time. The point is that a conceptual breakthrough was required to create a true solution.
My experience is that the creation of this type of solution – an insight, the creation of a solution by reconsidering the structure and nature of the problem, an actual new discovery (or, more likely, the creation of a way to adapt someone else's discovery to solve a new problem) – is not schedulable in the same way that the creation of those 100 computer‐screen forms is schedulable. You cannot predict when the discovery will be made, nor can you estimate how much time and labor it will take to make it.
These problems, in my experience, are solved by a method other than scheduling and estimation. One solves these problems by getting a set of people to spend time thinking about the problems and doing tinkering/experimentation; in some real sense, the more people are thinking about it, and the better they understand the problem statement and its constraints, the more likely it is that one of them will create a solution.
As a project manager what you do, therefore, is achieve that alignment that we discussed in Chapter 1 (and that we will discuss in more detail in Chapter 13); this alignment creates an environment where (i) many people are aware of the non‐routine problems that must be solved in order to build your system, (ii) many people understand that you believe that spending time thinking about these problems is a legitimate portion of their job, and (iii) these same people understand that the project has provided tools, data, and other helpful infrastructure that can help them refine their thinking, and conduct their tinkering/experimentation.
Alignment can include – should include – the identification of the problems that need to be solved. The risk register (Chapter 9) does some of this for your project. When I was vice‐president and chief technology officer of a large organization, I used to publish annually what I called an unsolved problems list,16 that is, a list and description of what I considered to be the principal unsolved problems of the customers and the markets that we wished to address. This motivated a lot of thinking by a lot of engineers about those problems. Not surprisingly, this led to an occasional breakthrough. It itself also contributed to alignment, by providing a topic for hallway and lunch‐time conversations! And it provided me a clear and understandable way to connect our company's system of rewards to clearly articulated organizational goals. All good stuff; as the manager of an engineering project, you should do the same sort of thing.
The result is not that these problems get solved on a schedule; the result is that lots of smart and/or motivated people (the alignment of the team helps to make them motivated, for example, by allowing them psychologically to participate in, and contribute to, the socially valuable mission of your customers) spend many of their waking hours thinking about your problems. And at some point, solutions are created. But not on a create‐a‐form‐every‐four‐hours sort of basis.
The project manager has many ways to contribute to this process:
- The project manager creates the alignment that allows the people on your team to be motivated, usually through believing that they have the opportunity to participate in the socially valuable mission of your customers, and providing them the shared vision of an approach, a sequence, and so forth.
- The project manager makes sure that the problems are identified. Do not worry too much that you may not have identified the problems correctly; having lots of motivated people thinking about your list will result in the list being constantly improved. All you have to do is create an initial version, and then listen.
- The project manager creates the supportive environment, the psychological mindset that allows people to spend time at work thinking about the unsolved problems, and the tools, data, and other infrastructure that will help those people actually move from thoughts to experiments.
- The project manager also creates the culture that makes it safe for people to step forward with their ideas.
- The project manager creates a reward system. This should include financial rewards for especially good and/or important work. It must also go beyond money, and provide institutionalize thanks, recognition, pats‐on‐the‐back, and so forth.
My experience is that engineers like to create and to tinker. To some reasonable degree, you should encourage them to do so. I am told that Google does this by allowing some portion of its staff to devote some portion of their time to work on anything they want. To me, this approach seems needlessly pedantic; if your people are aligned and made aware of the key problems that need solving, and if you have also created the culture and environment that makes problem‐solving safe and rewarded, my experience is that many people on your team will spend not just some allocated time slot thinking about your problem, but many of their waking hours! And having a large body of motivated people thinking about your key unsolved problems seems to me to be the best way to get those problems solved, even if it will not be done according to a schedule.
You should be thinking about these things yourself too. Play out scenarios in your head. Hold practice conversations with customers in your head. Brainstorm with yourself about potential additions to the unsolved problems list, and potential methods toward a solution. Chat with your chief engineer and other senior technical staff (you can invite them to lunch once a month), and pass your thoughts on to them. It is no longer your personal responsibility to design the system, but you can create ideas, and pass them on to those whose job it is to create the design.
I have spent a lot of time in this chapter warning you about the problems to your system and to your project that unplanned dynamic behavior might cause. Please also realize, however, that some unplanned dynamic behavior might be good. If you find an example of such positive unplanned dynamic behavior, cultivate it. We will provide you with some specific methods to accomplish this cultivation in Chapter 9 when we talk about opportunities, the mirror image of risks.
2.6 Next
In this chapter, we started our discussion of how we actually do engineering on projects. We conclude that discussion in Chapter 3. Starting with Chapter 4, we will then use that knowledge to optimize our project management procedures in light of those engineering processes.
2.7 This Week's Facilitated Lab Session
This week is all lectures; there is no facilitated lab session.