1 Inequalities, Equations, and Graphs

Chapter Outline
1.3 The Rectangular Coordinate System
1.1 The Real Line
![]() Introduction In calculus you will study quantities described by real numbers. Therefore, we begin with a review of the set of real numbers using the terminology and notation you will encounter in calculus.
Introduction In calculus you will study quantities described by real numbers. Therefore, we begin with a review of the set of real numbers using the terminology and notation you will encounter in calculus.
Recall that the set R of real numbers consists of numbers that are either rational or irrational. Rational numbers are numbers of the form a/b, where a and b ≠ 0 are integers. For example, ![]() and
and ![]() are rational numbers. Irrational numbers are numbers that are not rational, that is, they are numbers that cannot be expressed as a quotient of integers. For example,
are rational numbers. Irrational numbers are numbers that are not rational, that is, they are numbers that cannot be expressed as a quotient of integers. For example, ![]() and π are irrational numbers. Every real number can also be written as a decimal. A rational number can be expressed either as a terminating decimal, such as
and π are irrational numbers. Every real number can also be written as a decimal. A rational number can be expressed either as a terminating decimal, such as ![]() , or a nonterminating and repeating decimal, such as
, or a nonterminating and repeating decimal, such as ![]() . Repeating decimals, such as 0.666 … and 8.545454 …, are often written as
. Repeating decimals, such as 0.666 … and 8.545454 …, are often written as ![]() and
and ![]() respectively, where the bar indicates the digit or block of digits that repeat. An irrational number is always a nonterminating and nonrepeating decimal such as
respectively, where the bar indicates the digit or block of digits that repeat. An irrational number is always a nonterminating and nonrepeating decimal such as ![]() or π = 3.14159.… The following chart summarizes the relationship between the principal sets of real numbers.
or π = 3.14159.… The following chart summarizes the relationship between the principal sets of real numbers.

![]() The Real Line The set R of real numbers can be put into a one-to-one correspondence with the set of points on a line. As a consequence, we can visualize or represent real numbers as points on a horizontal line called the number line or coordinate line. The point chosen to represent the number 0 is called the origin. The direction to the right of 0 is said to be the positive direction on the number line; the direction to the left of 0 is the negative direction. Real numbers corresponding to points to the right of 0 are called positive numbers and numbers corresponding to points to the left of 0 are negative numbers. As indicated in FIGURE 1.1.1, the number 0 is considered to be neither positive nor negative. From here on, we will not distinguish between a point on the number line and the number that corresponds to this point.
The Real Line The set R of real numbers can be put into a one-to-one correspondence with the set of points on a line. As a consequence, we can visualize or represent real numbers as points on a horizontal line called the number line or coordinate line. The point chosen to represent the number 0 is called the origin. The direction to the right of 0 is said to be the positive direction on the number line; the direction to the left of 0 is the negative direction. Real numbers corresponding to points to the right of 0 are called positive numbers and numbers corresponding to points to the left of 0 are negative numbers. As indicated in FIGURE 1.1.1, the number 0 is considered to be neither positive nor negative. From here on, we will not distinguish between a point on the number line and the number that corresponds to this point.

FIGURE 1.1.1 The real line
![]()
FIGURE 1.1.2 a is less than b
![]() Inequalities The number line is useful in demonstrating order relations between two real numbers a and b. As shown in FIGURE 1.1.2, we say that the number a is less than the number b, and write a < b, whenever the number a lies to the left of the number b on the number line. Equivalently, because the number b lies to the right of a on the number line we say that b is greater than a and write b > a. For example, 4 < 9 is the same as 9 > 4. We also use the notation a ≤ b if the number a is either less than or equal to the number b. Similarly, b ≥ a means b is greater than or equal to a. For example, 2 ≤ 5 since 2 < 5. Also, 4 ≥ 4 because 4 = 4. For any two real numbers a and b, exactly one of the following is true:
Inequalities The number line is useful in demonstrating order relations between two real numbers a and b. As shown in FIGURE 1.1.2, we say that the number a is less than the number b, and write a < b, whenever the number a lies to the left of the number b on the number line. Equivalently, because the number b lies to the right of a on the number line we say that b is greater than a and write b > a. For example, 4 < 9 is the same as 9 > 4. We also use the notation a ≤ b if the number a is either less than or equal to the number b. Similarly, b ≥ a means b is greater than or equal to a. For example, 2 ≤ 5 since 2 < 5. Also, 4 ≥ 4 because 4 = 4. For any two real numbers a and b, exactly one of the following is true:
![]()
The symbols <, >, ≥, and ≤ are called inequality symbols and expressions such as a < b or b ≥ a are called inequalities. The inequality a > 0 means the number a lies to the right of the number 0 on the number line, and so a is positive. We signify that a number a is negative by the inequality a < 0. Because the inequality a ≥ 0 means a is either greater than 0 (positive) or equal to 0 (which is neither positive nor negative), we say that a is nonnegative.
![]() Solving Inequalities We are interested in solving various kinds of inequalities containing a variable. If a real number a is substituted for the variable x in an inequality such as
Solving Inequalities We are interested in solving various kinds of inequalities containing a variable. If a real number a is substituted for the variable x in an inequality such as
![]()
and if the result is a true statement, then a is said to be a solution of the inequality. For example, −2 is a solution of (1) because if x is replaced by −2, then the resulting inequality 8(−2) + 4 < 16 + 5(−2) simplifies to the true statement −12 < 6. The word solve means that we are to find the set of all solutions of an inequality such as (1). This set is called the solution set of the inequality. Two inequalities are said to be equivalent if they have exactly the same solution set. The representation of the solution set on the number line is the graph of the inequality.
We solve an inequality by finding an equivalent inequality with obvious solutions. The following list summarizes three operations that yield equivalent inequalities.
PROPERTIES OF INEQUALITIES
Suppose a and b are real numbers and c is a nonzero real number. Then the inequality a < b is equivalent to:

Property (iii) is frequently forgotten. In words, (iii) states that:
If an inequality is multiplied by a negative number, then the direction of the resulting inequality is reversed.
For example, if we multiply the inequality −2 < 5 by −3 then the less than symbol is changed to a greater than symbol:
![]()
EXAMPLE 1 Solving the Inequality (1)
Solve 8x + 4 < 16 + 5x.
Solution We solve the inequality by using the properties of inequalities to obtain a sequence of equivalent inequalities:

Using set-builder notation, the solution set is {x|x real and x < 4}.
![]()
![]()
FIGURE 1.1.3 Solution set in Example 1 in interval notation is (−∞, 4)
![]() Interval Notation The solution set in Example 1 is graphed on the number line in FIGURE 1.1.3 as a colored arrow over the line pointing to the left. In the figure, the right parenthesis at 4 indicates that the number 4 is not included in the solution set. Because the solution set extends indefinitely to the left—the negative direction—the inequality x < 4 can also be written as −∞ < x < 4, where ∞ is the infinity symbol. In other words, the solution set of the inequality x < 4 is
Interval Notation The solution set in Example 1 is graphed on the number line in FIGURE 1.1.3 as a colored arrow over the line pointing to the left. In the figure, the right parenthesis at 4 indicates that the number 4 is not included in the solution set. Because the solution set extends indefinitely to the left—the negative direction—the inequality x < 4 can also be written as −∞ < x < 4, where ∞ is the infinity symbol. In other words, the solution set of the inequality x < 4 is
![]()
Using interval notation this set of real numbers is written (−∞, 4) and is an example of an unbounded interval. Table 1.1 summarizes various inequalities and their solution sets, as well as interval notations, names, and graphs. In each of the first four entries of the table, the numbers a and b are called the endpoints of the interval. As a set, the open interval
TABLE 1.1 Inequalities and Intervals

![]()
does not include either endpoint, whereas the closed interval
![]()
includes both endpoints. Note, too, that the graph of the last interval in Table 1.1, which extends indefinitely both to the left and to the right, is the entire real number line. In calculus the interval notation (−∞, ∞) is generally used to represent the set R of real numbers.
A word of caution is in order as you peruse Table 1.1. The infinity symbols −∞ (“minus infinity”) and ∞ (“infinity”) do not represent real numbers and should never be manipulated arithmetically like a number. The infinity symbols are merely notational devices: −∞ and ∞ are used to indicate unboundedness in the negative direction and in the positive direction, respectively. Thus when using interval notation, the symbols −∞ and ∞ can never appear next to a square bracket. For example, the expression (2, ∞] is meaningless.
An inequality of the form a < x < b is sometimes referred to as a simultaneous inequality because the number x is between the numbers a and b. In other words, x > a and simultaneously x < b. For example, the real numbers that satisfy 2 < x < 5 is the intersection of the intervals defined by the inequalities 2 < x and x < 5. Recall that the intersection of two sets A and B, written A ∩ B, is the set of elements that are in A and in B—in other words, the elements that are common to both sets. As illustrated in FIGURE 1.1.4 by the overlapping arrows extending indefinitely to the right and to the left, the solution set of the inequality 2 < x < 5 can be written as the intersection (2, ∞) ∩ (−∞, 5) = (2, 5).
EXAMPLE 2 Solving a Simultaneous Inequality
Solve − 2 ≤ 1 − 2x < 3.
Solution As previously discussed, one way of proceeding is to solve two inequalities:
![]()
and then take the intersection of the two solution sets. A faster method is to solve both of the inequalities simultaneously in the following manner:
![]()
We isolate the variable x in the middle of the last simultaneous inequality by multiplying by ![]() :
:
![]()
where we note that multiplication by the negative number has reversed the direction of the inequalities. To express this inequality in interval notation, we first rewrite it with the leftmost number on the number line on the left side of the inequality: ![]() . The solution set of the last inequality is the half-open interval
. The solution set of the last inequality is the half-open interval ![]() ; the square bracket on the right signifies that
; the square bracket on the right signifies that ![]() is included in the solution set. The graph of this interval is given in FIGURE 1.1.5.
is included in the solution set. The graph of this interval is given in FIGURE 1.1.5.
![]()

FIGURE 1.1.4 The numbers in (2, 5) are the numbers common to both (2, ∞) and (−∞, 5)
![]()
FIGURE 1.1.5 Solution set in Example 2
![]() Sign-Chart Method In Examples 1 and 2 we solved linear inequalities, that is, inequalities containing a single variable x that can be put into the forms ax + b > 0, ax + b ≤ 0, and so on. In the next several examples we illustrate the sign-chart method used in calculus for solving nonlinear inequalities. The two properties of real numbers given next are fundamental to constructing a sign chart of an inequality.
Sign-Chart Method In Examples 1 and 2 we solved linear inequalities, that is, inequalities containing a single variable x that can be put into the forms ax + b > 0, ax + b ≤ 0, and so on. In the next several examples we illustrate the sign-chart method used in calculus for solving nonlinear inequalities. The two properties of real numbers given next are fundamental to constructing a sign chart of an inequality.
SIGN PROPERTIES OF PRODUCTS
(i) The product of two real numbers is positive if and only if the numbers have the same signs, that is, either (+) (+) or (−) (−).
(ii) The product of two real numbers is negative if and only if the numbers have opposite signs, that is, (+) (−) or (−) (+).
Here are some of the basic steps of the sign-chart method illustrated in the next example.
- Use the properties of inequalities to recast the given inequality into a form where all variables and nonzero constants are on the same side of the inequality symbol and the number 0 is on the other side.
- Then, if possible, factor the expression involving the variables and constants into linear factors ax + b.
- Mark the number line at the points where the factors are zero. These points divide the number line into intervals.
- In each of these intervals, determine the sign of each factor and then the sign of the product using (i) and (ii) of the sign properties of products.
EXAMPLE 3 Solving a Nonlinear Inequality
Solve x2 ≥ −2x + 15.
Solution We begin by rewriting the inequality with all terms to the left of the inequality symbol and 0 to the right. By (i) of the properties of inequalities,
![]()
Factoring, the last expression is the same as (x + 5) (x − 3) ≥ 0.
Then we indicate on the number line where each factor is 0—in this case, x = −5 and x = 3. As shown in FIGURE 1.1.6, this divides the number line into three disjoint, or nonintersecting, intervals: (−∞, −5), (−5, 3), and (3, ∞). Note, too, that since the given inequality requires the product to be nonnegative, that is, “greater than or equal to 0,” the numbers −5 and 3 are two solutions. Next, we must determine the signs of the factors x + 5 and x − 3 on each of the three intervals. We are looking for those intervals on which the two factors are either both positive or both negative, for then their product will be positive. Since the linear factors x + 5 and x − 3 cannot change signs within these intervals, it suffices to obtain the sign of each factor at just one test value chosen from inside each interval. For example, on the interval (−∞, −5), if we use x = −10, then

![]()
FIGURE 1.1.6 Three disjoint intervals
![]() See (i) in the sign properties of products.
See (i) in the sign properties of products.
Continuing in this manner for the remaining two intervals we get the sign chart in FIGURE 1.1.7. As can be seen from the third line of this figure, the product (x + 5) (x − 3) is nonnegative on either of the unbounded intervals (−∞, −5] or [3, ∞).

FIGURE 1.1.7 Sign chart for Example 3
![]()
Because the solution set in Example 3 consists of two nonintersecting, or disjoint, intervals it cannot be expressed as a single interval. The best we can do is to write the solution set as the union of the two intervals. Recall that the union of two sets A and B, written A ∪ B, is the set of elements that are in either A or in B, or in both. Thus the solution set in Example 3 can be written (−∞, −5] ∪ [3, ∞).
EXAMPLE 4 Solving a Nonlinear Inequality
Solve (x − 4)2(x + 8)3 > 0.
Solution Since the given inequality already has the form appropriate for the sign-chart method (a factored expression to the left of the inequality symbol and 0 to the right), we begin by finding the numbers where each factor is 0, in this case, x = 4 and x = −8. We place these numbers on the number line and determine three intervals. Then in each interval we consider the signs of the powers of each linear factor. Because of the even power, we see that (x − 4)2 is never negative. However, because of the odd power, (x + 8)3 has the same sign as the factor x + 8. Observe that the numbers x = 4 and x = −8 are not solutions of the inequality because of the “greater than” symbol. Therefore, as we see in FIGURE 1.1.8, the solution set is (−8, 4) ∪ (4, ∞).

FIGURE 1.1.8 Sign chart for Example 4
![]()
EXAMPLE 5 Solving a Nonlinear Inequality
Solve ![]() .
.
Solution We begin by rewriting the inequality with all variables and nonzero constants to the left and 0 to the right of the inequality sign,
![]()
Next we put the terms over a common denominator,
![]()
![]() One thing we don’t do is clear the denominator by multiplying the inequality by x + 2. See Problem 68 in Exercises 1.1.
One thing we don’t do is clear the denominator by multiplying the inequality by x + 2. See Problem 68 in Exercises 1.1.
Now the numbers that make the three linear factors in the last expression equal to 0 are −2, 0, and 1. On the number line these three numbers determine four intervals. As a result of the “less than or equal to 0,” we see that 0 and 1 are members of the solution set. However, −2 is excluded from the solution set since substituting this value into the fractional expression results in a zero denominator (making the fraction undefined). As we can see from the sign chart in FIGURE 1.1.9, the solution set is (−∞, −2) ∪ [0, 1].

FIGURE 1.1.9 Sign chart for Example 5
![]()
NOTES FROM THE CLASSROOM

(i) Terminology used in mathematics often varies from teacher to teacher and from textbook to textbook. For example, inequalities using the symbols < or > are sometimes called strict inequalities, whereas inequalities using ≤ or ≥ are called non-strict. As another example, the positive integers 1, 2, 3, … are often referred to as the natural numbers.
(ii) Suppose the solution set of an inequality consists of the numbers such that x < −1 or x > 3. An answer seen very often on homework, quizzes, and tests is 3 < x < −1. This is a misunderstanding of the notion of simultaneity. The statement 3 < x < −1 means that x > 3 and at the same time x < −1. If you sketch this on the number line you will see that it is impossible for the same x to satisfy both inequalities. The best we can do in rewriting “x < −1 or x > 3” is to use the union of intervals (−∞, −1) ∪ (3, ∞).
(iii) Here is another frequent error: The notation a < x > b is meaningless. If, say, we have x > −2 and x > 6, then only the numbers x > 6 satisfy both conditions.
(iv) In the classroom we frequently hear the response “positive” when in reality the student means “nonnegative.” Question: x under the square root sign ![]() must be positive, right? Raise your hand if you agree. Invariably, lots of hands go up. Correct answer: x must be nonnegative, that is, x ≥ 0. Don’t forget that
must be positive, right? Raise your hand if you agree. Invariably, lots of hands go up. Correct answer: x must be nonnegative, that is, x ≥ 0. Don’t forget that ![]() .
.
1.1 Exercises
Answers to selected odd-numbered problems begin on page ANS–1.
In Problems 1−6, write the given statement as an inequality.
1. a + 2 is positive
2. 4y is negative
3. a + b is nonnegative
4. a is less than −3
5. 2b + 4 is greater than or equal to 100
6. c − 1 is less than or equal to 5
In Problems 7–14, write the given inequality using interval notation and then graph the interval.
7. x < 0
8. 0 < x < 5
9. x ≥ 5
10. −1 ≤ x
11. 8 < x ≤ 10
12. 25 < x ≤ 23
13. −2 ≤ x ≤ 4
14. x > −7
In Problems 15–18, write the given interval as an inequality.
15. [−7, 9]
16. [1, 15]
17. (−∞, 2)
18. [−5, ∞)
In Problems 19–34, solve the given linear inequality. Write the solution set using interval notation. Graph the solution set.
19. x + 3 > −2
20. 3x − 9 < 6
21. ![]()
22. ![]()
23. ![]()
24. −(1 − x) ≥ 2x − 1
25. 2 + x ≥ 3(x − 1)
26. −7x + 3 ≤ 4 − x
27. ![]()
28. −3 ≤ −x < 2
29. −7 < x − 2 < 1
30. 3 < x + 4 ≤ 10
31. ![]()
32. 100 + x ≤ 41 − 6x ≤ 121 + x
33. ![]()
34. ![]()
In Problems 35–58, solve the given nonlinear inequality. Write the solution set using interval notation. Graph the solution set.
35. x2 − 9 < 0
36. x2 ≥ 16
37. x(x − 5) ≥ 0
38. 4x2 + 7x < 0
39. x2 − 8x + 12 < 0
40. (3x + 2) (x − 1) ≤ 0
41. 9x ≥ 2x2 − 18
42. 4x2 > 9x + 9
43. (x + 1) (x − 2) (x − 4) < 0
44. ![]()
45. (x2 − 1) (x2 − 4) ≤ 0
46. (x − 1)2 (x + 3) (x − 5) ≥ 0
47. ![]()
48. ![]()
49. ![]()
50. ![]()
51. ![]()
52. ![]()
53. ![]()
54. ![]()
55. ![]()
56. ![]()
57. ![]()
58. ![]()
59. If 7 times a number is decreased by 6, the result is less than 50. What can be determined about the number?
60. The sides of a square are extended to form a rectangle. As shown in FIGURE 1.1.10, one side is extended 2 inches and the other side is extended 5 inches. If the area of the resulting rectangle is less than 130 in.2, what are the possible lengths of a side of the original square?

FIGURE 1.1.10 Rectangle in Problem 60
61. A polygon is a closed figure made by joining line segments. For example, a triangle is a three-sided polygon. Shown in FIGURE 1.1.11 is an eight-sided polygon called an octagon. A diagonal of a polygon is defined to be a line segment that joins any two nonadjacent vertices. The number of diagonals d in a polygon with n sides is given by ![]() . For what polygons will the number of diagonals exceed 35?
. For what polygons will the number of diagonals exceed 35?
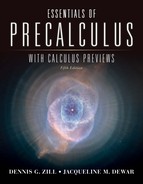
62. The total number N of dots in a triangular array with n rows is given by the formula ![]() . See FIGURE 1.1.12. How many rows can the array have if the total number of dots is to be less than 5050?
. See FIGURE 1.1.12. How many rows can the array have if the total number of dots is to be less than 5050?
Miscellaneous Applications
63. Flower Garden A rectangular flower bed is to be twice as long as it is wide. If the area enclosed must be greater than 98 m2, what can you conclude about the width of the flower bed?
64. Fever The relationship between degrees Celsius TC and degrees Fahrenheit TF is given by ![]() . A person is considered to have a fever if he or she has an oral temperature greater than 98.6°F. What temperatures on the Celsius scale indicate a fever?
. A person is considered to have a fever if he or she has an oral temperature greater than 98.6°F. What temperatures on the Celsius scale indicate a fever?

Oral thermometer
65. Parallel Resistors A 5-ohm resistor and a variable resistor are placed in parallel. The resulting resistance is given by ![]() . Determine the values of the variable resistor R for which the resulting resistance RT will be greater than 2 ohms.
. Determine the values of the variable resistor R for which the resulting resistance RT will be greater than 2 ohms.
66. What Goes Up … With the aid of calculus it is easy to show that the height s of a projectile launched straight upward from an initial height s0 with an initial velocity v0 is given by ![]() , where t is in seconds and g = 32 ft/s2. If a toy rocket is shot straight upward from ground level, then s0 = 0. If its initial velocity is 72 ft/s, during what time interval will the rocket be more than 80 ft above the ground?
, where t is in seconds and g = 32 ft/s2. If a toy rocket is shot straight upward from ground level, then s0 = 0. If its initial velocity is 72 ft/s, during what time interval will the rocket be more than 80 ft above the ground?
For Discussion
67. Discuss how you might determine the set of numbers for which the given expression is a real number.
(a) ![]()
(b)![]()
(c) ![]()
(d) ![]()
Carry out your ideas.
68. In Example 5, explain why one should not multiply the last expression in (2) by x + 2.
69. (a) If 0 < a < b, then use the properties of inequalities to show that a2 < b2.
(b) If a < b, then explain why, in general, a2 < b2 is not true.
70. Use the properties of inequalities to show that if a < b, then
![]()
The number (a + b)/2 is called the average or arithmetic mean of two numbers a and b.
1.2 Absolute Value
![]() Introduction We can use the number line to picture distance. As shown in FIGURE 1.2.1, the distance between the number 0 and the number 3 is 3, and the distance between −3 and 0 is also 3. In general, for any positive real number x, the distance between x and 0 is x. If x represents a negative number, then the distance between x and 0 is −x. The concept of distance from a number on the number line to the number 0 is described by the absolute value of that number.
Introduction We can use the number line to picture distance. As shown in FIGURE 1.2.1, the distance between the number 0 and the number 3 is 3, and the distance between −3 and 0 is also 3. In general, for any positive real number x, the distance between x and 0 is x. If x represents a negative number, then the distance between x and 0 is −x. The concept of distance from a number on the number line to the number 0 is described by the absolute value of that number.

FIGURE 1.1.11 Octagon in Problem 61
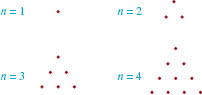
FIGURE 1.1.12 Triangular arrays of dots in Problem 62

FIGURE 1.2.1 Distance is 3 units
ABSOLUTE VALUE
For any real number x, the absolute value of x, denoted by |x|, is
![]()
Be careful. It is a common mistake to think that −x represents a negative quantity simply because of the presence of the minus sign. If a symbol x represents a negative number (that is, x < 0), then −x is a positive number. For example, if x = −10 < 0, then |x| = −x = − (−10) = 10.
As our first example shows, the symbol x in (1) is a placeholder. Other quantities can be placed inside the absolute value symbols | |.
EXAMPLE 1 Absolute Value
Write |x − 5| without absolute value symbols.
Solution Wherever the symbol x appears in (1) we replace it by x − 5:
![]()
Let’s consider each part of the foregoing definition separately. First, the inequality x − 5 ≥ 0 means that x ≥ 5. Therefore,
![]()
Check this result (that is, x − 5 is nonnegative) by substituting numbers such as 5, 8, and 10. Next, x − 5 ≥ 0 means that x < 5. In this case,

Again, you should convince yourself that this is correct (that is, −x + 5 is positive) by substituting a few numbers, such as 2 and −3.
![]()
As illustrated in Figure 1.2.1, for any real number x and its negative −x, the distance to 0 is the same. That is, |x| = |−x|. This is one property in a list of properties of the absolute value that is given next.
PROPERTIES OF ABSOLUTE VALUES

For example, by virtue of property (iii) we can rewrite the expression |−2x| as |−2| |x| = 2|x|.
![]() Distance Again If we wish to find the distance between any two numbers on the number line, then all we have to do is subtract the leftmost number from the rightmost number. For example, the distance between 10 and −2 is
Distance Again If we wish to find the distance between any two numbers on the number line, then all we have to do is subtract the leftmost number from the rightmost number. For example, the distance between 10 and −2 is
![]()
As we saw in the introduction, the distance between −3 and 0 is 0 − (−3) = 3. If an absolute value is used to define the distance, then we do not have to worry about the order of subtraction.
DISTANCE BETWEEN TWO NUMBERS
If a and b are any two numbers on the number line, the distance between a and b is
![]()
Using the properties of absolute values,

and so we have d(a, b) = d(b, a). For example, the distance between ![]() and 3 is
and 3 is
![]()
because ![]()
or ![]()
because ![]()
![]() Midpoint Suppose a and b represent two distinct numbers on the number line such that a < b. The midpoint m of the line segment between the numbers a and b is given by the average of the two endpoints of the interval [a, b], that is
Midpoint Suppose a and b represent two distinct numbers on the number line such that a < b. The midpoint m of the line segment between the numbers a and b is given by the average of the two endpoints of the interval [a, b], that is
![]()
As shown in FIGURE 1.2.2, (3) is easy to verify by using (2) to show that d(a, m) = d(m, b).
EXAMPLE 2 Midpoint
From (3), the midpoint of the line segment joining the numbers −2 and 5 is
![]()
See FIGURE 1.2.3.
![]()
FIGURE 1.2.2 Midpoint m between a and b

FIGURE 1.2.3 Midpoint in Example 2
![]() Equations Since (i) of the properties of absolute values implies that |−6| = |6| = 6, we can conclude that the simple equation |x| = 6 has two solutions, either x = − 6 or x = 6. In general, if a is a positive real number, then
Equations Since (i) of the properties of absolute values implies that |−6| = |6| = 6, we can conclude that the simple equation |x| = 6 has two solutions, either x = − 6 or x = 6. In general, if a is a positive real number, then
![]()
EXAMPLE 3 An Absolute-Value Equation
Solve (a) |5x − 3| =8 (b) |x − 4| = −3.
Solution
(a) In (4) the symbol x is a placeholder for any quantity. By replacing x by 5x − 3, the given equation is equivalent to two equations
![]()
We solve each of these. From 5x − 3 = 8, we obtain
![]()
From 5x − 3 = −8, we have
![]()
Therefore, the solutions are ![]() and −1.
and −1.
(b) Since the absolute value of a real number is always nonnegative, there is no solution to an equation such as |x − 4| = − 3.
![]()
![]() Inequalities Many important applications of inequalities involve absolute values. We have just seen that |x| represents the distance along the number line between the number x and the number 0. Thus the inequality |x| < a, where a > 0, means that the distance between x and 0 is less than a. We can see in FIGURE 1.2.4(a) that this is the set of real numbers x such that − a < x < a. On the other hand, |x| > a means that the distance between x and 0 is greater than a. In Figure 1.2.4(b), we see that these are the numbers that satisfy either x > a or x < −a. These graphical observations suggest two additional properties of absolute value.
Inequalities Many important applications of inequalities involve absolute values. We have just seen that |x| represents the distance along the number line between the number x and the number 0. Thus the inequality |x| < a, where a > 0, means that the distance between x and 0 is less than a. We can see in FIGURE 1.2.4(a) that this is the set of real numbers x such that − a < x < a. On the other hand, |x| > a means that the distance between x and 0 is greater than a. In Figure 1.2.4(b), we see that these are the numbers that satisfy either x > a or x < −a. These graphical observations suggest two additional properties of absolute value.
PROPERTIES OF ABSOLUTE VALUES (CONTINUED)
Let a be a positive real number.
![]()
Properties (vi) and (vii) also hold with the inequality symbols < and > replaced by ≤ and ≥, respectively.
EXAMPLE 4 Two Absolute-Value Inequalities
(a) From (vi) of the properties of absolute values, the inequality |x| < 1 is equivalent to the simultaneous inequality − 1 < x < 1.
(b) From (vii) of the properties of absolute values, the inequality |x| ≥ 5 is equivalent to two inequalities: x ≥ 5or x ≤ −5.
![]()
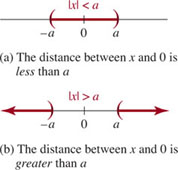
FIGURE 1.2.4 Graphical interpretation of properties (vi) and (vii)
EXAMPLE 5 Two Absolute-Value Inequalities
Solve (a) |3x − 7| < 1 (b) |2x − 5| ≤ 0.
Solution
(a) As in Example 3, the symbol x in the inequality |x| < a is simply a placeholder for other quantities. If we replace x by 3x − 7 and a by the number 1, then property (vi) yields the simultaneous inequality
![]()
which we solve in the usual manner (see Example 2 in Section 1.1):

The solution set is the open interval ![]() shown in FIGURE 1.2.5.
shown in FIGURE 1.2.5.
(b) Since the absolute value of any expression is never negative, the values of x that satisfy the inequality ≤ are those for which |2x − 5| = 0. By (ii) of the properties of absolute values we conclude that 2x − 5 = 0. Hence the only solution is ![]() .
.
![]()
An inequality such as |x − b| < a can also be interpreted in terms of distance along the number line. Since |x − b| is distance between x and b, an inequality such as |x − b| < a is satisfied by all real numbers x whose distance between x and b is less than a. This interval is shown in FIGURE 1.2.6. Note that when b = 0 we get property (vi). Similarly, the set of numbers satisfying |x − b| > a are the numbers x whose distance between x and b is greater than a.
EXAMPLE 6 An Absolute-Value Inequality
Solve ![]() .
.
Solution If we replace x and a in |x| ≥ a by ![]() and 7, respectively, then we see from property (vii) that
and 7, respectively, then we see from property (vii) that ![]() is equivalent to the two different inequalities
is equivalent to the two different inequalities
![]()
We solve each of these inequalities separately. First, we solve

In interval notation the solution set of this inequality is (−∞, −6]. Next, we solve

In interval notation the solution set is [22, ∞).
Since the two intervals are disjoint, the solution set is the union of intervals: (−∞, −6] ∪ [22, ∞). The graph of this solution set is shown in FIGURE 1.2.7.
![]()
![]()
FIGURE 1.2.5 Solution set in Example 5

FIGURE 1.2.6 The distance between x and b is less than a
![]()
FIGURE 1.2.7 Solution set in Example 6
Note in Figure 1.2.4(a) that the number 0 is the midpoint of the solution interval for |x| < a and in Figure 1.2.6 that the number b is the midpoint of the solution interval for the inequality |x − b| < a. With this in mind, work through the next example.
EXAMPLE 7 Constructing an Inequality
Find an inequality of the form |x − b| < a for which the open interval (4, 8) is its solution set.
Solution The midpoint of the interval (4, 8) is ![]() . The distance between the midpoint m and one of the endpoints of the interval is d(m, 8) = |8 − 6| = 2. Therefore the required inequality is |x − 6| < 2.
. The distance between the midpoint m and one of the endpoints of the interval is d(m, 8) = |8 − 6| = 2. Therefore the required inequality is |x − 6| < 2.
![]()
1.2 Exercises
Answers to selected odd-numbered problems begin on page ANS–1
In Problems 1–6, write the given quantity without the absolute value symbols.
1. |π − 4|
2. ![]()
3. ![]()
4. ![]()
5. |−6| − |−2|
6. | |−3| − |10| |
In Problems 7–12, write the given expression without the absolute value symbols.
7. |h|, if h is negative
8. |−h|, if h is negative
9. |x − 6|, if x < 6
10. ![]()
11. |x − y| − |y − x|
12. ![]()
In Problems 13–16, write the expression |x − 2| + |x − 5| without the absolute value symbols if x is in the given interval.
13. (−∞, 1)
14. (7, ∞)
15. (3, 4]
16. [2, 5]
In Problems 17–20, write the expression |x + 1| − |x − 3| without the absolute value symbols if x is in the given interval.
17. [−1, 3)
18. (0, 1)
19. (π, ∞)
20. (−∞, −5)
In Problems 21–24, find the distance between the given numbers and find the midpoint of the line segment between them.
21. 3, 7
22. −100, 255
23. ![]()
24. ![]() .
.
In Problems 25–28, m is the midpoint of the line segment joining a (the left endpoint) and b (the right endpoint). Use the given conditions to find the indicated quantities.
25. m = 5, d(a, m) = 3; a and b
26. m = −1, d(m, b) = 2; a and b
27. a = 4, d(a, m) = π; m and b
28. a = 10, d(m, b) = 5; m and b
In Problems 29–34, solve the given equation.
29. |4x − 1| = 2
30. |5v − 4| = 7
31. ![]()
32. |2 − 16t| = 0
33. ![]()
34. ![]()
In Problems 35–46, solve the given inequality. Write the solution set using interval notation. Graph the solution set.
35. |−5x| < 4
36. |3x| > 18
37. |3 + x| > 7
38. |x − 4| ≤ 9
39. |2x − 7| ≤ 1
40. ![]()
41. ![]()
42. |6x + 4| > 4
43. ![]()
44. ![]()
45. |x − 5| < 0.01
46. |x − (−2)| < 0.001
In Problems 47–50, proceed as in Example 7 and find an inequality |x − b| < a or |x − b| > a for which the given interval is its solution set.
47. (−3, 11)
48. (1, 2)
49. (−∞, 1) ∪ (9, ∞)
50. (−∞, −3) ∪ (13, ∞)
In Problems 51 and 52, find an inequality whose solution is the set of real numbers x satisfying the given condition. Express each set using interval notation.
51. Greater than or equal to 2 units from −3
52. Less than ![]() unit from 3.5
unit from 3.5
Miscellaneous Applications
53. Comparing Ages Bill and Mary’s ages, AB and AM, differ by at most 3 years. Write this fact as an inequality using absolute value symbols.
54. Survival Your score on the first exam is 72%. The midterm grade is the average of the first exam score with the midterm exam score. If the B range is from 80% to 89%, what score should you obtain on the midterm exam so that your mid-semester grade is B?
55. Weight of Coffee The weight w of the coffee in cans filled by a food processing company satisfies
![]()
where w is measured in ounces. Determine the interval in which w lies.
56. Weight of Cans A grocery scale is designed to be accurate to within 0.25 oz. If two identical cans of soup placed on the scale have a combined weight of 33.15 oz, what are the largest and smallest possible weights of one of the cans?
For Discussion
57. Discuss how you might solve the given inequality and equation.
(a) ![]()
(b) |5 − x| = |1 − 3x|
Carry out your ideas.
58. The distance between the number x and 5 is |x − 5|.
(a) In words, describe the graphical interpretation of the inequalities 0 < |x − 5| and 0 < |x − 5| < 3.
(b) Solve each inequality in part (a) and write each solution set using interval notation.
59.(a) Interpret |x − 3| as distance between the numbers x and 3. Sketch on the number line the set of real numbers that satisfy 2 < |x − 3| < 5.
(b) Now solve the simultaneous inequality 2 < |x − 3| <5 by first solving |x − 3| < 5 and then 2 < |x − 3|. Take the intersection of the two solution sets and compare with your sketch in part (a).
60. Here is a statement you may encounter in the beginning of a course in calculus. Express the following statement as best you can in words:
For every ∈ < 0 there exists a δ > 0 such that |y − L| < ∈ whenever 0 < |x − a| < δ.
Do not use the symbols >, <, or | |. The symbols ∈ and δ are the Greek letters epsilon and delta and represent real numbers.
1.3 The Rectangular Coordinate System
![]() Introduction In Section 1.1 we saw that each real number can be associated with exactly one point on the number, or coordinate, line. We now examine a correspondence between points in a plane and ordered pairs of real numbers.
Introduction In Section 1.1 we saw that each real number can be associated with exactly one point on the number, or coordinate, line. We now examine a correspondence between points in a plane and ordered pairs of real numbers.
![]() The Coordinate Plane A rectangular coordinate system is formed by two perpendicular number lines that intersect at the point corresponding to the number 0 on each line. This point of intersection is called the origin and is denoted by the symbol O. The horizontal and vertical number lines are called the x-axis and the y-axis, respectively. These axes divide the plane into four regions, called quadrants, which are numbered as shown in FIGURE 1.3.1(a). As we can see in FIGURE 1.3.1(b), the scales on the x- and y-axes need not be the same. Throughout this text, if tick marks are not labeled on the coordinates axes, as in Figure 1.3.1(a), then you may assume that one tick corresponds to one unit. A plane containing a rectangular coordinate system is called an xy-plane, a coordinate plane, or simply 2-space.
The Coordinate Plane A rectangular coordinate system is formed by two perpendicular number lines that intersect at the point corresponding to the number 0 on each line. This point of intersection is called the origin and is denoted by the symbol O. The horizontal and vertical number lines are called the x-axis and the y-axis, respectively. These axes divide the plane into four regions, called quadrants, which are numbered as shown in FIGURE 1.3.1(a). As we can see in FIGURE 1.3.1(b), the scales on the x- and y-axes need not be the same. Throughout this text, if tick marks are not labeled on the coordinates axes, as in Figure 1.3.1(a), then you may assume that one tick corresponds to one unit. A plane containing a rectangular coordinate system is called an xy-plane, a coordinate plane, or simply 2-space.

FIGURE 1.3.1 Coordinate plane
The rectangular coordinate system and the xy-plane are also called the Cartesian coordinate system and the Cartesian plane after the famous French mathematician and philosopher René Descartes (1596–1650).
![]() Coordinates of a Point Let P represent a point in the coordinate plane. We associate an ordered pair of real numbers with P by drawing a vertical line from P to the x-axis and a horizontal line from P to the y-axis. If the vertical line intersects the x-axis at the number a and the horizontal line intersects the y-axis at the number b, we associate the ordered pair of real numbers (a, b) with the point. Conversely, to each ordered pair (a, b) of real numbers there corresponds a point P in the plane. This point lies at the intersection of the vertical line through a on the x-axis and the horizontal line passing through b on the y-axis. Hereafter we will refer to an ordered pair as a point and denote it by either P(a, b) or (a, b).* The number a is the x-coordinate of the point and the number b is the y-coordinate of the point and we say that P has coordinates (a, b). For example, the coordinates of the origin are (0, 0). See FIGURE 1.3.2.
Coordinates of a Point Let P represent a point in the coordinate plane. We associate an ordered pair of real numbers with P by drawing a vertical line from P to the x-axis and a horizontal line from P to the y-axis. If the vertical line intersects the x-axis at the number a and the horizontal line intersects the y-axis at the number b, we associate the ordered pair of real numbers (a, b) with the point. Conversely, to each ordered pair (a, b) of real numbers there corresponds a point P in the plane. This point lies at the intersection of the vertical line through a on the x-axis and the horizontal line passing through b on the y-axis. Hereafter we will refer to an ordered pair as a point and denote it by either P(a, b) or (a, b).* The number a is the x-coordinate of the point and the number b is the y-coordinate of the point and we say that P has coordinates (a, b). For example, the coordinates of the origin are (0, 0). See FIGURE 1.3.2.
The algebraic signs of the x-coordinate and the y-coordinate of any point (x, y) in each of the four quadrants are indicated in FIGURE 1.3.3. Points on either of the two axes are not considered to be in any quadrant. Because a point on the x-axis has the form (x, 0), an equation that describes the x-axis is y = 0. Similarly, a point on the y-axis has the form (0, y) and so an equation of the y-axis is x = 0. When we locate a point in the coordinate plane corresponding to an ordered pair of numbers and represent it using a solid dot, we say that we plot or graph the point.
EXAMPLE 1 Plotting Points
Plot the points ![]() , and E(3.5, 0). Specify the quadrant in which each point lies.
, and E(3.5, 0). Specify the quadrant in which each point lies.
Solution The five points are plotted in the coordinate plane in FIGURE 1.3.4. Point A lies in the first quadrant (quadrant I), B in the second quadrant (quadrant II), and C is in the third quadrant (quadrant III). Points D and E, which lie on the y- and x-axes, respectively, are not in any quadrant.
![]()
EXAMPLE 2 Plotting Points
Sketch the set of points (x, y) in the xy-plane whose coordinates satisfy both 0 ≤ x ≤ 2 and |y| = 1.
Solution First, recall that the absolute-value equation |y| = 1 implies that y = −1 or y = 1. Thus the points that satisfy the given conditions are the points whose coordinates (x, y) simultaneously satisfy the conditions: each x-coordinate is a number in the closed interval [0, 2] and each y-coordinate is either y = −1 or y = 1. For example, ![]() are a few of the points that satisfy the two conditions. Graphically, the set of all points satisfying the two conditions are points on the two parallel line segments shown in FIGURE 1.3.5.
are a few of the points that satisfy the two conditions. Graphically, the set of all points satisfying the two conditions are points on the two parallel line segments shown in FIGURE 1.3.5.
![]()

FIGURE 1.3.2 Point with coordinates (a, b)

FIGURE 1.3.3 Algebraic signs of coordinates in the four quadrants

FIGURE 1.3.4 Plots of five points in Example 1

FIGURE 1.3.5 Set of points in Example 2
EXAMPLE 3 Regions Defined by Inequalities
Sketch the set of points (x, y) in the xy-plane whose coordinates satisfy each of the following conditions. (a) xy < 0 (b) |y| > 2
Solution
(a) From (ii) of the sign properties of products in Section 1.1, we know that a product of two real numbers x and y is negative when one of the numbers is positive and the other is negative. Thus, xy < 0 when x > 0 and y < 0 or when x < 0 and y > 0. We see from Figure 1.3.3 that xy < 0 for all points (x, y) in the second and fourth quadrants. Hence we can represent the set of points for which xy < 0 by the shaded regions in FIGURE 1.3.6. The coordinate axes are shown as dashed lines to indicate that the points on these axes are not included in the solution set.
(b) In Section 1.2 we saw that | y | ≥ 2 means that either y ≥ 2 or y ≤ −2. Since x is not restricted in any way it can be any real number, and so the points (x, y) for which
![]()

FIGURE 1.3.6 Region in the xy-plane satisfying the condition in (a) of Example 3
FIGURE 1.3.7 Region in the xy-plane satisfying the condition in (b) of Example 3
can be represented by the two shaded regions in FIGURE 1.3.7. We use solid lines to represent the boundaries y = −2 and y = 2 of the region to indicate that the points on these boundaries are included in the solution set.
![]()
![]() Distance Formula Suppose P1(x1, y1) and P2(x2, y2) are two distinct points in the xy-plane that are not on a vertical line or on a horizontal line. As a consequence, P1, P2, and P3(x1, y2) are vertices of a right triangle, as shown in FIGURE 1.3.8. The length of the side P3 P2 is |x2 − x1| and the length of the side P1P3 is |y2 − y1|. If we denote the length of P1P2 by d, then
Distance Formula Suppose P1(x1, y1) and P2(x2, y2) are two distinct points in the xy-plane that are not on a vertical line or on a horizontal line. As a consequence, P1, P2, and P3(x1, y2) are vertices of a right triangle, as shown in FIGURE 1.3.8. The length of the side P3 P2 is |x2 − x1| and the length of the side P1P3 is |y2 − y1|. If we denote the length of P1P2 by d, then
![]()
by the Pythagorean theorem. Since the square of any real number is equal to the square of its absolute value, we can replace the absolute value signs in (1) with parentheses. The distance formula given next follows immediately from (1).

FIGURE 1.3.8 Distance between points P1 and P2
DISTANCE FORMULA
The distance between any two points P1(x1, y1) and P2(x2, y2) in the xy-plane is given by
![]()
Although we derived this equation for two points not on a vertical or horizontal line, (2) holds in these cases as well. Also, because (x2 − x1)2 = (x1 − x2)2, it makes no difference which point is used first in the distance formula, that is, d(P1, P2) = d(P2, P1).
EXAMPLE 4 Distance Between Two Points
Find the distance between the points A(8, −5) and B(3, 7).
Solution From (2), with A and B playing the parts of P1 and P2:
![]()
The distance d is illustrated in FIGURE 1.3.9.
![]()
EXAMPLE 5 Three Points Form a Triangle
Determine whether the points P1 (7, 1), P2 (− 4, −1), and P3 (4, 5) are the vertices of a right triangle.
Solution From plane geometry we know that a triangle is a right triangle if and only if the sum of the squares of the lengths of two of its sides is equal to the square of the length of the remaining side. Now, from the distance formula (2), we have
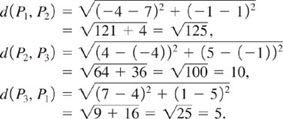
Since
![]()
we conclude that P1, P2, and P3 are the vertices of a right triangle with the right angle at P3. See FIGURE 1.3.10.
![]()
![]() Midpoint Formula In Section 1.2 we saw that the midpoint of a line segment between two numbers a and b on the number line is the average, (a + b)/2. In the xy-plane, each coordinate of the midpoint M of a line segment joining two points P1(x1, y1) and P2(x2, y2) shown in FIGURE 1.3.11 is the average of the corresponding coordinates of the endpoints of the intervals [x1, x2] and [y1, y2]
Midpoint Formula In Section 1.2 we saw that the midpoint of a line segment between two numbers a and b on the number line is the average, (a + b)/2. In the xy-plane, each coordinate of the midpoint M of a line segment joining two points P1(x1, y1) and P2(x2, y2) shown in FIGURE 1.3.11 is the average of the corresponding coordinates of the endpoints of the intervals [x1, x2] and [y1, y2]
To prove this, we note in Figure 1.3.11 that triangles P1CM and MDP2 are congruent because corresponding angles are equal and d(P1, M) = d(M, P2). Hence, d(P1,C) = d(M, D), or y − y1 = y2 − y. Solving the last equation for y gives ![]() Similarly, d(C, M) = d(D, P2), so that x − x1 = x2 − x, and therefore
Similarly, d(C, M) = d(D, P2), so that x − x1 = x2 − x, and therefore ![]() . We summarize the result.
. We summarize the result.

FIGURE 1.3.9 Distance between two points in Example 4

FIGURE 1.3.10 Triangle in Example 5

FIGURE 1.3.11 M is the midpoint of the line segment joining P1 and P2
MIDPOINT FORMULA
The coordinates of the midpoint of the line segment joining the points P1(x1, y1) and P2(x2, y2) are given by
![]()
EXAMPLE 6 Midpoint of a Line Segment
Find the coordinates of the midpoint of the line segment joining A(−2, 5) and B(4, 1).
Solution From the midpoint formula (3), the coordinates of the midpoint are given by
![]()
This point is indicated in color in FIGURE 1.3.12.
![]()

FIGURE 1.3.12 Midpoint of line segment in Example 6
1.3 Exercises
Answers to selected odd-numbered problems begin on page ANS–2.
In Problems 1–4, plot the given points.
1. (2, 3), (4, 5), (0, 2), (−1, −3)
2. (1, 4), (−3, 0), (−4, 2), (−1, −1)
3. ![]()
4. (0, 0.8) (−2, 0) (1.2, −1.2) (−2, 2)
In Problems 5–16, determine the quadrant in which the given point lies if (a, b) is in quadrant I.
5. (−a, b)
6. (a, −b)
7. (−a, −b)
8. (b, a)
9. (−b, a)
10. (−b, −a)
11. (a, a)
12. (b, −b)
13. (−a, −a)
14. (−a, a)
15. (b, −a)
16. (−b, b)
17. Plot the points given in Problems 5–16 if (a, b) is the point shown in FIGURE 1.3.13.
18. Give the coordinates of the points shown in FIGURE 1.3.14.

FIGURE 1.3.13 Point (a, b) in Problem 17

FIGURE 1.3.14 Points A-G in Problem 18
19. The points (−2, 0), (−2, 6), and (3, 0) are vertices of a rectangle. Find the fourth vertex.
20. Describe the set of all points (x, x) in the coordinate plane. The set of all points (x, −x).
In Problems 21–26, sketch the set of points (x, y) in the xy-plane whose coordinates satisfy the given conditions.
21. xy = 0
22. xy > 0
23. |x| ≤ 1 and |y| < 2
24. x ≤ 2 and y ≥ −1
25. |x| > 4
26. |y| ≤ 1
In Problems 27–32, find the distance between the given points.
27. A(1, 2), B(−3, 4)
28. A(−1, 3), B(5, 0)
29. A(2, 4), B(−4, −4)
30. A(−12, −3), B(−5, −7)
31. ![]()
32. ![]()
In Problems 33–36, determine whether the points A, B, and C are vertices of a right triangle.
33. A(8, 1), B(−3, −1), C(10, 5)
34. A(−2, −1), B(8, 2), C(1, −11)
35. A(2, 8), B(0, −3), C(6, 5)
36. A(4, 0), B(1, 1), C(2, 3)
37. Determine whether the points A(0, 0), B(3, 4), and C(7, 7) are vertices of an isosceles triangle.
38. Find all points on the y-axis that are 5 units from the point (4, 4).
39. Consider the line segment joining A(−1, 2) and B(3, 4).
(a) Find an equation that expresses the fact that a point P(x, y) is equidistant from A and from B.
(b) Describe geometrically the set of points described by the equation in part (a).
40. Use the distance formula to determine whether the points A(−1, −5), B(2, 4), and C(4, 10) lie on a straight line.
41. Find all points each with x-coordinate 6 such that the distance from each point to (−1, 2) is ![]() .
.
42. Which point, ![]() or (0.25, 0.97), is closer to the origin?
or (0.25, 0.97), is closer to the origin?
In Problems 43–48, find the midpoint of the line segment joining the points A and B.
43. A(4, 1), B(−2, 4)
44. ![]()
45. A(−1, 0), B(−8, 5)
46. ![]()
47. A(2a, 3b), B(4a, −6b)
48. A(x, x), B(−x, x+2)
In Problems 49–52, find the point B if M is the midpoint of the line segment joining points A and B.
49. ![]()
50. ![]()
51. A(5, 8), M(−1, −1)
52. A(−10, 2), M(5, 1)
53. Find the distance from the midpoint of the line segment joining A(−1, 3) and B(3, 5) to the midpoint of the line segment joining C(4, 6) and D(−2, −10).
54. Find all points on the x-axis that are 3 units from the midpoint of the line segment joining (5, 2) and (−5, −6).
55. The x-axis is the perpendicular bisector of the line segment through A(2, 5) and B(x, y). Find x and y.
56. Consider the line segment joining the points A(0, 0) and B(6, 0). Find a point C(x, y) in the first quadrant such that A, B, and C are vertices of an equilateral triangle.
57. Find the points P1(x1, y1), P2(x2, y2), and P3(x3, y3) on the line segment joining A(3, 6) and B(5, 8) that divide the line segment into four equal parts.
Miscellaneous Applications
58. Going to Chicago Kansas City and Chicago are not directly connected by an interstate highway, but each city is connected to St. Louis and Des Moines. See FIGURE 1.3.15. Des Moines is approximately 40 mi east and 180 mi north of Kansas City, St. Louis is approximately 230 mi east and 40 mi south of Kansas City, and Chicago is approximately 360 mi east and 200 mi north of Kansas City. Assume that this part of the Midwest is a flat plane and that the connecting highways are straight lines. Which route from Kansas City to Chicago, through St. Louis or through Des Moines, is shorter?
For Discussion
59. The points A(1, 0), B(5, 0), C(4, 6), and D(8, 6) are vertices of a parallelogram. Discuss: How can it be shown that the diagonals of the parallelogram bisect each other? Carry out your ideas.
60. The points A(0, 0), B(a, 0), and C(a, b) are vertices of a right triangle. Discuss: How can it be shown that the midpoint of the hypotenuse is equidistant from the vertices? Carry out your ideas.
1.4 Circles and Graphs
![]() Introduction An equation in two variables, say x and y, is simply a mathematical statement that asserts two quantities involving these variables are equal. In the fields of the physical sciences, engineering, and business, equations are a means of communication. For example, if a physicist wants to tell someone how far a rock dropped from a great height travels in a certain time t, he/she will write s = 16t2. A mathematician will look at s = 16t2 and immediately classify it as a certain type of equation. The classification of an equation carries with it information about properties shared by all equations of that kind. The remainder of this text is devoted to examining different kinds of equations involving two variables and studying their properties. Here is a sample of some of the equations you will see:
Introduction An equation in two variables, say x and y, is simply a mathematical statement that asserts two quantities involving these variables are equal. In the fields of the physical sciences, engineering, and business, equations are a means of communication. For example, if a physicist wants to tell someone how far a rock dropped from a great height travels in a certain time t, he/she will write s = 16t2. A mathematician will look at s = 16t2 and immediately classify it as a certain type of equation. The classification of an equation carries with it information about properties shared by all equations of that kind. The remainder of this text is devoted to examining different kinds of equations involving two variables and studying their properties. Here is a sample of some of the equations you will see:


FIGURE 1.3.15 Map for Problem 58
A solution of an equation in two variables x and y is an ordered pair of numbers (a, b) that yields a true statement when x = a and y = b are substituted into the equation. For example, (−2, 4) is a solution of the equation y = x2 because
![]()
is a true statement. We also say that the coordinates (−2, 4) satisfy the equation. The set of all solutions of an equation is called its solution set. Two equations are said to be equivalent if they have the same solution set. For example, we will see in Example 4 of this section that the equation x2 + y2 + 10x − 2y + 17 = 0 is equivalent to (x + 5)2 + (y − 1)2 = 32.
In the list given in (1), you might object that the first equation x = 1 does not involve two variables. It is a matter of interpretation! Because there is no explicit y dependence in the equation, x = 1 can be interpreted to mean the set
![]()
The solutions of x = 1 are then ordered pairs (1, y), where you are free to choose y arbitrarily so long as it is a real number. For example, (1, 0) and (1, 3) are solutions of the equation x = 1. The graph of an equation is the visual representation in the coordinate plane of the set of points whose coordinates (a, b) satisfy the equation. The graph of x = 1 is the vertical line shown in FIGURE 1.4.1.
![]() Circles The distance formula discussed in Section 1.3 can be used to define a set of points in the coordinate plane. One such important set is defined as follows.
Circles The distance formula discussed in Section 1.3 can be used to define a set of points in the coordinate plane. One such important set is defined as follows.
CIRCLE
A circle is the set of all points P(x, y) in the coordinate plane that are a given fixed distance r, called the radius, from a given fixed point C, called the center.

FIGURE 1.4.1 Graph of equation x = 1
If the center has coordinates C(h, k), then from the preceding definition a point P(x, y) lies on a circle of radius r if and only if
![]()
Since (x − h)2 + (y − k)2 is always nonnegative, we obtain an equivalent equation when both sides are squared. We conclude that a circle of radius r and center C(h, k) has the equation
![]()
In FIGURE 1.4.2 we have sketched a typical graph of an equation of the form given in (2). Equation (2) is called the standard form of the equation of a circle. We note that the symbols h and k in (2) represent real numbers and as such can be positive, zero, or negative. When h = 0 and k = 0, we see that the standard form of the equation of a circle with center at the origin is
![]()

FIGURE 1.4.2 Circle with radius r and center (h, k)
See FIGURE 1.4.3. When r = 1 we say that (2) is an equation of a unit circle. For example, x2 + y2 = 1 is an equation of a unit circle centered at the origin.
EXAMPLE 1 Center and Radius
Find the center and radius of the circle whose equation is
![]()
Solution To obtain the standard form of the equation, we rewrite (4) as
![]()
From this last form we identify h = 8, k = −2, and r = 7. Thus the circle is centered at (8, −2) and has radius 7.
![]()
EXAMPLE 2 Equation of a Circle
Find an equation of the circle with center C(−5, 4) with radius ![]() .
.
Solution Substituting h = −5, k = 4, and ![]() in (2), we obtain
in (2), we obtain
![]()
![]()
EXAMPLE 3 Equation of a Circle
Find an equation of the circle with center C(4, 3) and passing through P(1, 4).
Solution With h = 4 and k = 3, we have from (2)
![]()
Since the point P(1, 4) lies on the circle as shown in FIGURE 1.4.4, its coordinates must satisfy equation (5). That is,
![]()
Thus the required equation in standard form is
![]()
![]()
![]() Completing the Square If the terms (x − h)2 and (y − k)2 are expanded and the like terms grouped together, an equation of a circle in standard form can be written as
Completing the Square If the terms (x − h)2 and (y − k)2 are expanded and the like terms grouped together, an equation of a circle in standard form can be written as
![]()
Of course in this last form the center and radius are not apparent. To reverse the process—in other words, to go from (6) to the standard form (2)—we must complete the square in both x and y. Recall from algebra that adding (a/2)2 to an expression such as x2 + ax yields x2 + ax + (a/2)2, which is the perfect square (x + a/2)2. By rearranging the terms in (6),
![]()
and then adding (a/2)2 and (b/2)2 to both sides of the last equation,


FIGURE 1.4.3 Circle with radius r and center (0, 0)

FIGURE 1.4.4 Circle in Example 3
![]() The terms in color added inside the parentheses on the left-hand side are also added to the right-hand side of the equality. This new equation is equivalent to (6).
The terms in color added inside the parentheses on the left-hand side are also added to the right-hand side of the equality. This new equation is equivalent to (6).
we obtain the standard form of the equation of a circle:
![]()
You should not memorize the last equation; we strongly recommend that you work through the process of completing the square each time.
EXAMPLE 4 Completing the Square
Find the center and radius of the circle whose equation is
![]()
Solution To find the center and radius we rewrite equation (7) in the standard form (2). First, we rearrange the terms,
![]()
Then, we complete the square in x and y by adding, in turn, (10/2)2 in the first set of parentheses and (−2/2)2 in the second set of parentheses. Proceed carefully here because we must add these numbers to both sides of the equation:

From the last equation we see that the circle is centered at (−5, 1) and has radius 3. See FIGURE 1.4.5.
![]()
It is possible that an expression for which we must complete the square has a leading coefficient other than 1. For example,
![]()
is an equation of circle. As in Example 4, we start by rearranging the equation:
![]()
Now, however, we must do one extra step before attempting completion of the square, that is, we must divide both sides of the equation by 3 so that the coefficients of x2 and y2 are each 1:
![]()
At this point we can now add the appropriate numbers within each set of parentheses and to the right-hand side of the equality. You should verify that the resulting standard form is ![]() .
.
![]() Semicircles If we solve (3) for y we get y2 = r2 − x2 or
Semicircles If we solve (3) for y we get y2 = r2 − x2 or ![]() .This last expression is equivalent to two equations,
.This last expression is equivalent to two equations, ![]() . In like manner if we solve (3) for x we obtain
. In like manner if we solve (3) for x we obtain ![]() .
.
By convention, the symbol ![]() denotes a nonnegative quantity, thus the y-values defined by an equation such as
denotes a nonnegative quantity, thus the y-values defined by an equation such as ![]() are nonnegative. The graphs of the four equations highlighted in color are, in turn, the upper half, lower half, right half, and left half of the circle shown in Figure 1.4.3. Each graph in FIGURE 1.4.6 is called a semicircle.
are nonnegative. The graphs of the four equations highlighted in color are, in turn, the upper half, lower half, right half, and left half of the circle shown in Figure 1.4.3. Each graph in FIGURE 1.4.6 is called a semicircle.

FIGURE 1.4.5 Circle in Example 4

FIGURE 1.4.6 Semicircles
![]() Inequalities One last point about circles: On occasion we encounter problems where we must sketch the set of points in the xy-plane whose coordinates satisfy inequalities such as x2 + y2 < r2 or x2 + y2 ≥ r2. The equation x2 + y2 = r2 describes the set of points (x, y) whose distance to the origin (0, 0) is exactly r. Therefore the inequality x2 + y2 < r2 describes the set of points (x, y) whose distance to the origin is less than r. In other words, the points (x, y) whose coordinates satisfy the inequality x2 + y2 < r2 are in the interior of the circle. Similarly, the points (x, y) whose coordinates satisfy x2 + y2 ≥ r2 lie either on the circle or are exterior to it.
Inequalities One last point about circles: On occasion we encounter problems where we must sketch the set of points in the xy-plane whose coordinates satisfy inequalities such as x2 + y2 < r2 or x2 + y2 ≥ r2. The equation x2 + y2 = r2 describes the set of points (x, y) whose distance to the origin (0, 0) is exactly r. Therefore the inequality x2 + y2 < r2 describes the set of points (x, y) whose distance to the origin is less than r. In other words, the points (x, y) whose coordinates satisfy the inequality x2 + y2 < r2 are in the interior of the circle. Similarly, the points (x, y) whose coordinates satisfy x2 + y2 ≥ r2 lie either on the circle or are exterior to it.
![]() Graphs It is difficult to read a newspaper, read a science or business text, surf the Internet, or even watch the news on TV without seeing graphical representations of data. It may even be impossible to get past the first page in a mathematics text without seeing some kind of graph. So many diverse quantities are connected by means of equations, and so many questions about the behavior of the quantities linked by the equation can be answered by means of a graph, that the ability to graph equations quickly and accurately—like the ability to do algebra quickly and accurately— is high on the list of skills essential to your success in a course in calculus. For the rest of this section we are going to talk about graphs in general, and more specifically about two important aspects of graphs of equations.
Graphs It is difficult to read a newspaper, read a science or business text, surf the Internet, or even watch the news on TV without seeing graphical representations of data. It may even be impossible to get past the first page in a mathematics text without seeing some kind of graph. So many diverse quantities are connected by means of equations, and so many questions about the behavior of the quantities linked by the equation can be answered by means of a graph, that the ability to graph equations quickly and accurately—like the ability to do algebra quickly and accurately— is high on the list of skills essential to your success in a course in calculus. For the rest of this section we are going to talk about graphs in general, and more specifically about two important aspects of graphs of equations.
![]() Intercepts Locating the points at which the graph of an equation crosses the coordinate axes can be helpful when sketching a graph by hand. The x-intercepts of a graph of an equation are the points at which the graph crosses the x-axis. Since every point on the x-axis has y-coordinate 0, the x-coordinates of these points (if there are any) can be found from the given equation by setting y = 0 and solving for x In turn, the y-intercepts of the graph of an equation are the points at which its graph crosses the y-axis. The y-coordinates of these points can found by setting x = 0 in the equation and solving for y. See FIGURE 1.4.7.
Intercepts Locating the points at which the graph of an equation crosses the coordinate axes can be helpful when sketching a graph by hand. The x-intercepts of a graph of an equation are the points at which the graph crosses the x-axis. Since every point on the x-axis has y-coordinate 0, the x-coordinates of these points (if there are any) can be found from the given equation by setting y = 0 and solving for x In turn, the y-intercepts of the graph of an equation are the points at which its graph crosses the y-axis. The y-coordinates of these points can found by setting x = 0 in the equation and solving for y. See FIGURE 1.4.7.

FIGURE 1.4.7 Intercepts of a graph
EXAMPLE 5 Intercepts
Find the intercepts of the graphs of the equations
(a) x2 − y2 = 9 (b) y = 2x2 + 5x − 12.
Solution
(a) To find the x-intercepts we set y = 0 and solve the resulting equation x2 = 9 for x:
![]()
gives x = −3 and x = 3. The x-intercepts of the graph are the points (−3, 0) and (3, 0). To find the y-intercepts we set x = 0 and solve −y2 = 9 or y2 = −9 for y. Because there are no real numbers whose square is negative we conclude the graph of the equation does not cross the y-axis.
(b) Setting y = 0 yields 2x2 + 5x − 12 = 0. This is a quadratic equation and can be solved either by factoring or by the quadratic formula. Factoring gives
![]()
and so x = −4 and ![]() . The x-intercepts of the graph are the points (−4, 0) and
. The x-intercepts of the graph are the points (−4, 0) and ![]() . Now, setting x = 0 in the equation y = 2x2 + 5x − 12 immediately gives y = −12. The y-intercept of the graph is the point (0, −12).
. Now, setting x = 0 in the equation y = 2x2 + 5x − 12 immediately gives y = −12. The y-intercept of the graph is the point (0, −12).
![]()
EXAMPLE 6 Example 4 Revisited
Let’s return to the circle in Example 4 and determine its intercepts from the equation in (7). Setting y = 0 in x2 + y2 + 10x − 2y + 17 = 0 and using the quadratic formula to solve x2 + 10x + 17 = 0 shows the x-intercepts of this circle are ![]() and
and ![]() . If we let x = 0, then the quadratic formula shows that the roots of the equation y2 − 2y + 17 = 0 are complex numbers. As seen in Figure 1.4.5, the circle does not cross the y-axis.
. If we let x = 0, then the quadratic formula shows that the roots of the equation y2 − 2y + 17 = 0 are complex numbers. As seen in Figure 1.4.5, the circle does not cross the y-axis.
![]()
![]() Symmetry A graph can also possess symmetry. You may already know that the graph of the equation y = x2 is called a parabola. FIGURE 1.4.8 shows that the graph of y = x2 is symmetric with respect to the y-axis since the portion of the graph that lies in the second quadrant is the mirror image or reflection of that portion of the graph in the first quadrant. In general, a graph is symmetric with respect to the y-axis if whenever (x, y) is a point on the graph, (− x, y) is also a point on the graph. Note in Figure 1.4.8 that the points (1, 1) and (2, 4) are on the graph. Because the graph possesses y-axis symmetry, the points (−1, 1) and (−2, 4) must also be on the graph. A graph is said to be symmetric with respect to the x-axis if whenever (x, y) is a point on the graph, (x, −y) is also a point on the graph. Finally, a graph is symmetric with respect to the origin if whenever (x, y) is on the graph, (−x, −y) is also a point on the graph. FIGURE 1.4.9 illustrates these three types of symmetries.
Symmetry A graph can also possess symmetry. You may already know that the graph of the equation y = x2 is called a parabola. FIGURE 1.4.8 shows that the graph of y = x2 is symmetric with respect to the y-axis since the portion of the graph that lies in the second quadrant is the mirror image or reflection of that portion of the graph in the first quadrant. In general, a graph is symmetric with respect to the y-axis if whenever (x, y) is a point on the graph, (− x, y) is also a point on the graph. Note in Figure 1.4.8 that the points (1, 1) and (2, 4) are on the graph. Because the graph possesses y-axis symmetry, the points (−1, 1) and (−2, 4) must also be on the graph. A graph is said to be symmetric with respect to the x-axis if whenever (x, y) is a point on the graph, (x, −y) is also a point on the graph. Finally, a graph is symmetric with respect to the origin if whenever (x, y) is on the graph, (−x, −y) is also a point on the graph. FIGURE 1.4.9 illustrates these three types of symmetries.

FIGURE 1.4.8 Graph with y-axis symmetry

FIGURE 1.4.9 Symmetries of a graph
Observe that the graph of the circle given in Figure 1.4.3 possesses all three of these symmetries.
As a practical matter we would like to know whether a graph possesses any symmetry in advance of plotting it. This can be done by applying the following tests to the equation that defines the graph.
TESTS FOR SYMMETRY
The graph of an equation is symmetric with respect to:
(i) the y-axis if replacing x by − x results in an equivalent equation;
(ii) the x-axis if replacing y by −y results in an equivalent equation;
(iii) the origin if replacing x and y by − x and −y results in an equivalent equation.
The advantage of using symmetry in graphing should be apparent: If, say, the graph of an equation is symmetric with respect to the x-axis, then we need only produce the graph for y ≥ 0 since points on the graph for y < 0 are obtained by taking the mirror images, through the x-axis, of the points in the first and second quadrants.
EXAMPLE 7 Test for Symmetry
By replacing x by −x in the equation y = x2 and using (−x)2 = x2, we see that
![]()
This proves what is apparent in Figure 1.4.8: that the graph of y = x2 is symmetric with respect to the y-axis.
![]()
EXAMPLE 8 Intercepts and Symmetry
Determine the intercepts and any symmetry for the graph of
![]()
Solution
Intercepts: Setting y = 0 in equation (8) immediately gives x = 10. The graph of the equation has a single x-intercept, (10, 0). When x = 0, we get y2 = 10, which implies that ![]() . Thus there are two y-intercepts,
. Thus there are two y-intercepts, ![]() .
.
Symmetry: If we replace x by −x in the equation x + y2 = 10 we get −x + y2 = 10. This is not equivalent to equation (8). You should also verify that replacing x and y by −x and −y in (8) does not yield an equivalent equation. However, if we replace y by −y, we find that
![]()
Thus, the graph of the equation is symmetric with respect to the x-axis.
Graph: In the graph of the equation given in FIGURE 1.4.10, the intercepts are indicated and the x-axis symmetry should be apparent.
![]()
1.4 Exercises
Answers to selected odd-numbered problems begin on page ANS–2.
In Problems 1–6, find the center and the radius of the given circle. Sketch its graph.
1. x2 + y2 = 5
2. x2 + y2 = 9
3. x2 + (y − 3)2 = 49
4. (x + 2)2 + y2 = 36
5. ![]()
6. (x + 3)2 + (y − 5)2 = 25
In Problems 7–14, complete the square in x and y to find the center and the radius of the given circle.
7. x2 + y2 + 8y = 0
8. x2 + y2 − 6x = 0
9. x2 + y2 + 2x − 4y − 4 = 0
10. x2 + y2 − 18x − 6y − 10 = 0
11. x2 + y2 − 20x + 16y + 128 = 0
12. x2 + y2 + 3x − 16y + 63 = 0
13. 2x2 + 2y2 + 4x + 16y + 1=0
14. ![]()
In Problems 15–24, find an equation of the circle that satisfies the given conditions.
15. center (0, 0), radius 1
16. center (1, −3), radius 5
17. center radius (0, 2), radius ![]()
18. center radius (−9, −4), radius ![]()
19. endpoints of a diameter at (− 1, 4) and (3, 8)
20. endpoints of a diameter at (4, 2) and (−3, 5)
21. center (0, 0), graph passes through (− 1, −2)
22. center (4, −5), graph passes through (7, −3)
23. center (5, 6), graph tangent to the x-axis
24. center (−4, 3), graph tangent to the y-axis

FIGURE 1.4.10 Graph of equation in Example 8
In Problems 25–28, sketch the semicircle defined by the given equation.
25. ![]()
26. ![]()
27. ![]()
28. ![]()
29. Find an equation for the upper half of the circle x2 + (y − 3)2 = 4. Repeat for the right half of the circle.
30. Find an equation for the lower half of the circle (x − 5)2 + (y − 1)2 = 9. Repeat for the left half of the circle.
In Problems 31–34, sketch the set of points in the xy-plane whose coordinates satisfy the given inequality.
31. x2 +y2 ≥ 9
32. (x − 1)2 + (y + 5)2 ≤ 25
33. 1≤ x2 +y2 ≤ 4
34. x2 + y2 > 2y
In Problems 35 and 36, find the x- and y-intercepts of the given circle.
35. the circle with center (3, −6) and radius 7
36. the circle x2 + y2 + 5x − 6y = 0
In Problems 37–62, find any intercepts of the graph of the given equation. Determine whether the graph of the equation possesses symmetry with respect to the x-axis, y-axis, or origin. Do not graph.
37. y = − 3x
38. y − 2x = 0
39. −x + 2y= 1
40. 2x +3y = 6
41. x = y2
42. y =x3
43. y = x2 − 4
44. x = 2y2 − 4
45. y =x2 − 2x − 2
46. y2 = 16(x +4)
47. y = x (x2 − 3)
48. y =(x − 2)2(x + 2)2
49. ![]()
50. y3 − 4x2 + 8 =0
51. 4y2 − x2 = 36
52. ![]()
53. ![]()
54. ![]()
55. ![]()
56. ![]()
57. ![]()
58. ![]()
59. y = |x − 9|
60. x = |y| − 4
61. |x| + |y| = 4
62. x + 3 = |y − 5|
In Problems 63–66, state all the symmetries of the given graph.
63.

FIGURE 1.4.11 Graph for Problem 63
64.

FIGURE 1.4.12 Graph for Problem 64
65.

FIGURE 1.4.13 Graph for Problem 65
66.

FIGURE 1.4.14 Graph for Problem 66
In Problems 67–72, use symmetry to complete the given graph.
67. The graph is symmetric with respect to the y-axis.
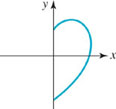
FIGURE 1.4.15 Graph for Problem 67
68. The graph is symmetric with respect to the x-axis.

FIGURE 1.4.16 Graph for Problem 68
69. The graph is symmetric with respect to the origin.

FIGURE 1.4.17 Graph for Problem 69
70. The graph is symmetric with respect to the y-axis.

FIGURE 1.4.18 Graph for Problem 70
71. The graph is symmetric with respect to the x- and y-axes.

FIGURE 1.4.19 Graph for Problem 71
72. The graph is symmetric with respect to the origin.

FIGURE 1.4.20 Graph for Problem 72
For Discussion
73. Determine whether the following statement is true or false. Defend your answer.
If a graph has two of the three symmetries defined on page 30, then the graph must necessarily possess the third symmetry.
74. (a) The radius of the circle in FIGURE 1.4.21(a) is r. What is its equation in standard form?
(b) The center of the circle in FIGURE 1.4.21(b) is (h, k). What is its equation in standard form?

FIGURE 1.4.21 Graph for Problem 74
75. Discuss whether the following statement is true or false:
Every equation of the form x2 + y2 + ax + by + c = 0 is a circle.
76. Find the areas of the shaded regions in FIGURE 1.4.22.

FIGURE 1.4.22 Circles for Problem 76
77. Show that the triangle in part (b) of Problem 76 is an equilateral triangle.
1.5 Algebra and Limits

![]() Introduction A calculus problem often consists of a sequence of steps, where most of the steps are algebra and only the last few—sometimes just the last step—involve calculus. The discussion that follows focuses on one kind of calculus problem: the computation of a certain type of limit. Although we give a brief and intuitive introduction to the notion of a limit, the thrust of the discussion is an overview of the type of algebra frequently encountered in such problems.
Introduction A calculus problem often consists of a sequence of steps, where most of the steps are algebra and only the last few—sometimes just the last step—involve calculus. The discussion that follows focuses on one kind of calculus problem: the computation of a certain type of limit. Although we give a brief and intuitive introduction to the notion of a limit, the thrust of the discussion is an overview of the type of algebra frequently encountered in such problems.
In this section we are concerned only with fractional expressions. It suffices to think of a fractional expression as a quotient of two algebraic expressions.* Roughly, an algebraic expression is one that is the result of performing a finite number of additions, subtractions, multiplications, divisions, or roots on a collection of variables and real numbers. For example, some algebraic expressions in a single variable x are
![]()
An area of algebra that causes difficulties in working calculus problems is the manipulation of fractional expressions.
![]() Factoring When the distributive law
Factoring When the distributive law
![]()
is read right to left,
![]()
we say that the expression ab + ac has been factored. We will see in Chapter 3 that factoring plays an important role in solving equations, as well as in graphing. But in the present context we are concerned only with using factoring to simplify fractional expressions.
The following three factorization formulas are important and are used as a matter of course throughout various fields of mathematics.
FACTORIZATIONS WORTH KNOWING

The symbols a and b in (1)–(3) are placeholders. For example, the expression x4 − 16 is of the form given in (1). With the identifications a = x2 and b = 4, we have
![]()
Since the factor x2 − 4 is also the difference of two squares, (4) continues as
![]()
The factorization in (5) is as far as we can go using real numbers and integer exponents; the sum of two squares x2 + 4 does not factor using real numbers. As another example, consider the expression 2x2 − 3. Since any positive real number can be written as the square of its square root we have ![]() , and so from (1) the expression 2x2 − 3 factors in the following manner:
, and so from (1) the expression 2x2 − 3 factors in the following manner:

We use factoring and the cancellation property to simplify a fractional expression.
EXAMPLE 1 Factoring and Canceling
Simplify (a) ![]() (b)
(b) ![]()
![]() Cancellation Property: If a, b, and c are real numbers, then
Cancellation Property: If a, b, and c are real numbers, then
![]()
Solution
(a) From (1) we see
![]()
The cancellation of x − 1 in the foregoing expression is only valid for x ≠ 1. For x = 1 we would be dividing by 0.
(b) We look for factors x − a and x − b such that
![]()
This implies ab = −21, so a and b must be factors of −21 whose sum is − (a + b) = −4. The usual trial and error procedure leads to a = 7 and b = −3. Therefore,
![]()
![]() Binomial Expansion A two-term algebraic expression a + b is called a binomial. You undoubtedly have worked problems where you had to expand powers of binomials such as (a + b)2 and (a + b)3. This occurs so often in mathematics courses that we recommend that you memorize the expansions given in (6) and (7).
Binomial Expansion A two-term algebraic expression a + b is called a binomial. You undoubtedly have worked problems where you had to expand powers of binomials such as (a + b)2 and (a + b)3. This occurs so often in mathematics courses that we recommend that you memorize the expansions given in (6) and (7).
BINOMIAL EXPANSIONS WORTH KNOWING
Expansions of (a + b)n for
![]()
Of course, formulas (6) and (7) work just as well for a binomial in the form of a difference a − b. Simply treat a − b as the sum a + (−b) and replace the symbol b in (6) and (7) by − b:
![]()
and
![]()
There are ways of remembering how to obtain the coefficients in the expansion of higher powers such as (a + b)4. Pascal’s triangle is one such way and is reviewed in the Student Resource Manual that accompanies this text.
EXAMPLE 2 Binomial Expansion
Simplify ![]()
Solution We use the expansion of (a + b)2 given in (6) with a = 7and b = h:
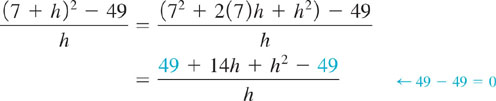

![]() Addition of Fractional Expressions Combining two or more fractional expressions, or simplification of a complex fraction where the numerator or denominator is itself a fraction, can be particularly troublesome for some students.
Addition of Fractional Expressions Combining two or more fractional expressions, or simplification of a complex fraction where the numerator or denominator is itself a fraction, can be particularly troublesome for some students.
EXAMPLE 3 Addition of Fractions
Write as one fraction ![]()
Solution Because 2x2 + 3x − 2 = (2x − 1) (x + 2), the least common denominator of the three terms is (2x − 1) (x + 2). Therefore, we multiply the second term by (2x − 1)/(2x − 1) and the third term by (x − 2)/(x − 2):
![]()
Adding numerators and simplifying gives

The cancellation of x + 2 is permissible provided x ≠ −2.
![]()
We will illustrate the simplification of a complex fraction in Example 9.
![]() Rationalization You may have learned rationalization of a denominator in a previous mathematics course. Recall that rationalization of a denominator consists of multiplying an expression by a factor equal to 1 with the intent of clearing a radical from a denominator. For example, to rationalize the denominator in
Rationalization You may have learned rationalization of a denominator in a previous mathematics course. Recall that rationalization of a denominator consists of multiplying an expression by a factor equal to 1 with the intent of clearing a radical from a denominator. For example, to rationalize the denominator in ![]() we multiply the fraction by
we multiply the fraction by ![]() :
:

There is no rule in mathematics that says only denominators must be rationalized. There are times in calculus when we are interested in rationalization not only of denominators but numerators as well. The next example uses the factorization of the difference of two squares in a slightly different manner. For a > 0 and b > 0, we can write ![]() , and so we can write
, and so we can write ![]() . It then follows from (1) that
. It then follows from (1) that
![]()
A variation of (8) is ![]() . Thus if a numerator or denominator of a fractional expression contains a binomial term that includes at least one radical, such as
. Thus if a numerator or denominator of a fractional expression contains a binomial term that includes at least one radical, such as
![]()
we multiply the numerator and the denominator of the fraction by the corresponding conjugate factor
![]()
For example, to rationalize the denominator of ![]() we use (8) to write
we use (8) to write

EXAMPLE 4 Rationalization of a Numerator
Rationalize the numerator in ![]() .
.
Solution Think of the numerator as ![]() where a = 4 + x and b = 2. Because the conjugate factor of
where a = 4 + x and b = 2. Because the conjugate factor of ![]() , we are able to clear the radical in the numerator by multiplying the numerator and denominator of the given fractional expression by
, we are able to clear the radical in the numerator by multiplying the numerator and denominator of the given fractional expression by ![]() :
:

After canceling the x’s in the numerator and the denominator in the last term the rationalization is complete:
![]()
![]()
![]() Limits—The Calculus Connection Consider the fractional algebraic expression
Limits—The Calculus Connection Consider the fractional algebraic expression ![]() . Observe that this fraction cannot be evaluated at x = 1 because substituting 1 into the expression results in the undefined quantity 0/0. However, the fractional expression can be evaluated at any other real number; in particular, it can be evaluated at numbers that are very close to 1. The numerical values of the fractional expression given in the following two tables are easily obtained using the simplification in part (a) of Example 1:
. Observe that this fraction cannot be evaluated at x = 1 because substituting 1 into the expression results in the undefined quantity 0/0. However, the fractional expression can be evaluated at any other real number; in particular, it can be evaluated at numbers that are very close to 1. The numerical values of the fractional expression given in the following two tables are easily obtained using the simplification in part (a) of Example 1:

If we let the arrow symbol → represent the word approach, then the symbolism x → a− indicates that x approaches the number a from the left, that is, through numbers that are less than a, and x → a+ means that x approaches a from the right, or through numbers that are greater than a. In the left-hand table in (9) we are letting x → 1−, and in the right-hand table x → 1+. Each table in (9) shows that the fractional expression ![]() is close to the number 2 when x is close to 1, that is,
is close to the number 2 when x is close to 1, that is,
![]()
We say that 2 is the limit of ![]() as x approaches 1 and write
as x approaches 1 and write
![]()
Before proceeding any further, we should make it clear that a limit of an expression need not exist. In the next two tables, consider 1/x as x approaches zero:

As can be seen in the tables, as x gets closer and closer to 0, the values of 1/x are becoming larger and larger in absolute value. In other words, 1/x is becoming unbounded. In this case we write
![]()
where ∞ is the infinity symbol. We say that ![]() does not exist.
does not exist.
Suppose the symbol f(x) denotes an expression involving a single variable x and that the symbols a and L represent real numbers. If, as illustrated in (10),
![]()
then we say that ![]() exists and write
exists and write
![]()
In calculus, you will not be asked to find a limit by constructing tables of numerical values, although you surely will be asked to construct such tables because they are useful in convincing yourself of either the existence or the nonexistence of a limit. (See Problems 47 and 48 in Exercises 1.5.) Limits are either found or are proved to exist using analytical methods, in many cases using proven laws or properties of limits. Because it is not our goal to delve into theoretical or geometrical interpretations of a limit, and because we want to make the point that the calculus part of some problems is often the least significant part of the solution, we will accept three results from calculus without proof: If a and c are real numbers, then
![]()
where n is a positive integer. For example, (12) allows us to write*
![]()
and
![]()
In the preceding line we used ![]() .
.
The limit concept is the foundation of calculus, and one kind of limit is of particular significance in calculus: the limit of a fractional expression where both the numerator and the denominator are approaching 0. Such a limit is said to have the indeterminate form 0/0.For example, in view of the results in (12), ![]() . Therefore
. Therefore ![]() has the indeterminate form 0/0. Of course, not all limit problems have this indeterminate form, but because of their importance (see Section 2.9), the limits in the remaining five examples, as well as all the limits in Exercises 1.5, have the form 0/0. Moreover, for simplicity we will only consider limits that actually exist.
has the indeterminate form 0/0. Of course, not all limit problems have this indeterminate form, but because of their importance (see Section 2.9), the limits in the remaining five examples, as well as all the limits in Exercises 1.5, have the form 0/0. Moreover, for simplicity we will only consider limits that actually exist.
We now show you how to find ![]() without the help of numerical tables:
without the help of numerical tables:

Done! The intermediate steps were all algebra performed to rewrite the expression in a more tractable form, a form where the actual limit can be computed with minimal effort.
EXAMPLE 5 Example 1 Revisited
Find ![]()
Solution This is the fractional expression in part (b) of Example 1. Observe that as x → −3, the given limit has the indeterminate form 0/0. Now, using the algebraic simplification of this expression done in Example 1, we find that

![]()
EXAMPLE 6 Example 2 Revisited
Find ![]() .
.
Solution Using the algebra from Example 2,
![]()
![]()
EXAMPLE 7 Example 3 Revisited
Find ![]()
Solution Were this a calculus course, you should observe that the first and second terms are of the form 1/0 as x → −2. You may think that this is the situation ∞ − ∞, and so gives 0. No. Remember we never treat ∞ as we would a number. The observation that the given algebraic expression contains these undefined quantities should trigger the idea that combining the fractions into one fractional expression would be a way to proceed. After carrying out the algebra, as done in Example 3, you would then finish the problem as follows:

![]()
EXAMPLE 8 Example 4 Revisited
Find ![]()
Solution Using the algebra from Example 4, we find

![]()
When finding the value of a limit, the algebra can be done as a side problem (as we have done in Examples 1–4), and then making use of your work, completing the problem as we have illustrated in Examples 5–8. In our last example, we combine the algebra with computing the limit. We recommend that you work through this example rather than just read it.
EXAMPLE 9 Limit of a Complex Fraction
Find 
Solution The given expression is an example of a complex fraction, that is, a quotient where either the numerator or denominator is a fractional expression. We begin by finding a common denominator in the numerator:

To continue we use the expansion of (a + b)3 given in (7) with a = 2 and b = x:

Because the x in the denominator of the last complex fraction is equivalent to the fraction x/1 we invert and multiply:

![]() Recall that division of fractions is converted into multiplication of fractions:
Recall that division of fractions is converted into multiplication of fractions:

Finally, we have

since ![]() by (12)
by (12)
NOTES FROM THE CLASSROOM

(i) On tests we see students carrying out the expansion of (a + b)3 by brute force, multiplying out (a + b)(a + b) (a + b). This procedure is not recommended; it is slow and you are prone to errors. Instead, you should memorize (6) and (7).
(ii) In any mathematics course—not just calculus—do not erase or leave out important steps of your work. Most mathematics instructors want to see all work. Presenting that work in a neat and orderly fashion is also to your advantage. Finally, in the case of a limit problem such as Example 9, be sure to write down the symbol ![]() at each step. For example, we frequently see incorrect statements like this:
at each step. For example, we frequently see incorrect statements like this:
![]()
on students’ papers. The correct version of the preceding line is
![]()
1.5 Exercises
Answers to selected odd-numbered problems begin on page ANS–3.
In Problems 1–12, use factorization to simplify the given expression in part (a). Then, if instructed, find the indicated limit in part (b).
1. (a) ![]()
(b) ![]()
2. (a) ![]()
(b) ![]()
3. (a) ![]()
(b) ![]()
4. (a) ![]()
(b) ![]()
5. (a) ![]()
(b) ![]()
6. (a) ![]()
(b) ![]()
7. (a) ![]()
(b) ![]()
8. (a) ![]()
(b) ![]()
9. (a) ![]()
(b) ![]()
10. (a) ![]()
(b) ![]()
11. (a) ![]()
(b) ![]()
12. (a) ![]()
(b) ![]()
In Problems 13–20, use binomial expansion to simplify the given expression in part (a). Then, if instructed, find the indicated limit in part (b).
13. (a) ![]()
(b) ![]()
14. (a) ![]()
(b) ![]()
15. (a) ![]()
(b) ![]()
16. (a) ![]()
(b) ![]()
17. (a) ![]()
(b) ![]()
18. (a) ![]()
(b) ![]()
19. (a) ![]()
(b) ![]()
20. (a) ![]()
(b) ![]()
In Problems 21–26, use addition of algebraic fractions to simplify the given expression in part (a). Then, if instructed, find the indicated limit in part (b).
21. (a) ![]()
(b) ![]()
22. (a) ![]()
(b) ![]()
23. (a) ![]()
(b) ![]()
24. (a) ![]()
(b) ![]()
25. (a) 
(b) 
26. (a) ![]()
(b) ![]()
In Problems 27–34, use rationalization to simplify the given expression in part (a). Then, if instructed, find the indicated limit in part (b).
27. (a) ![]()
(b) ![]()
28. (a) 
(b) 
29. (a) ![]()
(b) ![]()
30. (a) ![]()
(b) ![]()
31. (a) ![]()
(b) ![]()
32. (a) ![]()
(b) ![]()
33. (a) ![]()
(b) ![]()
34. (a) ![]()
(b) ![]()
Miscellaneous Calculus-Related Problems
In Problems 35–40, the given algebraic expression is an unsimplified answer to a calculus problem. Simplify the expression.
35. 
36. 
37. (3x2 + 4x − 1) (4) (2x − 3)3 (2) + (2x − 3)4 (6x + 4)
38. ![]()
39. ![]()
40. ![]()
In Problems 41–46, the given equation is a partial answer to a calculus problem. Solve the equation for the symbol y′
41. 3y2y′ − y − xy′ = x
42. y′ = 2(x − y) (1 − y′)
43. 2yy′ + 2x = y′
44. 2xy2 + x2 (2y)y′ − 2 = −3y′
45. ![]()
46. ![]()
Calculator/Computer Problems
In Problems 47 and 48, use a calculator or computer to estimate the given limit by completing each table. Round the entries in each table to eight decimal places.
47. ![]()

48. ![]()
![]()
For Discussion
In Problems 49 and 50, discuss what algebra is necessary to evaluate the given limit. Carry out your ideas.
49. ![]()
50. ![]()
CHAPTER 1 Review Exercises
Answers to selected odd-numbered problems begin on page ANS–3.
In Problems 1–20, fill in the blanks.
1. An inequality with (−∞, 9] as its solution set is _______.
2. The solution set of the inequality −3 < x ≤ 8 as an interval is _______.
3. If the point (a, b) lies in quadrant IV, then (b, a) lies in quadrant _______.
4. The point (x, −3x) in the second quadrant that is 5 units from (2, −1) is ______.
5. If the graph of an equation contains the point (2, 3) and is symmetric with respect to the x-axis, then the graph also contains the point ______.
6. If the graph of an equation contains the point (−1, 6) and is symmetric with respect to the origin, then the graph also contains the point ______.
7. An equation of a circle with center (−2, −5) and radius 6 is______.
8. If |2 − x| = 15, then x = ______.
9. The distance from the midpoint of the line segment joining (4, −6) and (−2, 0) to the origin is ______.
10. The graph of y = 2|x| − 5 is symmetric with respect to ______.
11. The intercepts of the graph of y = 2 |x| − 5 are ______.
12. The circle x2 − 16x + y2 = 0 is symmetric with respect to ______.
13. The center and radius of the circle x2 − 16x + y2 = 0 are ______.
14. The intercepts of the circle (x − 1)2 + (y − 2)2 = 10 are ______.
15. Two points on the circle x2 + y2 = 25 with the same x-coordinate −3 are ______.
16. The graph of ![]() is a ______.
is a ______.
17. The inequality ______ describes the set of points in the xy-plane outside the circle x2 + y2 = 36.
18. If ![]() lies on the graph of y = 2x, then a = ______.
lies on the graph of y = 2x, then a = ______.
19. The set of real numbers x whose distance between x and ![]() is greater than 3 is defined by the absolute-value inequality ______.
is greater than 3 is defined by the absolute-value inequality ______.
20. A point (x, y) in the xy-plane whose coordinates satisfy xy < 0 lies in quadrants) ______ or ______.
In Problems 21–40, answer true or false.
21. The word nonnegative means the same as the word positive.______
22. The number 0 is neither positive nor negative.______
23. −3 is not greater than −1.______
24. If a < b, then b − a is a positive number.______
25. If a < b, then a2 < b2. ______
26. For any real number a, −a ≤ a. ______
27. If a < 0, then ![]() ______
______
28. If a2 < a, then a < 1.______
29. If x is a negative number, then −x is a positive number.______
30. The solution set of |4x − 6| ≥ −1 is (−∞, ∞).______
31. |−3t + 6| = 3|t − 2| ______
32. The point (5, 0) is in quadrant I. ______
33. The point (−3, 7) is in quadrant III. ______
34. The distance between the points (0, 0) and (3, 6) is 9.______
35. To find y-intercepts of the graph of an equation we let x = 0 and solve for y.______
36. There is no point on the circle x2 + y2 − 10x + 22 = 0 with x-coordinate 2. ______
37. A circle whose equation can be put into the form x2 + y2 + ax + by = 0 must pass through the origin.______
38. The points (0, 0), (a, 0), a > 0, and (0, b), b < 0, are vertices of a right triangle.______
39. The graph of the equation x2y + 4y = x is symmetric with respect to the origin. ______
40. The inequality ![]() has no solution.______
has no solution.______
In Problems 41–44, assume that 0 < a < b. Compare the given expressions using inequality symbols.
41. a and ab
42. −a and − b
43. a and a + b
44. ![]()
In Problems 45–50, fill in the blank with either an appropriate inequality symbol or a number.
45. If x − 10 > 5, then x +______ > 25.
46. If x − 2 ≤ 7, then x ______ 9.
47. If ![]() , then x ______−12.
, then x ______−12.
48. If 3x − 6 ≤ 4x − 4, then x ______ 2.
49. If −2 ≤ 1 − x ≤ 5, then ______ ≤ x ≤ ______.
50. If −3 < x < 9, then ______ < −2x < ______.
51. On the number line, m = 5 is the midpoint of the line segment joining the number a (left endpoint) and the number b (right endpoint). Use the fact that d(a, b) = 2 to find a and b.
52. In the xy-plane, find an equation that describes the set of points (x, y) that are equidistant from (0, 5) and (x, −5).
In Problems 53–66, solve the given inequality. Write the solution set using interval notation.
53. 2x − 5 ≥ 6x + 7
54. ![]()
55. −4 < x − 8 < 4
56. 7 ≤ 3 − 2x < 11
57. |x| > 10
58. |−6x| ≤ 42
59. |3x − 4| < 5
60. |5 − 2x| ≥ 7
61. 3x ≥ 2x2 − 5
62. x2 > 6x − 9
63. x3 > x
64. (x2 − x) (x2 + x) ≤ 0
65. ![]()
66. ![]()
In Problems 67–70, simplify the given expression in part (a). Then, if instructed, find the indicated limit in part (b).
67. (a) ![]()
(b) ![]()
68. (a) ![]()
(b) ![]()
69. (a) ![]()
(b) ![]()
70. (a) ![]()
(b) ![]()
* This is the same notation used to denote an open interval. It should be clear from the context of the discussion whether we are considering a point (a, b) or an open interval (a, b).
* At this point we are excluding trigonometric functions, logarithms, and exponentials. See Chapters 4 and 5.
* We are actually using several other properties of limits here. However, we do not feel this is the place to discuss all the properties of the limit concept.