4 Trigonometric Functions

Chapter Outline
4.1 Angles and Their Measurement
4.2 The Sine and Cosine Functions
4.3 Graphs of Sine and Cosine Functions
4.4 Other Trigonometric Functions
4.7 Inverse Trigonometric Functions
4.9 Right Triangle Trigonometry
4.10 Law of Sines and Law of Cosines
4.11 ![]() The Limit Concept Revisited
The Limit Concept Revisited
Chapter 4 Review Exercises
4.1 Angles and Their Measurement
![]() Introduction We begin our study of trigonometry by discussing angles and two methods of measuring them: degrees and radians. As we will see in Section 4.2, it is the radian measure of an angle that enables us to define trigonometric functions on sets of real numbers.
Introduction We begin our study of trigonometry by discussing angles and two methods of measuring them: degrees and radians. As we will see in Section 4.2, it is the radian measure of an angle that enables us to define trigonometric functions on sets of real numbers.
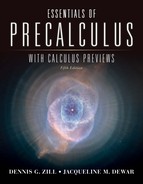
![]() Angles An angle is formed by two rays or half-lines, which have a common end-point called the vertex. We designate one ray the initial side of the angle and the other the terminal side. It is useful to consider the angle as having been formed by a rotation from the initial side to the terminal side, as shown in FIGURE 4.1.1(a). We can place the angle in a Cartesian coordinate plane with its vertex at the origin and its initial side coinciding with the positive x-axis, as shown in Figure 4.1.1(b). We then say the angle is in standard position.
Angles An angle is formed by two rays or half-lines, which have a common end-point called the vertex. We designate one ray the initial side of the angle and the other the terminal side. It is useful to consider the angle as having been formed by a rotation from the initial side to the terminal side, as shown in FIGURE 4.1.1(a). We can place the angle in a Cartesian coordinate plane with its vertex at the origin and its initial side coinciding with the positive x-axis, as shown in Figure 4.1.1(b). We then say the angle is in standard position.
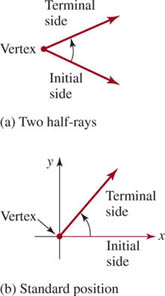
FIGURE 4.1.1 Initial and terminal sides of an angle
![]() Degree Measure The degree measure of an angle is based on the assignment of 360 degrees (written 360°) to the angle formed by one complete counterclockwise rotation, as shown in FIGURE 4.1.2. Other angles are then measured in terms of a 360° angle, with a 1° angle being formed by
Degree Measure The degree measure of an angle is based on the assignment of 360 degrees (written 360°) to the angle formed by one complete counterclockwise rotation, as shown in FIGURE 4.1.2. Other angles are then measured in terms of a 360° angle, with a 1° angle being formed by ![]() of a complete rotation. If the rotation is counterclockwise, the measure will be positive; if clockwise, the measure is negative. For example, the angle in FIGURE 4.1.3(a) obtained by one-fourth of a complete counterclockwise rotation will be
of a complete rotation. If the rotation is counterclockwise, the measure will be positive; if clockwise, the measure is negative. For example, the angle in FIGURE 4.1.3(a) obtained by one-fourth of a complete counterclockwise rotation will be
![]()
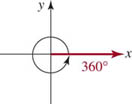
FIGURE 4.1.2 Angle of 360 degrees
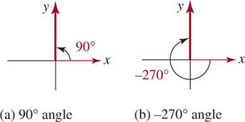
FIGURE 4.1.3 Positive measure in (a); negative measure in (b)
Also shown in Figure 4.1.3(b) is the angle formed by three-fourths of a complete clockwise rotation. This angle has measure
![]()
![]() Coterminal Angles Comparison of Figure 4.1.3(a) with Figure 4.1.3(b) shows that the terminal side of a 90° angle coincides with the terminal side of a −270° angle. When two angles in standard position have the same terminal sides we say they are coterminal. For example, the angles θ, θ + 360°, and θ − 360° shown in FIGURE 4.1.4 are coterminal. In fact, the addition of any integer multiple of 360° to a given angle results in a coterminal angle. Conversely, any two coterminal angles have degree measures that differ by an integer multiple of 360°.
Coterminal Angles Comparison of Figure 4.1.3(a) with Figure 4.1.3(b) shows that the terminal side of a 90° angle coincides with the terminal side of a −270° angle. When two angles in standard position have the same terminal sides we say they are coterminal. For example, the angles θ, θ + 360°, and θ − 360° shown in FIGURE 4.1.4 are coterminal. In fact, the addition of any integer multiple of 360° to a given angle results in a coterminal angle. Conversely, any two coterminal angles have degree measures that differ by an integer multiple of 360°.
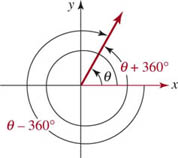
FIGURE 4.1.4 Three coterminal angles
EXAMPLE 1 Angles and Coterminal Angles
For a 960° angle,
(a) Locate the terminal side and sketch the angle.
(b) Find a coterminal angle between 0° and 360°.
(c) Find a coterminal angle between −360° and 0°.
Solution
(a) We first determine how many full rotations are made in forming this angle. Dividing 960 by 360, we obtain a quotient of 2 and a remainder of 240; that is,
![]()
Thus, this angle is formed by making two counterclockwise rotations before completing ![]() of another rotation. As illustrated in FIGURE 4.1.5(a), the terminal side of 960° lies in the third quadrant.
of another rotation. As illustrated in FIGURE 4.1.5(a), the terminal side of 960° lies in the third quadrant.
(b) Figure 4.1.5(b) shows that the angle 240° is coterminal with a 960° angle.
(c) Figure 4.1.5(c) shows that the angle −120° is coterminal with a 960° angle.
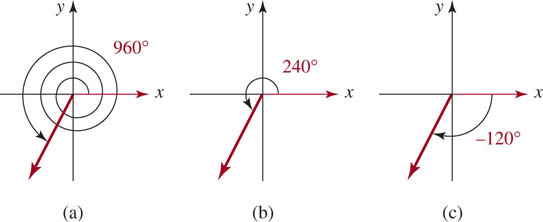
FIGURE 4.1.5 Angles in (b) and (c) are coterminal with the angle in (a)
![]()
![]() Radian Measure For calculus, the most convenient unit of measure for an angle is the radian. The radian measure of an angle is based on the length of an arc of the unit circle
Radian Measure For calculus, the most convenient unit of measure for an angle is the radian. The radian measure of an angle is based on the length of an arc of the unit circle
![]()
As we know, an angle θ in standard position can be viewed as having been formed by the initial side rotating from the positive x-axis to the terminal side. As shown in FIGURE 4.1.6, the initial side of θ traverses a distance t along the circumference of the unit circle. We say that the measure of θ is t radians.
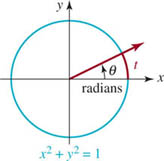
FIGURE 4.1.6 Angle of t radians
In radian measure we have the same convention as with degree measure: an angle formed by a counterclockwise rotation is considered positive, whereas an angle formed by a clockwise rotation is negative. Since the circumference of the unit circle is 2 p, an angle formed by one counterclockwise rotation is 2π radians. In FIGURE 4.1.7 we have illustrated angles of π/2, −π/2, π, and 3π radians, respectively. From Figures 4.1.7(c) and 4.1.7(d) we see that an angle of π radians is coterminal with an angle of 3p radians. In general, the addition of any integer multiple of 2π radians to an angle measured in radians results in a coterminal angle. Conversely, any two coterminal angles measured in radians will differ by an integer multiple of 2π.

FIGURE 4.1.7 Angles measured in radians
EXAMPLE 2 A Coterminal Angle
Find an angle between 0 and 2π radians that is coterminal with θ = 11π/4 radians. Sketch the angle.
Solution Since 2π < 11π /4 < 3π, we subtract the equivalent of one rotation, or 2π radians, to obtain
![]()
Alternatively, we can proceed as in part (a) of Example 1 and divide: 11π/4 = 2π + 3 π/4. Thus, an angle of 3π/4 radians is coterminal with θ, as illustrated in FIGURE 4.1.8.
![]()
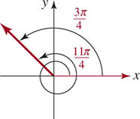
FIGURE 4.1.8 Coterminal angles in Example 2
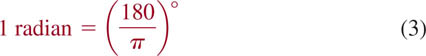
![]() Conversion Formulas While many scientific calculators have keys that convert between degree and radian measure, there is an easy way to remember the relationship between the two measures. Since the circumference of a unit circle is 2π, one complete rotation has measure 2π radians as well as 360°. It follows that 360° = 2π radians or
Conversion Formulas While many scientific calculators have keys that convert between degree and radian measure, there is an easy way to remember the relationship between the two measures. Since the circumference of a unit circle is 2π, one complete rotation has measure 2π radians as well as 360°. It follows that 360° = 2π radians or
![]()
If we interpret (l) as l80(l°) = π (l radian), then we obtain the following two formulas for converting between degree and radian measure.
CONVERSATION BETWEEN DEGREES AND RADIANS
![]()
Using a calculator to carry out the divisions in (2) and (3), we find that
![]()
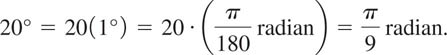
EXAMPLE 3 Conversion Between Degrees and Radians
Convert
(a) 20° to radians, (b) 7π /6 radians to degrees, (c) 2 radians to degrees.
Solution
(a) To convert from degrees to radians we use (2):
(b) To convert from radians to degrees we use (3):

(c) We again use (3):

![]()
The following table provides the radian and degree measure of the most commonly used angles.
TABLE 4.1
![]()
You may recall from geometry that a 90° angle is called a right angle and a 180° angle is called a straight angle. In radian measure, π/2 is a right angle and π is a straight angle. An acute angle has measure between 0° and 90° (or between 0 and π/2 radians), and an obtuse angle has measure between 90° and 180° (or between π/2 and π radians). Two acute angles are said to be complementary if their sum is 90° (or π/2 radians). Two positive angles are supplementary if their sum is 180° (or π radians). A triangle that contains a right angle is called a right triangle. The lengths a, b, and c of the sides of a right triangle satisfy the Pythagorean relationship a2 + b2 = c2, where d is the length of the side opposite the right angle (the hypotenuse).
EXAMPLE 4 Complementary and Supplementary Angles
(a) Find the angle that is complementary to θ = 74.23°.
(b) Find the angle that is supplementary to φ = π/3 radians.
Solution
(a) Since two angles are complementary if their sum is 90°, we find the angle that is complementary to θ = 74.23° is
![]()
(b) Since two angles are supplementary if their sum is π radians, we find the angle that is supplementary to φ = π/3 radians is
![]()
![]()
![]() Arc Length An angle θ with its vertex placed at the center of a circle of radius r is called a central angle. The region inside the circle contained within the central angle θ is called a sector. As shown in FIGURE 4.1.9, the length of the arc of the circle subtended (or cut off) by the angle θ is denoted by s. When measured in radians, the central angle θ corresponds to θ/2π of one complete rotation. Hence the arc subtended by θ is θ/2 π of the circumference of the circle. Therefore the length s of the arc is
Arc Length An angle θ with its vertex placed at the center of a circle of radius r is called a central angle. The region inside the circle contained within the central angle θ is called a sector. As shown in FIGURE 4.1.9, the length of the arc of the circle subtended (or cut off) by the angle θ is denoted by s. When measured in radians, the central angle θ corresponds to θ/2π of one complete rotation. Hence the arc subtended by θ is θ/2 π of the circumference of the circle. Therefore the length s of the arc is

FIGURE 4.1.9 Length of arc s determined by a central angle θ
![]()
provided that θ is measured in radians. We summarize the preceding result.
ARC LENGTH FORMULA
A central angle of θ radians in a circle of radius r subtends an arc of length
![]()
From equation (4) we can express the radian measure θ of a central angle of a circle in terms of the length of subtended arc s and radius r of the circle:
![]()
In equation (5) any convenient unit of length may be used for s and r, but the same unit must be used for both s and r. Thus,
![]()
appears to be a “dimensionless” quantity. This is the reason why sometimes the word radians is omitted when an angle is measured in radians.
EXAMPLE 5 Finding Arc Length
Find the arc length subtended by a central angle of: (a) 2 radians in a circle of radius 6 inches, (b) 30° in a circle of radius 12 feet.
Solution
(a) From the arc length formula (4) with θ = 2 radians and r = 6 inches, we have s = rθ = 2 · 6 = 12. So the arc length is 12 inches.
(b) We must first express 30° in radians. Recall that 30° = π/6 radians. Then from the arc length formula (4) we have s = rθ = (12) (π /6) = 2π. So the arc length is 2π feet.
![]()
From equation (5) it follows that an arc of length r in a circle of radius r will subtend an angle of r/r = 1 radian. FIGURE 4.1.10 illustrates an angle of 1 radian in a circle of radius r. We have already seen from conversion formula (3) that an angle of 1 radian is approximately 57°.
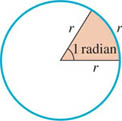
FIGURE 4.1.10 1 radius subtends an angle of 1 radian
![]() Students often apply the arc length formula incorrectly by using degree measure. Remember s = rθ is valid only if θ is measured in radians.
Students often apply the arc length formula incorrectly by using degree measure. Remember s = rθ is valid only if θ is measured in radians.
4.1 Exercises
Answers to selected odd-numbered problems begin on page ANS–12.
In Problems 1–16, draw the given angle in standard position. Bear in mind that the lack of a degree symbol (°) in an angular measurement indicates that the angle is measured in radians.
1. 60°
2. −120°
3. 135°
4. 150°
5. 1140°
6. −315°
7. −240°
8. −210°
9. ![]()
10. ![]()
11. ![]()
12. ![]()
13. ![]()
14. −3π
15. 3
16. 4
In Problems 17–24, convert from degrees to radians.
17. 10°
18. 15°
19. 45°
20. 215°
21. 270°
22. −120°
23. −230°
24. 540°
In Problems 25–32, convert from radians to degrees.
25. ![]()
26. ![]()
27. ![]()
28. ![]()
29. ![]()
30. 7π
31. 3.1
32. 12
In Problems 33–36, for each given angle find a coterminal angle (a) between 0° and 360°, and (b) between −360° and 0°.
33. 875°
34. 400°
35. −610°
36. −150°
In Problems 37–42, for each given angle find a coterminal angle (a) between 0 and 2π radians, and (b) between −2π and 0 radians.
37. ![]()
38. ![]()
39. 5.3π
40. ![]()
41. −4
42. 7.5
In Problems 43–50, find an angle that is (a) complementary and (b) supplementary to the given angle, or state why no such angle can be found.
43. 48.25°
44. 93°
45. 98.4°
46. 63.08°
47. ![]()
48. ![]()
49. ![]()
50. ![]()
51. Find both the degree and the radian measures of the angle formed by (a) three-fifths of a counterclockwise rotation and (b) five and one-eighth clockwise rotations.
52. Find both the degree and the radian measures of the smallest positive angle formed by the hands of a clock (a) at 8:00, (b) at 1:00, and (c) at 7:30.
53.Find both the degree and the radian measures of the angle through which the hour hand on a clock rotates in 2 hours.
54. Answer the question in Problem 53 for the minute hand.
55. The Earth rotates on its axis once every 24 hours. How long does it take the Earth to rotate through an angle of (a) 240° and (b) π/6 radians?
56. The planet Mercury completes one rotation on its axis every 59 days. Through what angle (measured in degrees) does it rotate in (a) 1 day, (b) 1 hour, and (c) 1 minute?
57. Find the arc length subtended by a central angle of 3 radians in a circle of (a) radius 3 and (b) radius 5.
58. Find the arc length subtended by a central angle of 30° in a circle of (a) radius 2 and (b) radius 4.
59. Find the measure of a central angle θ in a circle of radius 5 if θ subtends an arc of length 7.5. Give θ in (a) radians and (b) degrees.
60. Find the measure of a central angle θ in a circle of radius 1 if θ subtends an arc of length π/3. Give θ in (a) radians and (b) degrees.
61. Show that the area a of a sector formed by a central angle of θ radians in a circle of radius r is given by ![]() . [Hint: Use the proportionality property from geometry that the ratio of the area a of a circular sector to the total area πr2 of the circle equals the ratio of the central angle θ to one complete revolution 2π]
. [Hint: Use the proportionality property from geometry that the ratio of the area a of a circular sector to the total area πr2 of the circle equals the ratio of the central angle θ to one complete revolution 2π]
62. What is the area of the red circular band shown in FIGURE 4.1.11 if θ is measured (a) in radians and (b) in degrees? [Hint: Use the result of Problem 61.]
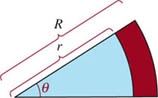
FIGURE 4.1.11 Circular band in Problem 62
In Problems 63 and 64, make the indicated conversions using DMS notation (Degrees, Minutes, Seconds) and the fact that one degree can be divided into 60 equal parts called minutes (written 1° = 60′), and one minute can be divided into 60 equal parts called seconds (written 1′ = 60″). It follows that ![]() and
and ![]() . For example,
. For example, ![]() in decimal degrees.
in decimal degrees.
63. Convert to decimal degrees: (a) 5°10′ (b) 10°25′ (c) 10°39′17″ (d)143°7′2″
64. Convert to degrees, minutes, and seconds: (a) 210.78° (b) 15.45° (c) 30.81° (d) 110.5°
Miscellaneous Applications
65. Navigation at Sea A nautical mile is defined as the arc length subtended on the surface of the Earth by an angle of measure 1 minute. If the diameter of the Earth is 7927 miles, find how many statute (land) miles there are in a nautical mile.
66. Circumference of the Earth Around 230 B.C., Eratosthenes calculated the circumference of the Earth from the following observations. At noon on the longest day of the year, the sun was directly overhead in Syene, while it was inclined 7.2° from the vertical in Alexandria. He believed the two cities to be on the same longitudinal line and assumed that the rays of the sun are parallel. Thus he concluded that the arc from Syene to Alexandria was subtended by a central angle of 7.2° at the center of the Earth. See FIGURE 4.1.12. At that time the distance from Syene to Alexandria was measured as 5000 stades. If one stade = 559 feet, find the circumference of the Earth in (a) stades and (b) miles. Show that Eratosthenes' data gives a result that is within 7% of the correct value if the polar diameter of the Earth is 7900 miles (to the nearest mile).
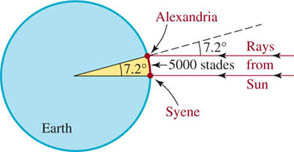
FIGURE 4.1.12 Earth in Problem 66
67. Pendulum clock A clock pendulum is 1.3 M long and swings back and forth along a 15-cm arc. Find (a) the central angle and (b) the area of the sector through which the pendulum sweeps in one swing. [Hint: To answer part (b), use the result of Problem 61.]
68. Circular Motion of a Yo-Yo A yo-yo is whirled around in a circle at the end of its 100-cm string. (a) If it makes 6 revolutions in 4 seconds, find its rate of turning (angular speed) in radians per second. (b) Find the speed at which the yo-yo travels in centimeters per second. (This is called its linear speed.)
69. More Yo-Yos If there is a knot in the yo-yo string described in Problem 68 at a point 40 cm from the yo-yo, find (a) the angular speed of the knot and (b) the linear speed.
70. Circular Motion of a Tire If an automobile with 26-inch diameter tires is traveling at a rate of 55 mph, find (a) the number of revolutions per minute that its tires are making, and (b) the angular speed of its tires in radians per minute.
4.2 The Sine and Cosine Functions
![]() Introduction Originally, the trigonometric functions were defined using angles in right triangles. A more modern approach—one that is used in calculus—is to define the trigonometric functions on sets of real numbers. As we will see, the radian measure for angles is key in making these definitions.
Introduction Originally, the trigonometric functions were defined using angles in right triangles. A more modern approach—one that is used in calculus—is to define the trigonometric functions on sets of real numbers. As we will see, the radian measure for angles is key in making these definitions.
![]() Sine and Cosine For each real number t there corresponds an angle of t radians in standard position. As shown in FIGURE 4.2.1, we denote the point of intersection of the terminal side of the angle t with the unit circle by P(t). The x- and y-coordinates of this point give us the values of the two basic trigonometric functions. The y-coordinate of P(t) is called the sine of t, while the x-coordinate of P(t) is called the cosine of t.
Sine and Cosine For each real number t there corresponds an angle of t radians in standard position. As shown in FIGURE 4.2.1, we denote the point of intersection of the terminal side of the angle t with the unit circle by P(t). The x- and y-coordinates of this point give us the values of the two basic trigonometric functions. The y-coordinate of P(t) is called the sine of t, while the x-coordinate of P(t) is called the cosine of t.
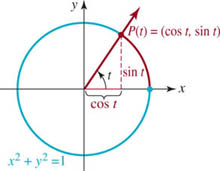
FIGURE 4.2.1 Coordinates of P(t) are (cos t, sin t)
4.2 SINE AND COSINE FUNCTIONS
Let t be any real number and P(t) = (x, y) be the point of intersection of the unit circle with the terminal side of the angle of t radians in standard position. Then the sine of t, denoted sin t, and the cosine of t, denoted cos t, are

Since to each real number t there corresponds a unique point P(t) = (cos t, sin t), we have just defined two functions—the sine and cosine functions—each with domain the set R of real numbers. Because of the role played by the unit circle in this definition, the trigonometric functions are sometimes referred to as the circular functions.
A number of properties of the sine and cosine functions follow from the fact that P(t) = (cos t, sin t) lies on the unit circle. For instance, the coordinates of P(t) must satisfy the equation of the circle:
![]()
Substituting x = cos t and y = sin t gives an important relationship between the sine and the cosine called the Pythagorean identity:
![]()
From now on we will follow two standard practices in writing this identity: (cos t)2 and (sin t)2 will be written as cos 2t and sin2t, respectively, and the sin2t term will be written first.
PYTHAGOREAN IDENTITY
For all real numbers t,
![]()
Again, if P(x, y) denotes a point on the unit circle (3), it follows that the coordinates of P must satisfy the inequalities − 1 ≤ x ≤ 1 and −1 ≤ y ≤ 1. Because x = cos t and y = sin t we have the following bounds on the values of the sine and cosine functions.
BOUNDS ON THE VALUES OF SINE AND COSINE
For all real numbers t,
![]()
The foregoing inequalities can also be expressed as |sin t | ≤ 1 and |cos t | ≤1. Thus, for example, there is no real number t such that ![]() .
.
![]() Domain and Range From the preceding observations we have the sine and cosine functions f(t) = sin t and g(t) = cos t each with domain R the set of real numbers and range the interval [− 1, 1].
Domain and Range From the preceding observations we have the sine and cosine functions f(t) = sin t and g(t) = cos t each with domain R the set of real numbers and range the interval [− 1, 1].
![]() Signs of the Circular Functions The signs of the function values sin t and cos t are determined by the quadrant in which the point P(t) lies, and conversely. For example, if sin t and cos t are both negative, then the point P(t) and terminal side of the corresponding angle of t radians must lie in quadrant III. FIGURE 4.2.2 displays the signs of the cosine and sine functions in each of the four quadrants.
Signs of the Circular Functions The signs of the function values sin t and cos t are determined by the quadrant in which the point P(t) lies, and conversely. For example, if sin t and cos t are both negative, then the point P(t) and terminal side of the corresponding angle of t radians must lie in quadrant III. FIGURE 4.2.2 displays the signs of the cosine and sine functions in each of the four quadrants.

FIGURE 4.2.2 Algebraic signs of sin t and cos t in the four quadrants
EXAMPLE 1 Using the Pythagorean Identity
Given that ![]() and that P(t) is a point in the fourth quadrant, find sin t.
and that P(t) is a point in the fourth quadrant, find sin t.
Solution Substitution of ![]() into the Pythagorean identity (4) gives
into the Pythagorean identity (4) gives ![]() Since sin t is the y-coordinate of P(t), a point in the fourth quadrant, we must take the negative square root for sin t:
Since sin t is the y-coordinate of P(t), a point in the fourth quadrant, we must take the negative square root for sin t:
![]()
![]()
EXAMPLE 2 Sine and Cosine of a Real Number
Use a calculator to approximate sin 3 and cos 3 and give a geometric interpretation of these values.
Solution From a calculator set in radian mode, we obtain cos3 ≈ −0.9899925 and sin3 ≈ 0.1411200. These values represent the x- and y-coordinates, respectively, of the point of intersection of the terminal side of the angle of 3 radians in standard position with the unit circle. As shown in FIGURE 4.2.3, this point lies in the second quadrant because π/2 < 3 < π. This would also be expected in view of Figure 4.2.2 since cos 3, the x-coordinate, is negative and sin 3, the y-coordinate, is positive.
![]()

FIGURE 4.2.3 The point P(3)
![]() Values Corresponding to Unit Circle Intercepts As shown in FIGURE 4.2.4, the x- and y-intercepts of the unit circle give us the values of the sine and cosine functions for the real numbers corresponding to quadrantal angles listed next.
Values Corresponding to Unit Circle Intercepts As shown in FIGURE 4.2.4, the x- and y-intercepts of the unit circle give us the values of the sine and cosine functions for the real numbers corresponding to quadrantal angles listed next.

FIGURE 4.2.4 Sine and cosine for quadrantal angles
VALUES OF THE SINE AND COSINE

![]() Periodicity In Section 4.1 we saw that for any real number t, the angles of t radians and t ± 2π radians are coterminal. Thus they determine the same point (x, y) on the unit circle. Therefore
Periodicity In Section 4.1 we saw that for any real number t, the angles of t radians and t ± 2π radians are coterminal. Thus they determine the same point (x, y) on the unit circle. Therefore
![]()
In other words, the sine and cosine functions repeat their values every 2π units.
PERIODIC FNCTIONS
A nonconstant function f is said to be periodic if there is a positive number p such that
![]()
for every t in the domain of f. If p is the smallest positive number for which (6) is true, then p is called the period of the function f.
The equations in (5) imply that the sine and the cosine functions are periodic with period p ≤ 2π. To see that the period of sin t is actually 2π, we observe that there is only one point on the unit circle with y-coordinate 1, namely, P(π/2) = (cos(π/2), sin(π/2)) = (0, 1). Therefore,
![]()
and so on. Thus the smallest possible positive value of p is 2π.
PERIOD OF THE SINE COSINE
The sine and cosine functions are periodic with period 2π. Therefore,
![]()
for every real number t.
![]() Even–Odd Properties The symmetry of the unit circle endows the circular functions with several additional properties. For any real number t, the points P(t) and P(−t) on the unit circle are located on the terminal side of an angle of t and −t radians, respectively. These two points will always be symmetric with respect to the x-axis. FIGURE 4.2.5 illustrates the situation for a point P(t) lying in the first quadrant: the x-coordinates of the two points are identical; however, the y-coordinates have equal magnitudes but opposite signs. The same symmetries will hold regardless of which quadrant contains P(t). Thus, for any real number t, cos( −t) = cos t and sin( −t) = −sin t. Applying the definitions of even and odd functions from Section 2.2 we have the following result.
Even–Odd Properties The symmetry of the unit circle endows the circular functions with several additional properties. For any real number t, the points P(t) and P(−t) on the unit circle are located on the terminal side of an angle of t and −t radians, respectively. These two points will always be symmetric with respect to the x-axis. FIGURE 4.2.5 illustrates the situation for a point P(t) lying in the first quadrant: the x-coordinates of the two points are identical; however, the y-coordinates have equal magnitudes but opposite signs. The same symmetries will hold regardless of which quadrant contains P(t). Thus, for any real number t, cos( −t) = cos t and sin( −t) = −sin t. Applying the definitions of even and odd functions from Section 2.2 we have the following result.
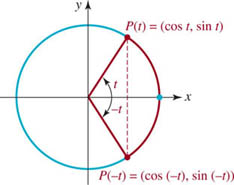
FIGURE 4.2.5 Coordinates of P(t) and P(−t)
EVEN AND ODD FUNCTIONS
The cosine function is even and the sine function is odd. That is, for every real number t,
![]()
The following additional properties of the sine and cosine functions can be verified by considering the symmetries of appropriately chosen points on the unit circle.
ADDITIONAL PROPERTIES

These special properties of the sine and cosine functions become quite useful as soon as we determine additional values for sin t and cos t for t in the interval [0, 2π). Using results from plane geometry we will now find the values of the sine and costine for t = π/6, π/4, and π/3.
![]() Finding sin(π/4) and cost(π/4) We draw an angle of π/4 radians (45°) in standard position and locate and label P (π/4) = (costπ/4, sin π/4) on the unit circle. As shown in FIGURE 4.2.6, we form a right triangle by dropping a perpendicular from P(π/4) to the x-axis. Since the sum of the angles in any triangle is π radians (180°), the third angle of this triangle is also π/4 radians, hence the triangle is isosceles. Therefore the coordinates of P(π/4) are equal; that is, cost(π/4) = sin(π/4). It follows from the Pythagorean identity (4)
Finding sin(π/4) and cost(π/4) We draw an angle of π/4 radians (45°) in standard position and locate and label P (π/4) = (costπ/4, sin π/4) on the unit circle. As shown in FIGURE 4.2.6, we form a right triangle by dropping a perpendicular from P(π/4) to the x-axis. Since the sum of the angles in any triangle is π radians (180°), the third angle of this triangle is also π/4 radians, hence the triangle is isosceles. Therefore the coordinates of P(π/4) are equal; that is, cost(π/4) = sin(π/4). It follows from the Pythagorean identity (4)
![]()
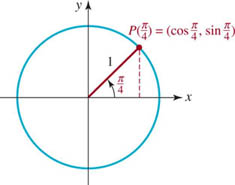
FIGURE 4.2.6 The point P(π/4)
Dividing by 2 and taking the square root, we obtain ![]() . Since P(π/4) lies in the first quadrant, both coordinates must be positive. So we have found the (equal) coordinates of P(π/4):
. Since P(π/4) lies in the first quadrant, both coordinates must be positive. So we have found the (equal) coordinates of P(π/4):
![]()
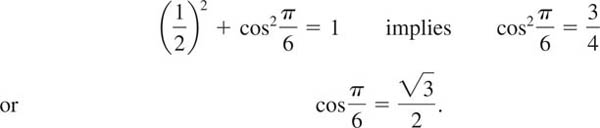
![]() Finding sin(π/6) and cost(π/6) We construct two angles of π/6 radians (30°) in the first and fourth quadrants, as shown in FIGURE 4.2.7, and label the points of intersection with the unit circle P(π/6) and Q, respectively. By drawing perpendicular line segments from P and Q to the x-axis, we obtain two congruent right triangles because each triangle has a hypotenuse of length 1 and angles of 30°, 60°, and 90°. Since the 90° angles form a straight angle, these two right triangles form an equilateral triangle ΔPOQ with sides of length 1. Since sin(π/6) is equal to half of the vertical side of APOQ, we have
Finding sin(π/6) and cost(π/6) We construct two angles of π/6 radians (30°) in the first and fourth quadrants, as shown in FIGURE 4.2.7, and label the points of intersection with the unit circle P(π/6) and Q, respectively. By drawing perpendicular line segments from P and Q to the x-axis, we obtain two congruent right triangles because each triangle has a hypotenuse of length 1 and angles of 30°, 60°, and 90°. Since the 90° angles form a straight angle, these two right triangles form an equilateral triangle ΔPOQ with sides of length 1. Since sin(π/6) is equal to half of the vertical side of APOQ, we have
![]()
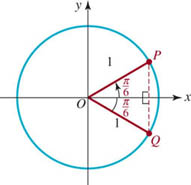
FIGURE 4.2.7 The point P(π/6)
From this result and the Pythagorean identity (4) we find the value of ![]()
![]() Finding sin(π/3) and cos(π/3) We draw angles of π/6 and π/3 in standard position and locate and label the points P(π/6) and P(π/3), as shown in FIGURE 4.2.8. We then construct two congruent 30°-60°-90° triangles by dropping perpendiculars to the x- and y-axes, respectively. It follows from the congruence of these triangles that
Finding sin(π/3) and cos(π/3) We draw angles of π/6 and π/3 in standard position and locate and label the points P(π/6) and P(π/3), as shown in FIGURE 4.2.8. We then construct two congruent 30°-60°-90° triangles by dropping perpendiculars to the x- and y-axes, respectively. It follows from the congruence of these triangles that

![]() We take the positive square root here because P(π/6) lies in the first quadrant.
We take the positive square root here because P(π/6) lies in the first quadrant.
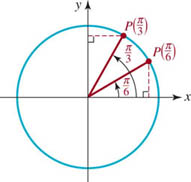
FIGURE 4.2.8 The point P(π/3)
We summarize the values of the sine and cosine functions corresponding to the basic fractions of π that we have determined so far.
VALUES OF THE SINE AND COSINE (CONTINUED)

![]() Reference Angle As we noted at the beginning of this section, for each real number t there is a unique angle of t radians in standard position that determines the point P(t), with coordinates (cos t, sin t), on the unit circle. As shown in FIGURE 4.2.9, the terminal side of any angle of t radians (with P(t) not on an axis) will form an acute angle with the x-axis. We can then locate an angle of t′ radians in the first quadrant that is congruent to this acute angle. The angle of t′ radians is called the reference angle for t. Because of the symmetry of the unit circle, the coordinates of P(t′) will be equal in absolute value to the respective coordinates of P(t). Hence
Reference Angle As we noted at the beginning of this section, for each real number t there is a unique angle of t radians in standard position that determines the point P(t), with coordinates (cos t, sin t), on the unit circle. As shown in FIGURE 4.2.9, the terminal side of any angle of t radians (with P(t) not on an axis) will form an acute angle with the x-axis. We can then locate an angle of t′ radians in the first quadrant that is congruent to this acute angle. The angle of t′ radians is called the reference angle for t. Because of the symmetry of the unit circle, the coordinates of P(t′) will be equal in absolute value to the respective coordinates of P(t). Hence
![]()
As the following examples will show, reference angles can be used to find the trigonometric function values of any integer multiple of π/6, π/4, and π/3.
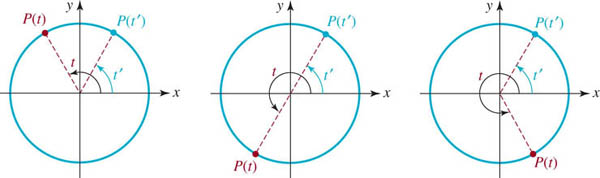
FIGURE 4.2.9 Reference angle t’ is an acute angle
EXAMPLE 3 Using Reference Angles
Find exact values of sin t and cos t for the given real number t:
(a) t = π/3, and (b) t = −3π/4.
Solution In each part we begin by finding the reference angle corresponding to the given value of t.
(a) From FIGURE 4.2.10 we find that an angle of t = 5π/3 radians determines a point P(5π/3) in the fourth quadrant and has the reference angle t′ = π/3 radians. After adjusting the signs of the coordinates of ![]() to obtain the fourth quadrant point
to obtain the fourth quadrant point ![]() , we find that
, we find that


FIGURE 4.2.10 Reference angle in part (a) of Example 3
(b) The point P(−3π/4) lies in the third quadrant and has reference angle π/4, as shown in FIGURE 4.2.11. Therefore,

![]()
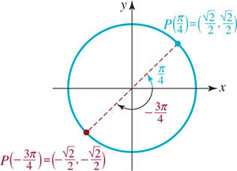
FIGURE 4.2.11 Reference angle in part (b) of Example 3
Sometimes, in order to find the trigonometric values of multiples of our basic fractions of π we must use periodicity or the even-odd function properties in addition to reference numbers.
EXAMPLE 4 Using Periodicity and a Reference Angle
Find exact values of sin t and cos t for t = 29π/6.
Solution Since 29π/6 is greater than 2π, we rewrite 29π/6 as an integer multiple of 2π plus a number less than 2π:
![]()
From the periodicity equations (7) we know that sin(29π/6) = sin(5π/6) and cos(29 π/6) = cos(5π/6). Next we see from FIGURE 4.2.12 that the reference angle for 5π/6 is π/6. Since P(5π/6) is a second quadrant point, we have

![]()
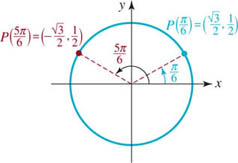
FIGURE 4.2.12 Reference angle in Example 4
EXAMPLE 5 Using the Even-Odd Properties
Find exact values of sin t and cos t for t = −π/6.
Solution Since sine is an odd function and cosine is an even function,

![]()
This problem could also have been solved by using a reference angle.
![]() Trigonometric Functions of Angles In this section we have defined sine and cosine functions of the real number t by using the coordinates of a point P (t) on the unit circle. It is now possible to define the trigonometric functions of any angle θ. For any angle θ, we simply let
Trigonometric Functions of Angles In this section we have defined sine and cosine functions of the real number t by using the coordinates of a point P (t) on the unit circle. It is now possible to define the trigonometric functions of any angle θ. For any angle θ, we simply let
![]()
where the real number t is the radian measure of θ. As mentioned in Section 4.1, it is common to omit the word radians when measuring an angle. So we write sin(π/6) for both the sine of the real number π/6 and for the sine of the angle of π/6 radians. Furthermore, since the values of the trigonometric functions are determined by the coordinates of the point P(t) on the unit circle, it really does not matter whether θ is measured in radians or in degrees. For example, regardless of whether we are given θ = π/6 radians or θ = 30°, the point on the unit circle corresponding to this angle in standard position is ![]() . Thus,
. Thus,
4.2 Exercises
Answers to selected odd-numbered problems begin on page ANS–12.
1. Given that ![]() and that P(t) is a point in the second quadrant, find sin t.
and that P(t) is a point in the second quadrant, find sin t.
2. Given that ![]() and that P(t) is a point in the second quadrant, find cos t.
and that P(t) is a point in the second quadrant, find cos t.
3. Given that ![]() and that P(t) is a point in the third quadrant, find cos t.
and that P(t) is a point in the third quadrant, find cos t.
4. Given that ![]() and that P(t) is a point in the fourth quadrant, find sin t.
and that P(t) is a point in the fourth quadrant, find sin t.
5. If ![]() , find all possible values of cos t.
, find all possible values of cos t.
6. If ![]() , find all possible values of sin t.
, find all possible values of sin t.
7. If cos t = − 0.2, find all possible values of sin t.
8. If sin t = 0.4, find all possible values of cos t.
9. If 2 sin t − cos t = 0, find all possible values of sin t and cos t.
10. If 3 sin t − 2 cos t = 0, find all possible values of sin t and cos t.
In Problems 11–14, find the exact value of (a) sin t and (b) cos t for the given value of t. Do not use a calculator.
11. t = −π/2
12. t = 3π
13. t = 8π
14. t = −3π/2
In Problems 15–26, for the given value of t determine the reference angle t′ and the exact values of sin t and cos t. Do not use a calculator.
15. t = 2π/3
16. t = 4π/3
17. t = 5π/4
18. t = 3π/4
19. t = 11π/6
20. t = 7π/6
21. t = −π/4
22. t = −7π/4
23. t = −5π/6
24. t = − 11π/6
25. t = −5π/3
26. t = −2π/3
In Problems 27–32, find the given trigonometric function value. Do not use a calculator.
27. sin(− 11π/3)
28. cos(17π/6)
29. cos(− 7π/4)
30. sin(−19π/2)
31. cos(5π)
32. sin(−3π/3)
In Problems 33–38, justify the given statement with one of the properties of the trigonometric functions.
33. sin π = sin π
34. cos(π/4) = sin(π/4)
35. sin(−3 − π) = − sin(3 + π)
36. cos 16.8π = cos 14.8π
37. cos 0.43 = cos (−0.43)
38. sin(2π/3) = sin(π/3)
In Problems 39–46, find the given trigonometric function value. Do not use a calculator.
39. sin 135°
40. cos 150°
41. cos 210°
42. sin 270°
43. cos 330°
44. sin(−180°)
45. sin(− 60°)
46. cos(− 300°)
In Problems 47–50, find all angles t, where 0 ≤ t < 2π, that satisfy the given condition.
47. sin t = 0
48. cos t = − 1
49. ![]()
50. ![]()
In Problems 51–54, find all angles θ, where 0° ≤ θ < 360°, that satisfy the given condition.
51. ![]()
52. ![]()
53. ![]()
54. cos θ = 1
Miscellaneous Applications
55. Free Throw Under certain conditions the maximum height y attained by a basketball released from a height h at an angle α measured from the horizontal with an initial velocity v0 is given by y = h + (v02sin2α), where g is the acceleration due to gravity. Compute the maximum height reached by a free throw if h = 2.15 m, v0 = 8 m/s, α = 64.47°, and g = 9.81 m/s2.

Free throw
56. Putting the Shot The range of a shot put released from a height h above the ground with an initial velocity v0 at an angle α to the horizontal can be approximated by
![]()
where g is the acceleration due to gravity. If v0 = 13.7 m/s, α = 40°, and g = 9.81 m/s2, compare the ranges achieved for the release heights (a) h = 2.0 M and (b) h = 2.4 m. (c) Explain why an increase in h yields an increase in R if the other parameters are held fixed. (d) What does this imply about the advantage that height gives a shot-putter?
57. Acceleration Due to Gravity Because of its rotation, the Earth bulges at the equator and is flattened at the poles. As a result, the acceleration due to gravity is not a constant 980 cm/s2, but varies with latitude θ. Satellite studies have shown that the acceleration due to gravity gsat is approximated by the function
![]()
(a) Find gsat at the equator (θ = 0°), (b) at the North Pole, and (c) at 45° north latitude.
For Discussion
58. Discuss how it is possible to determine without a calculator that the point P(6) = (cos6, sin6) lies in the fourth quadrant.
59. Discuss how it is possible to determine without the aid of a calculator that both sin4 and cos4 are negative.
60. Is there a real number t satisfying 3 sin t = 5? Explain why or why not.
61. Is there an angle θ satisfying cos θ = −2? Explain why or why not.
4.3 Graphs of Sine and Cosine Functions
![]() Introduction One way to further your understanding of the trigonometric functions is to examine their graphs. In this section we consider the graphs of the sine and cosine functions.
Introduction One way to further your understanding of the trigonometric functions is to examine their graphs. In this section we consider the graphs of the sine and cosine functions.
![]() Graphs of Sine and Cosine In Section 4.2 we saw that the domain of the sine function f(t) = sin t is the set of real numbers (− ∞, ∞) and the interval [−1, 1] is its range. Since the sine function has period 2π, we begin by sketching its graph on the interval [0, 2π]. We obtain a rough sketch of the graph given in FIGURE 4.3.1(b) by considering various positions of the point P(t) on the unit circle, as shown in Figure 4.3.1(a). As t varies from 0 to π/2, the value sin t increases from 0 to its maximum value 1. But as t varies from π/2 to 3π/2, the value sin t decreases from 1 to its minimum value − 1. We note that sin t changes from positive to negative at t = π. For t between 3π/2 and 2π, we see that the corresponding values of sin t increase from − 1 to 0. The graph of any periodic function over an interval of length equal to its period is said to be one cycle of its graph. In the case of the sine function, the graph over the interval [0, 2 π]in Figure 4.3.1(b) is one cycle of the graph of f(t) = sin t.
Graphs of Sine and Cosine In Section 4.2 we saw that the domain of the sine function f(t) = sin t is the set of real numbers (− ∞, ∞) and the interval [−1, 1] is its range. Since the sine function has period 2π, we begin by sketching its graph on the interval [0, 2π]. We obtain a rough sketch of the graph given in FIGURE 4.3.1(b) by considering various positions of the point P(t) on the unit circle, as shown in Figure 4.3.1(a). As t varies from 0 to π/2, the value sin t increases from 0 to its maximum value 1. But as t varies from π/2 to 3π/2, the value sin t decreases from 1 to its minimum value − 1. We note that sin t changes from positive to negative at t = π. For t between 3π/2 and 2π, we see that the corresponding values of sin t increase from − 1 to 0. The graph of any periodic function over an interval of length equal to its period is said to be one cycle of its graph. In the case of the sine function, the graph over the interval [0, 2 π]in Figure 4.3.1(b) is one cycle of the graph of f(t) = sin t.

FIGURE 4.3.1 Points P(t) on a circle corresponding to points on the graph
From this point on we will revert to the traditional symbols x and y when graphing trigonometric functions. Thus, f(t) = sin t will either be written f(x) = sin x or simply y = sin x.
The graph of a periodic function is easily obtained by repeatedly drawing one cycle of its graph. In other words, the graph of y = sin x on, say, the intervals [−2π, 0] and [2π, 4π] is the same as that given in Figure 4.3.1(b). Recall from Section 4.2 that the sine function is an odd function since f(−x) = sin(−x) = −sin x = −f(x). Thus, as can be seen in FIGURE 4.3.2, the graph of y = sin x is symmetric with respect to the origin.
![]() Note
Note
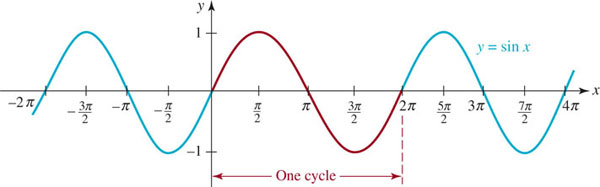
FIGURE 4.3.2 Graph of y = sin x
By working again with the unit circle we can obtain one cycle of the graph of the cosine function g(x) = cos x on the interval [0, 2π]. In contrast to the graph of f(x) = sin x where f(0) = f(2π) = 0, for the cosine function we have g(0) = g(2π) = 1. FIGURE 4.3.3 shows one cycle (in red) of y = cos x on [0, 2π], along with the extension of that cycle (in blue) to the adjacent intervals [−2π, 0] and [2π, 4π]. We see from this figure that the graph of the cosine function is symmetric with respect to the y-axis. This is a consequence of g being an even function: g(−x) = cos(−x) = cos x = g(x).

FIGURE 4.3.3 Graph of y = cos x
![]() Intercepts In this and subsequent courses in mathematics it is important that you know the x-coordinates of the x-intercepts of the sine and cosine graphs—in other words, the zeros of f(x) = sin x and g(x) = cos x. From the sine graph in Figure 4.3.2, we see that the zeros of the sine function, or the numbers for which sin x = 0, are x = 0, ±π, ±2π, ±3π,…. These numbers are integer multiples of π. From the cosine graph in Figure 4.3.3, we see that cos x = 0 when x = ±π/2, ±3π/2, ±5π/2, …. These numbers are odd-integer multiples of π/2.
Intercepts In this and subsequent courses in mathematics it is important that you know the x-coordinates of the x-intercepts of the sine and cosine graphs—in other words, the zeros of f(x) = sin x and g(x) = cos x. From the sine graph in Figure 4.3.2, we see that the zeros of the sine function, or the numbers for which sin x = 0, are x = 0, ±π, ±2π, ±3π,…. These numbers are integer multiples of π. From the cosine graph in Figure 4.3.3, we see that cos x = 0 when x = ±π/2, ±3π/2, ±5π/2, …. These numbers are odd-integer multiples of π/2.
If n represents an integer, then 2n + 1 is an odd integer. Therefore the zeros of f(x) = sin x and g(x) = cos x can be written in a compact form.
ZEROS OF THE SINE AND COSINE FUNCTIONS
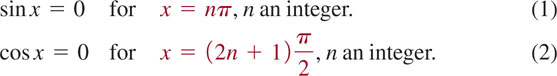
Using the distributive law, the result in (2) is often written as x = π/2 + nπ.
As we did in Chapters 2 and 3, we can obtain variations of the basic sine and cosine graphs through rigid and nonrigid transformations. For the remainder of the discussion we will consider graphs of functions of the form
![]()
where A, B, C, and D are real constants.
![]() Graphs of y = A sin x + D and y = A cos x + D We begin by considering the special cases of (3):
Graphs of y = A sin x + D and y = A cos x + D We begin by considering the special cases of (3):
![]()
For A > 0, graphs of these functions are either a vertical stretch or a vertical compression of the graphs of y = sin x or y = cos x. For A < 0, the graphs are also reflected in the x-axis. For example, as FIGURE 4.3.4 shows, we obtain the graph of y = 2sin x by stretching the graph of y = sin x vertically by a factor of 2. Note that the maximum and minimum values of y = 2 sin x occur at the same x-values as the maximum and minimum values of y = sin x. In general, the maximum distance from any point on the graph of y = A sin x or y = A cos x to the x-axis is | A |. The number | A | is called the amplitude of the functions or of their graphs. The amplitude of the basic functions y = sin x and y = cos x is | A | = 1. In general, if a periodic function f is continuous, then over a closed interval of length equal to its period, f has both a maximum value M and a minimum value m. The amplitude is defined by
![]()
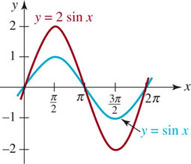
FIGURE 4.3.4 Vertical stretch of y = sin x
EXAMPLE 1 Vertically Compressed Cosine Graph
Graph ![]()
Solution The graph of ![]() is the graph of y = cos x compressed vertically by a factor of
is the graph of y = cos x compressed vertically by a factor of ![]() nd then reflected in the x-axis. With the identification
nd then reflected in the x-axis. With the identification ![]() , we see that the amplitude of the function is
, we see that the amplitude of the function is ![]() . The graph
. The graph ![]() on the interval [0, 2 π] is shown in red in FIGURE 4.3.5.
on the interval [0, 2 π] is shown in red in FIGURE 4.3.5.
![]()
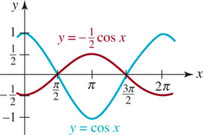
FIGURE 4.3.5 Graph of function in Example 1
The graphs of
![]()
are the graphs of y = A sin x and y = A cos x shifted vertically, up for D > 0 and down for D < 0. For example, the graph of y = 1 + 2sin x is the graph of y = 2sin x (Figure 4.3.4) shifted up 1 unit. The amplitude of the graph of either y = A sin x + D or y = A cos x + D is still | A |. Note that in FIGURE 4.3.6, the maximum of y = 1 + 2 sin x is y = 3 at x = π/2 and the minimum is y = −1 at x = 3π/2. From (4), the amplitude of y = 1 + 2 sin x is then ![]() .
.
By interpreting x as a placeholder in (1) and (2), we can find the x-coordinates of the x-intercepts of the graphs of sine and cosine functions of the form y = A sin Bx and y = A cos Bx. (We consider this next.) For example, to solve sin 2x = 0, we have from (1)
![]()
that is, ![]() , and so on. See FIGURE 4.3.7.
, and so on. See FIGURE 4.3.7.
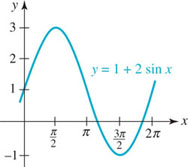
FIGURE 4.3.6 Graph of y = 2 sin x shifted up 1 unit
![]() Graphs of y = A sin Bx and y = A cos Bx We now consider the graph of y = sin Bx for B > 0. The function has amplitude 1 since A = 1. Because the period of y = sin x is 2π, a cycle of the graph of y = sin Bx begins at x = 0 and will start to repeat its values when Bx = 2π. In other words, a cycle of the function y = sin Bx is completed on the interval defined by 0 ≤ Bx ≤ 2π. Dividing the last inequality by B shows that the period of the function y = sin Bx is 2π/B and that the graph over the interval [0, 2π/B] is one cycle of its graph. For example, the period of y = sin 2x is 2π/2 = π, and therefore one cycle of the graph is completed on the interval [0, π]. Figure 4.3.7 shows that two cycles of the graph of y = sin 2x (in red and blue) are completed on the interval [0, 2π], whereas the graph of y = sin x (in green) has completed only one cycle. In terms of transformations, we can characterize the cycle of y = sin 2x on [0, π] as a horizontal compression of the cycle of y = sin x on [0, 2π].
Graphs of y = A sin Bx and y = A cos Bx We now consider the graph of y = sin Bx for B > 0. The function has amplitude 1 since A = 1. Because the period of y = sin x is 2π, a cycle of the graph of y = sin Bx begins at x = 0 and will start to repeat its values when Bx = 2π. In other words, a cycle of the function y = sin Bx is completed on the interval defined by 0 ≤ Bx ≤ 2π. Dividing the last inequality by B shows that the period of the function y = sin Bx is 2π/B and that the graph over the interval [0, 2π/B] is one cycle of its graph. For example, the period of y = sin 2x is 2π/2 = π, and therefore one cycle of the graph is completed on the interval [0, π]. Figure 4.3.7 shows that two cycles of the graph of y = sin 2x (in red and blue) are completed on the interval [0, 2π], whereas the graph of y = sin x (in green) has completed only one cycle. In terms of transformations, we can characterize the cycle of y = sin 2x on [0, π] as a horizontal compression of the cycle of y = sin x on [0, 2π].
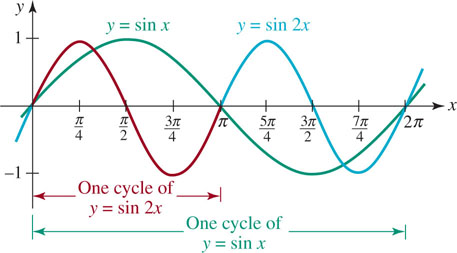
FIGURE 4.3.7 Comparison of the graphs of y = sin x and y = sin 2x
In summary, the graphs of
![]()
for B > 0 each have amplitude |A| and period 2π/B.
![]() Be careful here: sin 2x ≠ 2 sin x
Be careful here: sin 2x ≠ 2 sin x
EXAMPLE 2 Horizontally Compressed Cosine Graph
Find the period of y = cos4x and graph the function.
Solution Since B = 4, we see that the period of y = cos4x is 2π/4 = π/2. We conclude that the graph of y = cos4x is the graph of y = cos x compressed horizontally. To graph the function, we draw one cycle of the cosine graph with amplitude 1 on the interval [0, π/2] and then use periodicity to extend the graph. FIGURE 4.3.8 shows four complete cycles of y = cos4x (the basic cycle in red and the extended graph in blue) and one cycle of y = cos x (in green) on [0, 2π]. Notice that y = cos4x attains its minimum at x = π/4 since cos4(π/4) = cos π = −1, and attains its maximum at x = π/2 since cos4(π/2) = cos 2π =1.
![]()
If B < 0 in either y = A sin Bx or y = A cos Bx, we can use the even/odd properties (see (8) of Section 4.2) to rewrite the function with positive B. This is illustrated in the next example.

FIGURE 4.3.8 Graph of function in Example 2
EXAMPLE 3 Horizontally Stretched Sine Graph
Find the amplitude and period of ![]() . Graph the function.
. Graph the function.
Solution Since we require B > 0, we use sin(−x) = −sin x to rewrite the function as
![]()
With the identification A = − 1, the amplitude is seen to be | A | = | − 1| = 1. Now with ![]() , we find that the period is
, we find that the period is ![]() . Hence we can interpret the cycle of
. Hence we can interpret the cycle of ![]() on [0, 4 π] as a horizontal stretch and a reflection (in the x-axis because A < 0) of the cycle of y = sin x on [0, 2π]. FIGURE 4.3.9 shows that on the interval [0, 4 π], the graph of
on [0, 4 π] as a horizontal stretch and a reflection (in the x-axis because A < 0) of the cycle of y = sin x on [0, 2π]. FIGURE 4.3.9 shows that on the interval [0, 4 π], the graph of ![]() (in blue) completes one cycle, whereas the graph of y = sin x (in green) completes two cycles.
(in blue) completes one cycle, whereas the graph of y = sin x (in green) completes two cycles.
![]()

FIGURE 4.3.9 Graph of function in Example 3
![]() Graphs of y = A sin(Bx + C) and y = A cos(Bx + C) We have seen that the basic graphs of y = sin x and y = cos x can be stretched or compressed vertically (y = A sin x and y = A cos x), shifted vertically (y = A sin x + D and y = A cos x + D), and stretched or compressed horizontally (y = A sin Bx + D and y = A cos Bx + D). The graphs of
Graphs of y = A sin(Bx + C) and y = A cos(Bx + C) We have seen that the basic graphs of y = sin x and y = cos x can be stretched or compressed vertically (y = A sin x and y = A cos x), shifted vertically (y = A sin x + D and y = A cos x + D), and stretched or compressed horizontally (y = A sin Bx + D and y = A cos Bx + D). The graphs of
![]()
are the graphs of y = A sin Bx + D and y = A cos Bx + D shifted horizontally.
In the remaining discussion we focus on the graphs of y = A sin (Bx + C) and y = A cos (Bx + C). For example, we know from Section 2.2 that the graph of y = cos(x − π/2) is the basic cosine graph shifted to the right. In FIGURE 4.3.10, the graph of y = cos (x − π/2) (in red) on the interval [0, 2π] is one cycle of y = cos x on the interval [−π/2, 3π/2] (in blue) shifted horizontally π/2 units to the right. Similarly, the graphs of y = sin(x + π/2) and y = sin(x − π/2) are the basic sine graphs shifted π/2 units to the left and to the right, respectively. See FIGURES 4.3.11 and 4.3.12.

FIGURE 4.3.10 Horizontally shifted cosine graph
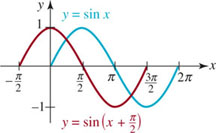
FIGURE 4.3.11 Horizontally shifted sine graph

FIGURE 4.3.12 Horizontally shifted sine graph
By comparing the red graphs in Figures 4.3.10–4.3.12 with the graphs in Figures 4.3.2 and 4.3.3 we see that
- the cosine graph shifted π/2 units to the right is the sine graph,
- the sine graph shifted π/2 units to the left is the cosine graph, and
- the sine graph shifted π/2 units to the right is the cosine graph reflected in the x-axis.
In other words, we have graphically verified the identities
![]()
We now consider the graph of y = A sin (Bx + C) for B > 0. Since the values of sin(Bx + C) range from −1 to 1, it follows that A sin (Bx + C) varies between − A and A. That is, the amplitude of y = A sin (Bx + C) is | A |. Also, as Bx + C varies from 0 to 2π, the graph will complete one cycle. By solving Bx + C = 0 and Bx + C = 2π, we find that one cycle is completed as x varies from −C/B to (2π − C)/B. Therefore, the function y = A sin (Bx + C) has the period
![]()
Moreover, if f (x) = A sin Bx, then

The result in (6) shows that the graph of y = A sin(Bx + C) can be obtained by shifting the graph of f(x) = A sin Bx horizontally A distance |C|/B. If C < 0 the shift is to the right, whereas if C > 0 the shift is to the left. The number |C|/B is called the phase shift of the graph of y = A sin(Bx + C).
EXAMPLE 4 Equation of a Shifted Cosine Graph
The graph of y = 10 cos 4x is shifted π/12 units to the right. Find its equation.
Solution By writing f(x) = 10 cos 4x and using (6), we find

In the last equation we would identify C = −π/3. The phase shift is π/12.
![]()
As a practical matter the phase shift of y = A sin (Bx + C) can be obtained by factoring the number B from Bx + C:
![]()
For convenience we summarize the preceding information.
SHIFTED SINE AND COSINE GRAPHS
The graphs of
![]()
are, respectively, the graphs of y = A sin Bx and y = A cos Bx shifted horizontally by |C| / B. The shift is to the right if C < 0 and to the left if C > 0. The number |C| / B is called the phase shift. The amplitude of each graph is |A| and the period of each graph is 2π/B.
![]() Note
Note
EXAMPLE 5 Horizontally Shifted Sine Graph
Graph y = 3 sin(2x − π/3).
Solution For purposes of comparison we will first graph y = 3 sin 2x. The amplitude of y = 3sin 2x is | A | =3 and its period is 2π/2 = π. Thus one cycle of y = 3 sin 2x is completed on the interval [0, π]. Then we extend this graph to the adjacent interval [π, 2 π], as shown in blue in FIGURE 4.3.13. Next, we rewrite y = 3sin(2x − π/3) by factoring 2 from 2x − π/3:
![]()
From the last form we see that the phase shift is π/6. The graph of the given function, shown in red in Figure 4.3.13, is obtained by shifting the graph of y = 3 sin 2x to the right π/6 units. Remember, this means that if (x, y) is a point on the blue graph, then (x + π/6, y) is the corresponding point on the red graph. For example, x = 0 and x = π are the x-coordinates of two x-intercepts of the blue graph. Thus x = 0 + π/6 = π/6 and x = 0 + π/6 = 7π/6 are x-coordinates of the x-intercepts of the red or shifted graph. These numbers are indicated by the arrows in Figure 4.3.13.
![]()

FIGURE 4.3.13 Graph of function in Example 5
EXAMPLE 6 Horizontally Shifted Graphs
Determine the amplitude, period, phase shift, and direction of horizontal shift for each of the following functions.
(a) ![]()
(b) ![]()
Solution
(a) We first make the identifications A = 15, B = 5,and C = − 3π/2. Thus the amplitude is | A | = 15 and the period is 2π/B = 2π/5. The phase shift can be computed either by (|−3π|/2)/5 = 3π/10 or by rewriting the function as
![]()
The last form indicates that the graph of y = 15cos(5x − 3π/2)is the graph of y = 15 cos5x shifted 3π/10 units to the right.
(b) Since A = −8, the amplitude is |A| = |−8| = 8. With B = 2 the period is 2π/2 = π. By factoring 2 from 2x + π/4, we see from

that the phase shift is π/8. The graph of y = − 8sin(2x + π/4) is the graph of y = − 8 sin 2x shifted π/8 units to the left.
![]()
EXAMPLE 7 Horizontally Shifted Cosine Graph
Graph y = 2cos(πx + π).
Solution The amplitude of y = 2cos πx is |A| = 2 and the period is 2π/π = 2. Thus one cycle of y = 2cos π x is completed on the interval [0, 2]. In FIGURE 4.3.14, two cycles of the graph of y = 2cos π x (in blue) are shown. The x-intercepts of this graph correspond to the values of x for which cos π x = 0. By (2), this implies π x = (2n + 1)π/2 or x = (2n + 1)/2, n an integer. In other words, for n = 0, −1, 1, −2, 2, − 3,…, we get ![]() , and so on. Now by rewriting the given function as
, and so on. Now by rewriting the given function as
![]()
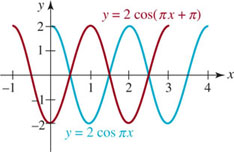
FIGURE 4.3.14 Graph of function in Example 7
we see the phase shift is 1. The graph of y = 2cos (πx + π) (in red) in Figure 4.3.14 is obtained by shifting the graph of y = 2 cos π x to the left 1 unit. This means that the x-intercepts are the same for both graphs.
![]()
EXAMPLE 8 Alternating Current
The current I (in amperes) in a wire of an alternating-current circuit is given by I(t) = 30 sin 120πt, where t is time measured in seconds. Sketch one cycle of the graph. What is the maximum value of the current?
Solution The graph has amplitude 30 and period ![]() . Therefore, we sketch one cycle of the basic sine curve on the interval
. Therefore, we sketch one cycle of the basic sine curve on the interval ![]() , as shown in FIGURE 4.3.15. From the figure it is evident that the maximum value of the current is I = 30 amperes and occurs
, as shown in FIGURE 4.3.15. From the figure it is evident that the maximum value of the current is I = 30 amperes and occurs ![]() second since
second since
![]()
![]()

FIGURE 4.3.15 Graph of current in Example 8
4.3 Exercises
Answers to selected odd-numbered problems begin on page ANS–12.
In Problems 1–6, use the techniques of shifting, stretching, compressing, and reflecting to sketch at least one cycle of the graph of the given function.
1. ![]()
2. y = −1 + cos x
3. y = 2 − sin x
4. y = 3 + 3 sin x
5. y = − 2 + 4cos x
6. y = 1 − 2sin x
In Problems 7–10, the given figure shows one cycle of a sine or cosine graph. From the figure, determine A and D and write an equation of the form y = A sin x + D or y = A cos x + D for the graph.
7. 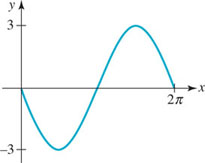
FIGURE 4.3.16 Graph for Problem 7
8. 
FIGURE 4.3.17 Graph for Problem 8
9. 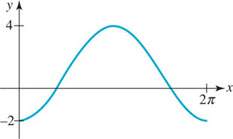
FIGURE 4.3.18 Graph for Problem 9
10. 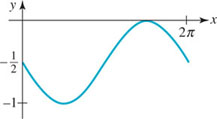
FIGURE 4.3.19 Graph for Problem 10
In Problems 11–16, use (1) and (2) of Section 4.3 to find the x-intercepts for the graph of the given function. Do not graph.
11. y = sin πx
12. y = −cos 2x
13. ![]()
14. y = 3sin(−5x)
15. ![]()
16. y = cos(2x − π)
In Problems 17 and 18, find the x-intercepts of the graph of the given function on the interval [0, 2π]. Then find all intercepts using periodicity.
17. y = −1 + sin x
18. y = 1 − 2cos x
In Problems 19–24, the given figure shows one cycle of a sine or cosine graph. From the figure, determine A and B and write an equation of the form y = A sin Bx or y = A cos Bx for the graph.
19. 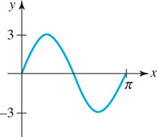
FIGURE 4.3.20 Graph for Problem 19
20. 
FIGURE 4.3.21 Graph for Problem 20
21. 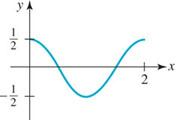
FIGURE 4.3.22 Graph for Problem 21
22. 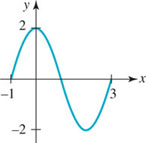
FIGURE 4.3.23 Graph for Problem 22
23. 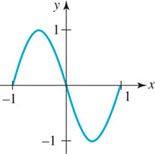
FIGURE 4.3.24 Graph for Problem 23
24. 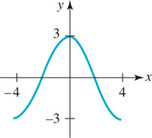
FIGURE 4.3.25 Graph for Problem 24
In Problems 25–32, find the amplitude and period of the given function. Sketch at least one cycle of the graph.
25. y = 4sin πx
26. ![]()
27. y = − 3cos 2πx
28. ![]()
29. y = 2 − 4 sin x
30. y = 2 − 2 sin πx
31. ![]()
32. ![]()
In Problems 33–42, find the amplitude, period, and phase shift of the given function. Sketch at least one cycle of the graph.
33. ![]()
34. ![]()
35. ![]()
36. ![]()
37. ![]()
38. ![]()
39. ![]()
40. ![]()
41. ![]()
42. ![]()
In Problems 43 and 44, write an equation of the function whose graph is described in words.
43. The graph of y = cos x is vertically stretched up by a factor of 3 and shifted down by 5 units. One cycle of y = cos x on [0, 2 π]compressed to [0, π/3] and then the compressed cycle is shifted horizontally π/4 units to the left.
44. One cycle of y = sin x on [0, 2π] is stretched to [0,8π] and then the stretched cycle is shifted horizontally π/12 units to the right. The graph is also compressed vertically by a factor of ![]() and then reflected in the x-axis.
and then reflected in the x-axis.
In Problems 45–48, find horizontally shifted sine and cosine functions so that each function satisfies the given conditions. Graph the functions.
45. Amplitude 3, period 2π/3, shifted by π/3 units to the right
46. Amplitude ![]() , period π, shifted by π/4 units to the left
, period π, shifted by π/4 units to the left
47. Amplitude 0.7, period 0.5, shifted by 4 units to the right
48. Amplitude ![]() , period 4, shifted by 1/2π units to the left
, period 4, shifted by 1/2π units to the left
In Problems 49 and 50, graphically verify the given identity.
49. cos(x + π) = −cos x
50. sin(x + π) = −sin x
Miscellaneous Applications
51. Pendulum The angular displacement θ of a pendulum from the vertical at time t seconds is given by θ (t) = θ0 cos ωt, where θ0 is the initial displacement at t = 0 seconds. See FIGURE 4.3.26. For ω = 2 rad/s and θ0 = π/10, sketch two cycles of the resulting function.

FIGURE 4.3.26 Pendulum in Problem 51
52. Current In a certain kind of electrical circuit, the current I measured in amperes at time t seconds is given by
![]()
Sketch two cycles of the graph of I as a function of time t.
53. Depth of Water The depth d of water at the entrance to a small harbor at time t is modeled by a function of the form
![]()
where A is one-half the difference between the high- and low-tide depths; 2π/B, B > 0, is the tidal period; and C is the average depth. Assume that the tidal period is 12 hours, the depth at high tide is 18 feet, and the depth at low tide is 6 feet. Sketch two cycles of the graph of d.
54. Fahrenheit Temperature Suppose that
![]()
0 ≤ t ≤ 24, is a mathematical model of the Fahrenheit temperature at t hours after midnight on a certain day of the week.
(a) What is the temperature at 8 A.M.?
(b) At what time(s) does T(t) = 60?
(c) Sketch the graph of T.
(d) Find the maximum and minimum temperatures and the times at which they occur.
Calculator Problems
In Problems 55–58, use a calculator to investigate whether the given function is periodic.
55. ![]()
56. ![]()
57. f(x) = 1 + (cos x)2
58. f(x) = x sin x
For Discussion
In Problems 59 and 60, find the period of the given function.
59. ![]()
60. ![]()
In Problems 61 and 62, discuss and then sketch the graph of the given function.
61. f(x) = | sin x |
62. f(x) = | cos x |
4.4 Other Trigonometric Functions
![]() Introduction Four additional trigonometric functions are defined in terms of reciprocals and quotients of the sine and cosine functions. In this section we consider the properties and graphs of these new functions.
Introduction Four additional trigonometric functions are defined in terms of reciprocals and quotients of the sine and cosine functions. In this section we consider the properties and graphs of these new functions.
We begin with a definition.
TANGENT, COTANGENT, SECANT, COSECANT FUNCTIONS
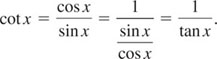
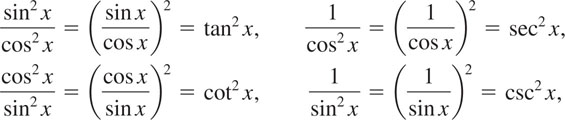
The tangent, cotangent, secant, and cosecant functions are denoted by tan x, cot x, sec x, and csc x, respectively, and are defined as follows:
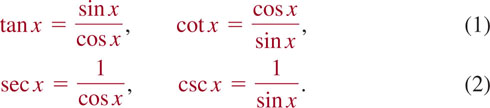
Note that the tangent and cotangent functions are related by
In view of the definitions in (2) and the foregoing result, cot x, sec x, and csc x are referred to as the reciprocal functions.
![]() Domain and Range Because the functions in (1) and (2) are quotients, the domain of each function consists of the set of real numbers except those numbers for which the denominator is zero. We have seen in (2) of Section 4.3 that cos x = 0 for x = (2n + 1)π/2, n = 0, ±1,±2,…, and so
Domain and Range Because the functions in (1) and (2) are quotients, the domain of each function consists of the set of real numbers except those numbers for which the denominator is zero. We have seen in (2) of Section 4.3 that cos x = 0 for x = (2n + 1)π/2, n = 0, ±1,±2,…, and so
- the domain of tan x and of sec x is {x | x ≠ (2n + 1)π/2, n = 0, ±1, ±2,… }.
Similarly, from (1) of Section 4.3, sin x = 0 for x = nπ, n = 0,±1,±2,…, and so it follows that
- the domain of cot x and of csc x is |x| x + nπ, n = 0, ±1, ±2,…).
We know that the values of the sine and cosine are bounded, that is, | sin x | ≤ 1 and | cos x| ≤ 1. From these last inequalities we have

Recall that an inequality such as (3) means that sec x ≥ 1 or sec x ≤ − 1. Hence the range of the secant function is (− ∞, −1] ∪ [1, ∞). The inequality in (4) implies that the cosecant function has the same range (− ∞, − 1] ∪ [1, ∞). When we consider the graphs of the tangent and cotangent functions we will see that they have the same range: (− ∞, ∞).
If we interpret x as an angle, then FIGURE 4.4.1 illustrates the algebraic signs of the tangent, cotangent, secant, and cosecant functions in each of the four quadrants. This is easily verified using the signs of the sine and cosine functions displayed in Figure 4.2.2.
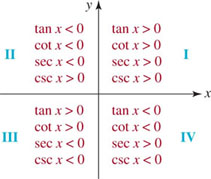
FIGURE 4.4.1 Signs of tan x, cot x, sec x, and csc x in the four quadrants
EXAMPLE 1 Example 5 of Section 4.2 Revisited
Find tan x, cot x, sec x, and csc x for x = −π/6.
Solution In Example 5 of Section 4.2 we saw that

Therefore, by the definitions in (1) and (2):

![]()
TABLE 4.2
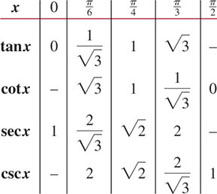
Table 4.2 summarizes some important values of the tangent, cotangent, secant, and cosecant and was constructed using values of the sine and cosine from Section 4.2. A dash in the table indicates that the trigonometric function is not defined at that particular value of x.
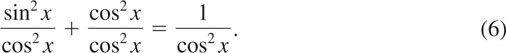
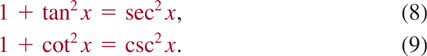
![]() Pythagorean Identities The tangent is related to the secant by a useful identity. If we divide the Pythagorean identity
Pythagorean Identities The tangent is related to the secant by a useful identity. If we divide the Pythagorean identity
![]()
by cos2 x, we see that
Similarly, dividing (5) by sin2 x gives

Using the laws of exponents,
(6) and (7) can be written in a simpler manner. These results summarized next are also known as Pythagorean identities.
PYTHAGOREAN IDENTITIES (CONTINUED)
For every real number x for which the functions are defined,
![]() We could also use cot x = 1/tan x
We could also use cot x = 1/tan x
EXAMPLE 2 Using a Pythagorean Identity
Given that csc x = −5and 3π/2 < x < 2π, determine the values of tan x and cot x.
Solution We first compute cot x. It follows from (9) that
![]()
For 3π/2 < x < 2π, we see from Figure 4.4.1 that cot x must be negative and so we take the negative square root:
![]()
Using cot x = 1/tan x, we have
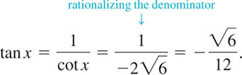
![]()
In Example 2, given the information csc x = −5 and 3π/2 < x < 2π, we could easily find the values of the remaining five trigonometric functions. One way of proceeding would be to use csc x = 1/sin x to find sin x = 1/csc ![]() . Then we use sin2 x + cos2 x = 1 to find cos x. After we have found cos x, the remaining three trigonometric functions can be obtained from (1) and (2).
. Then we use sin2 x + cos2 x = 1 to find cos x. After we have found cos x, the remaining three trigonometric functions can be obtained from (1) and (2).
![]() Periodicity Because the sine and cosine functions are 2π periodic, each of the functions in (1) and (2) have a period 2π. But from (10) of Section 4.2 we have
Periodicity Because the sine and cosine functions are 2π periodic, each of the functions in (1) and (2) have a period 2π. But from (10) of Section 4.2 we have

Thus (10) implies that tan x and cot x are periodic with a period p ≤ π. In the case of the tangent function, tan x = 0 only if sin x = 0, that is, only if x = 0, ±π, ±π, and so on. Therefore, the smallest positive number p for which tan(x + p) = tan x is p = π. The cotangent function has the same period since it is the reciprocal of the tangent function.
PERIOD OF THE TANGENT AND COTANGENT
The tangent and cotangent functions are periodic with period π. Therefore,
![]()
for every real number x for which the functions are defined.
PERIOD IF THE SECANT AND COSECANT
The secant and cosecant functions are periodic with period 2π. Therefore,
![]()
for every real number x for which the functions are defined.
![]() Graphs The numbers that make the denominators of tan x, cot x, sec x, and csc x equal to zero correspond to vertical asymptotes of their graphs. For example, we encourage you to verify using a calculator that
Graphs The numbers that make the denominators of tan x, cot x, sec x, and csc x equal to zero correspond to vertical asymptotes of their graphs. For example, we encourage you to verify using a calculator that
![]()
In other words, x = −π/2 and x = π/2 are vertical asymptotes. The graph of y = tan x on the interval (−π/2, π/2) given in FIGURE 4.4.2 is one cycle of the graph of y = tan x. Using periodicity we extend the cycle in Figure 4.4.2 to adjacent intervals of length π, as shown in FIGURE 4.4.3. The x-intercepts of the graph of the tangent function are (0, 0), (±π, 0), (±2π, 0),…, and the vertical asymptotes of the graph are x = ±π/2, ±3π/2, ±5π/2,….
The graph of y = cot x is similar to the graph of the tangent function and is given in FIGURE 4.4.4. In this case, the graph of y = cot x on the interval (0, π) is one cycle of the graph of y = cot x. The x-intercepts of the graph of the cotangent function are (±π/2, 0), (±3π/2, 0), (±5π/2, 0),…, and the vertical asymptotes of the graph are x = 0, ±π, ±2π, ±3π, ….
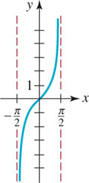
FIGURE 4.4.2 One cycle of the graph of y = tan x
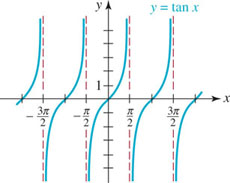
FIGURE 4.4.3 Graph of y = tan x
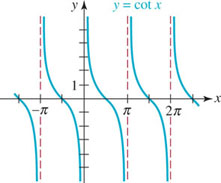
FIGURE 4.4.4 Graph of y = cot x
Note that the graphs of y = tan x and y = cot x are symmetric with respect to the origin, since tan (−x) = −tan x and cot (−x) = −cot x.
For both y = sec x and y = csc x we know that | y | > 1, and so no portion of their graphs can appear in the horizontal strip −1 < y < 1 of the Cartesian plane. Hence the graphs of y = sec x and y = csc x have no x-intercepts. Both y = sec x and y = csc x have period 2π. The vertical asymptotes for the graph of y = sec x are the same as y = tan x, namely, x = ±π/2,±3π/2,±5π/2, …. Because y = cos x is an even function, so is y = sec x = 1/cos x. The graph of y = sec x is symmetric with respect to the y-axis. On the other hand, the vertical asymptotes for the graph of y = csc x are the same as y = cot x, namely, x = 0, ±π, ±2π, ±3π,…. Because y = sin x is an odd function, so is y = csc x = 1/sin x. The graph of y = csc x is symmetric with respect to the origin. One cycle of the graph of y = sec x on [0, 2π] is extended to the interval [−2π, 0] by periodicity (or y-axis symmetry) in FIGURE 4.4.5. Similarly, in FIGURE 4.4.6 we extend one cycle of y = csc x on (0, 2π) to the interval (−2π, 0) by periodicity (or origin symmetry).
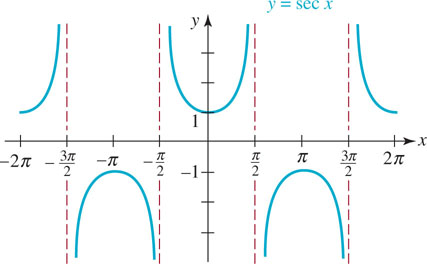
FIGURE 4.4.5 Graph of y = sec x

FIGURE 4.4.6 Graph of y = csc x
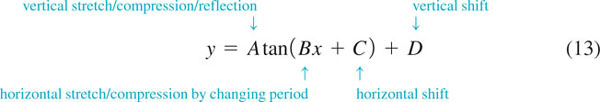
![]() Transformations and Graphs Similar to the sine and cosine graphs, rigid and nonrigid transformations can be applied to the graphs of y = tan x, y = cot x, y = sec x, and y = csc x. For example, a function such as y = A tan (Bx + C) + D can be analyzed in the following manner:
Transformations and Graphs Similar to the sine and cosine graphs, rigid and nonrigid transformations can be applied to the graphs of y = tan x, y = cot x, y = sec x, and y = csc x. For example, a function such as y = A tan (Bx + C) + D can be analyzed in the following manner:
If B > 0, then the period of
![]()
whereas the period of
![]()
As we see in (13), the number A in each case can be interpreted as either a vertical stretch or a compression of a graph. However, you should be aware of the fact that the functions in (14) and (15) have no amplitude, because none of the functions has a maximum and a minimum value.
![]() Also see Problems 49 and 50 in Exercises 4.3.
Also see Problems 49 and 50 in Exercises 4.3.
![]() This is a good time to review (7) of Section 3.5.
This is a good time to review (7) of Section 3.5.
![]() Of the six trigonometric functions, only the sine and cosine functions have an amplitude
Of the six trigonometric functions, only the sine and cosine functions have an amplitude
EXAMPLE 3 Comparison of Graphs
Find the period, x-intercepts, and vertical asymptotes for the graph of y = tan2x. Graph the function on [0, π].
Solution With the identification B = 2, we see from (14) that the period is π/2. Since tan2x = sin 2x/cos 2x, the x-intercepts of the graph occur at the zeros of sin 2x. From (1) of Section 4.3, sin 2x = 0 for
![]()
That is, x = 0,±π/2,±2π/2 = π,±3π/2,±4π/2 = 2π, and so on. The x-intercepts are (0, 0), (±π/2, 0), (±π, 0), (±3π/2, 0),…. The vertical asymptotes of the graph occur at zeros of cos 2x. From (2) of Section 4.3, the numbers for which cos 2x = 0 are found in the following manner:
![]()
That is, the vertical asymptotes are x = ±π/4, ±3π/4, ±5π/4, …. On the interval [0, π], the graph of y = tan2x has three intercepts (0, 0), (π/2, 0), and (π, 0) and two vertical asymptotes x = π/4and x = 3π/4. In FIGURE 4.4.7, we have compared the graphs of y = tan x and y = tan2 x on the interval. The graph of y = tan 2x is a horizontal compression of the graph of y = tan x.
![]()
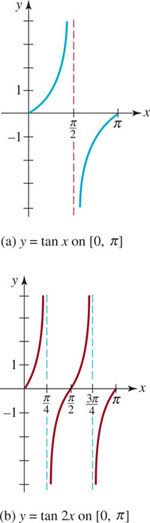
FIGURE 4.4.7 Graphs of functions in Example 3
EXAMPLE 4 Comparison of Graphs
Compare one cycle of the graphs of y = tan x and y = tan(x − π/4).
Solution The graph of y = tan(x − π/4) is the graph of y = tan x shifted horizontally π/4 units to the right. The intercept (0, 0) for the graph of y = tan x is shifted to (π/4, 0) on the graph of y = tan(x − π/4). The vertical asymptotes x = −π/2 and x = π/2 for the graph of y = tan x are shifted to x = −π/4and x = 3π/4for the graph of y = tan(x − π/4). In FIGURES 4.4.8(a) and 4.4.8(b) we see, respectively, that a cycle of the graph of y = tan x on the interval (− π/2, π/2) is shifted to the right to yield a cycle of the graph of y = tan(x − π/4) on the interval (− π/4, 3π/4).
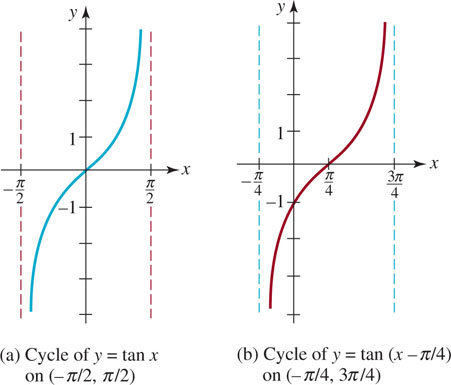
FIGURE 4.4.8 Graphs of functions in Example 4
![]()
As we did in the analysis of the graphs of y = A sin (Bx + C) and y = A cos (Bx + C), we can determine the amount of horizontal shift for graphs of functions such as y = A tan (Bx + C) and y = A sec (Bx + C) by factoring the number B > 0 from Bx + C.
EXAMPLE 5 Two Shifts and Two Compressions
Graph ![]() .
.
Solution Let's break down the analysis of the graph into four parts, namely, by transformations.
(i) One cycle of the graph of y = sec x occurs on [0, 2π]. Since the period of y = sec3x is 2π/3, one cycle of its graph occurs on the interval [0, 2π/3].
In other words, the graph of y = sec3x is a horizontal compression of the graph of y = sec x. Since sec 3x = 1/cos3x, the vertical asymptotes occur at the zeros of cos 3x. Using (2) of Section 4.3, we find
![]()
FIGURE 4.4.9(a) shows two cycles of the graph y = sec3x; one cycle on [−2π/3, 0] and another on [0, 2π/3]. Within those intervals the vertical asymptotes are x = −π/2, x = −π/6, x = π/6, and x = π/2.
(ii) The graph of ![]() is the graph of y = sec 3x compressed vertically by a factor of
is the graph of y = sec 3x compressed vertically by a factor of ![]() and then reflected in the x-axis. See Figure 4.4.9(b).
and then reflected in the x-axis. See Figure 4.4.9(b).
(iii) By factoring 3 from 3x −π/2, we see from

that the graph of ![]() is the graph of
is the graph of ![]() shifted π/6 units to the right. By shifting the two intervals [−2π/3, 0]and [0, 2π/3] in Figure 4.4.9(b) to the right π/6 units, we see in Figure 4.4.9(c) two cycles of
shifted π/6 units to the right. By shifting the two intervals [−2π/3, 0]and [0, 2π/3] in Figure 4.4.9(b) to the right π/6 units, we see in Figure 4.4.9(c) two cycles of ![]() on the intervals [−π/2, π/6] and [π/6, 5π/6]. The vertical asymptotes x = −π/2,x = −π/6, x = π/6, and x = π/2 shown in Figure 4.4.9(b) are shifted to x = − π/3,x = 0, x = π/3,and x = 2π/3. Observe that the y-intercept
on the intervals [−π/2, π/6] and [π/6, 5π/6]. The vertical asymptotes x = −π/2,x = −π/6, x = π/6, and x = π/2 shown in Figure 4.4.9(b) are shifted to x = − π/3,x = 0, x = π/3,and x = 2π/3. Observe that the y-intercept ![]() in Figure 4.4.9(b) is now moved to
in Figure 4.4.9(b) is now moved to ![]() in Figure 4.4.9(c).
in Figure 4.4.9(c).

FIGURE 4.4.9 Graphs of functions in Example 5
(iv) Finally, we obtain the graph ![]() in Figure 4.4.9(d) by shifting the graph of
in Figure 4.4.9(d) by shifting the graph of ![]() in Figure 4.4.9(c) two units upward.
in Figure 4.4.9(c) two units upward.
![]()
4.4 Exercises
Answers to selected odd-numbered problems begin on page ANS–13.
In Problems 1 and 2, complete the given table.
1. 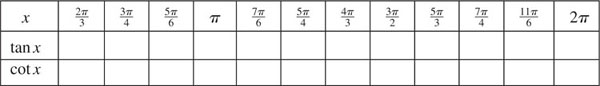
2. 
In Problems 3–18, find the indicated value without the use of a calculator.
3. ![]()
4. ![]()
5. ![]()
6. sec 7π
7. ![]()
8. ![]()
9. ![]()
10. ![]()
11. ![]()
12. ![]()
13. cos 5π
14. ![]()
15. sec (−120°)
16. tan405°
17. csc 495°
18. cot (− 720°)
In Problems 19–26, use the given information to find the values of the remaining five trigonometric functions.
19. tanx = −2, π/2 < x < π
20. ![]()
21. ![]()
22. sec x = −, π/2 < x < 3π/2
23. ![]()
24. ![]()
25. ![]()
26. ![]()
27. If 3 cos x = sin x, find all values of tanx, cotx, secx, and cscx.
28. If cscx = secx, find all values of tanx, cotx, sin x, and cos x.
In Problems 29–36, find the period, x-intercepts, and the vertical asymptotes of the given function. Sketch at least one cycle of the graph.
29. y = tan πx
30. ![]()
31. y = cot2x
32. ![]()
33. ![]()
34. ![]()
35. y = −1 + cot π x
36. ![]()
In Problems 37–44, find the period and the vertical asymptotes of the given function. Sketch at least one cycle of the graph.
37. y = − sec x
38. ![]()
39. y = 3 csc πx
40. ![]()
41. ![]()
42. y = csc(4x + π)
43. ![]()
44. y = −1 + sec(x − 2π)
In Problems 45 and 46, use the graphs of y = tanx and y = secx to find numbers A and C for which the given equality is true.
45. cotx = A tan(x + C)
46. cscx = A sec(x + C)
Calculator Problems
47. Using a calculator in radian mode, compare the values of tan 1.57 and tan 1.58. Explain the difference in these values.
48. Using a calculator in radian mode, compare the values of cot 3.14 and cot 3.15.
For Discussion
49. Can 9cscx = 1 for any real number x?
50. Can 7 + 10secx = 0 for any real number x?
51. For which real numbers x is (a) sin x ≤ csc x ? (b) sin x < csc x ?
52. For which real numbers x is (a) sec x ≤ cos x? (b) sec x < cos x?
53. Discuss and then sketch the graphs of y = |sec x | and y = |csc x |.
4.5 Special Identities
![]() Introduction In this section we examine trigonometric identities. A trigonometric identity is an equation or formula involving trigonometric functions that is valid for all angles or real numbers for which both sides of the equality are defined. There are numerous trigonometric identities, but we are going to develop only those of special importance in courses in mathematics and science.
Introduction In this section we examine trigonometric identities. A trigonometric identity is an equation or formula involving trigonometric functions that is valid for all angles or real numbers for which both sides of the equality are defined. There are numerous trigonometric identities, but we are going to develop only those of special importance in courses in mathematics and science.
The formulas derived in the discussion that follows apply to a real number x, as well as to an angle x, measured in degrees or in radians.
![]() Pythagorean Identities In Section 4.2, we saw that the sine and cosine are related by the fundamental identity sin2 x + cos2 x = 1. In Section 4.4, we saw that by dividing this identity in turn by cos 2x, and then by sin 2x, we obtain two more identities, one relating tan2 x to sec2 x and the other relating cot2 x to csc2x. These so-called Pythagorean identities are so basic to trigonometry that we give them again for future reference.
Pythagorean Identities In Section 4.2, we saw that the sine and cosine are related by the fundamental identity sin2 x + cos2 x = 1. In Section 4.4, we saw that by dividing this identity in turn by cos 2x, and then by sin 2x, we obtain two more identities, one relating tan2 x to sec2 x and the other relating cot2 x to csc2x. These so-called Pythagorean identities are so basic to trigonometry that we give them again for future reference.
PHYTHAGOREAN IDENTITIES
For x a real number for which the functions are defined,
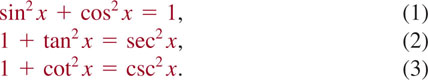
![]() Trigonometric Substitutions In calculus it is often useful to make use of trigonometric substitution to change the form of certain algebraic expressions involving radicals. Generally, this is done using the Pythagorean identities. The following example illustrates the technique.
Trigonometric Substitutions In calculus it is often useful to make use of trigonometric substitution to change the form of certain algebraic expressions involving radicals. Generally, this is done using the Pythagorean identities. The following example illustrates the technique.
EXAMPLE 1 Rewriting a Radical
Rewrite ![]() as a trigonometric expression without radicals by means of the substitution x = a sin θ, a > 0, and − π/2 ≤ θ < π/2.
as a trigonometric expression without radicals by means of the substitution x = a sin θ, a > 0, and − π/2 ≤ θ < π/2.
Solution If x = a sin θ, then
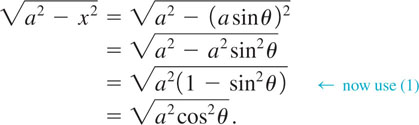
Since a > 0 and cos θ ≥ 0 for − π/2 ≤ 0 ≤ π/2, the original radical is the same as
![]()
![]()
![]() Sum and Difference Formulas The sum and difference formulas for the cosine and sine functions are identities that reduce cos (x1 + x2),cos(x1 − x2),sin(x1 + x2), and sin(x1 − x2) to expressions that involve cos x1, cos x2, sin x1, and sin x2. We will derive the formula for cos(x1 − x2) first, and then we will use that result to obtain the others.
Sum and Difference Formulas The sum and difference formulas for the cosine and sine functions are identities that reduce cos (x1 + x2),cos(x1 − x2),sin(x1 + x2), and sin(x1 − x2) to expressions that involve cos x1, cos x2, sin x1, and sin x2. We will derive the formula for cos(x1 − x2) first, and then we will use that result to obtain the others.
For convenience, let us suppose that x1 and x2 represent angles measured in radians. As shown in FIGURE 4.5.1(a), let d denote the distance between P(x1) and P(x2). If we place the angle x1 − x2 in standard position as shown in Figure 4.5.1(b), then d is also the distance between P(x1 − x2) and P(0). Equating the squares of these distances gives

FIGURE 4.5.1 The difference of two angles

In view of (1)
![]()
and so the preceding equation simplifies to
![]()
This last result can be put to work immediately to find the cosine of the sum of two angles. Since x1 + x2 can be rewritten as the difference x1 − (− x2),

By the even-odd identities, cos (−x2) = cos x2 and sin(−x2) = − sin x2, it follows that the last line is the same as
![]()
The two results just obtained are summarized next.
SUM AND DIFFERENCE FORMULAS FOR THE COSINE
For all real numbers x1 and x2,

EXAMPLE 2 Cosine of a Sum
Evaluate cos ( 7π/12).
Solution We have no way of evaluating cos (7π/12) directly. However, observe that
![]()
Because 7 π/12 radians is a second quadrant angle, we know that the value of cos (7π/12) is negative. Proceeding, the sum formula (4) gives

Using ![]() , this result can also be written as
, this result can also be written as ![]() . Since
. Since ![]() , we see that cos(7π/12) < 0, as expected.
, we see that cos(7π/12) < 0, as expected.
![]()
To obtain the corresponding sum/difference identities for the sine function we will make use of two identities:

These identities were first discovered in Section 4.3 by shifting the graphs of the cosin and sine. However, both results in (6) can now be proved using (5):
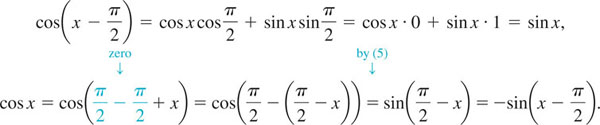
Now from the first equation in (6), the sine of the sum x1 + x2 can be written

The last line is traditionally written as
![]()
To obtain the sine of the difference x1 − x2, we use again cos(−x2) = cos x2 and sin(−x2) = −sin x2:

SUM AND DIFFERENCE FORMULAS FOR THE SINE
For all real numbers x1 and x2,

![]() See (5) in Section 4.3.
See (5) in Section 4.3.
EXAMPLE 3 Sine of a Sum
Evaluate sin(7π/12).
Solution We proceed as in Example 2, except we use the sum formula (7):
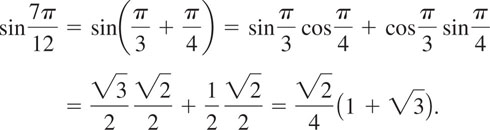
As in Example 2, the result can be rewritten as sin ![]() .
.
![]()
Since we know the value of cos(7π/12) from Example 2, we can also compute the value of sin(7π/12) using the Pythagorean identity (1):
![]()
We solve for sin(7π/12) and take the positive square root:

Although the number in (9) does not look like the result obtained in Example 3, the values are the same. See Problem 68 in Exercises 4.5.
There are sum and difference formulas for the tangent function as well. We can derive the sum formula using the sum formulas for the sine and cosine as follows:

We now divide the numerator and denominator of (10) by cos x1 cos x2 (assuming that x1 and x2 are such that cos x1 cos x2 ≠ 0),

The derivation of the difference formula for tan(x1 − x2) is obtained in a similar manner. We summarize the two results.
SUM AND DIFFERENCE FORMULAS FOR THE TANGENT
For real numbers x1 and x2 for which the functions are defined,

EXAMPLE 4 Tangent of a Sum
Evaluate tan1 (π/12).
Solution If we think of π/12 as an angle in radians, then
![]()
It follows from formula (13):

![]()
Strictly speaking, we really do not need the identities for tan(x1 ±x2), since we can always compute sin(x1 ±x2) and cos(x1 ±x2) using (4)–(8) and then proceed as in (10), that is, form the quotient sin(x1 ±x2)/cos(x1 ±x2).
![]() Double-Angle Formulas Many useful trigonometric formulas can be derived from the sum and difference formulas. The double-angle formulas express the cosine and sine of 2x in terms of the cosine and sine of x.
Double-Angle Formulas Many useful trigonometric formulas can be derived from the sum and difference formulas. The double-angle formulas express the cosine and sine of 2x in terms of the cosine and sine of x.
If we set x1 = x2 = x in (4) and use cos(x + x) = cos 2x, then
![]()
Similarly, by setting x1 = x2 in (7) and using sin(x + x) = sin 2x, then
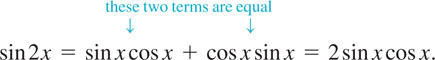
We summarize the last two results along with the double-angle for the tangent function.
DOUBLE-ANGLE FROMULAS
For any real number x,
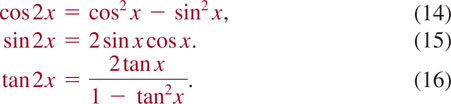
![]() You should rework this example using π/12 = π/3 − π/4 to see that the result is the same.
You should rework this example using π/12 = π/3 − π/4 to see that the result is the same.
EXAMPLE 5 Using the Double-Angle Formulas
If ![]() , find the exact values of cos 2x and sin 2x.
, find the exact values of cos 2x and sin 2x.
Solution First, we compute cos x using sin2x + cos2x = 1. Since π < x < 3π/2, cos x < 0, and so we choose the negative square root:
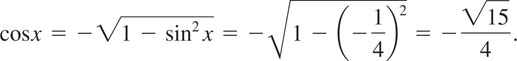
From the double-angle formula (14),
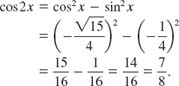
Finally, from the double-angle formula (15),
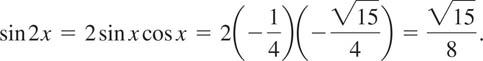
![]()
The formula in (14) has two useful alternative forms. By (1), we know that sin2x = 1 − cos2x. Substituting the last expression into (14) yields cos 2x = cos2x − (1 − cos2x) or
![]()
On the other hand, if we substitute cos2x = 1 − sin2x into (14) we get
![]()
![]() Half-Angle Formulas The alternative forms (17) and (18) of the double-angle formula (14) are the source of two half-angle formulas. Solving (17) and (18) for cos2x and sin2x gives, respectively,
Half-Angle Formulas The alternative forms (17) and (18) of the double-angle formula (14) are the source of two half-angle formulas. Solving (17) and (18) for cos2x and sin2x gives, respectively,
![]()
By replacing the symbol x in (19) by x/2 and using 2(x/2) = x, we obtain the following formulas.
HALF-ANGLE FORMULAS
For any real number x,

EXAMPLE 6 Using the Half-Angle Formulas
Find the exact values of cos (5π/8) and sin(5π/8).
Solution If we let x = 5π/4, then x/2 = 5π/8 and formulas (20) and (21) yield, respectively,
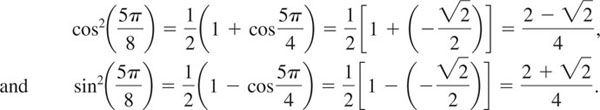
Because 5π/8 radians is a second quadrant angle, cos(5π/8) < 0and sin(5π/8) > 0. Therefore, we take the negative square root for the value of the cosine,

and the positive square root for the value of the sine,
![]()
![]()
If we want the exact value of tan(5π/8)we can use the results of Example 6 or formula (22) with x = 5π/4. Either way, the result is the same
![]()
NOTES FROM THE CLASSROOM
(i) Should you memorize all the identities presented in this section? You should consult your instructor about this, but in the opinion of the authors, you should at the very least memorize formulas (1)–(8), (14), (15), and the two formulas in (19).

(ii) When you enroll in a calculus course, check the title of your text. If it has the words Early Transcendentals in its title, then your knowledge of the graphs and properties of the trigonometric functions will come into play almost immediately.
(iii) As discussed in Sections 2.9 and 3.7, the principal topics of study in calculus are derivatives and integrals of functions. The sum identities (4) and (7) are used to find the derivatives of sin x and cos x, See Section 4.11. Identities are especially useful in integral calculus. Replacing a radical by a trigonometric function as illustrated in Example 1 in this section is a standard technique for evaluating some types of integrals. Also, to evaluate integrals of cos2x and sin2x you would use the half-angle formulas in the form given in (19):
![]()
At some point in your study of integral calculus you may be required to evaluate integrals of products such as
![]()
One way of doing this is to use the sum/difference formulas to devise an identity that converts these products into either a sum of sines or a sum of cosines. See Problems 67–70 in Exercises 4.5.
4.5 Exercises
Answers to selected odd-numbered problems begin on page ANS–14.
In Problems 1–8, proceed as in Example 1 and rewrite the given expression as a trigonometric expression without radicals by making the indicated substitution. Assume that a > 0.
1. ![]()
2. ![]()
3. ![]()
4. ![]()
5. ![]()
6. 
7. 
8. 
In Problems 9–30, use a sum or difference formula to find the exact value of the given expression.
9. ![]()
10. ![]()
11. sin 75°
12. cos 75°
13. ![]()
14. ![]()
15. ![]()
16. ![]()
17. ![]()
18. ![]()
19. ![]()
20. ![]()
21. cos 165°
22. sin 165°
23. tan 165°
24. cos 195°
25. sin 195°
26. tan 195°
27. cos 345°
28. sin 345°
29. ![]()
30. ![]()
In Problems 31–34, use a double-angle formula to write the given expression as a single trigonometric function of twice the angle.
31. 2cos β sin β
32. cos22t − sin22t
33. ![]()
34. ![]()
In Problems 35–40, use the given information to find (a) cos 2x, (b) sin 2x, and (c) tan 2x.
35. ![]()
36. ![]()
37. ![]()
38. csc x = −3, π < x < 3π/2
39. ![]()
40. ![]()
In Problems 41–48, use a half-angle formula to find the exact value of the given expression.
41. cos(π/12)
42. sin(π/8)
43. sin(3π/8)
44. tan(π/12)
45. cos 67.5°
46. sin15°
47. csc( 13π/12)
48. sec(−3π/8)
In Problems 49–54, use the given information to find (a) cos(x/2), (b) sin(x/2), and (c)tan(x/2).
49. ![]()
50. ![]()
51. tanx = 2, π < x < 3π/2
52. cscx = 9, 0° < x < π/2
53. ![]()
54. ![]()
55. If P(x1) and P(x2) are points in quadrant II on the terminal side of the angles x1 and x2, respectively, with ![]() , find (a) sin(x1 + x2), (b)cos(x1 + x2), (c)sin (x1 - x2), and (d) cos (x1 − x2).
, find (a) sin(x1 + x2), (b)cos(x1 + x2), (c)sin (x1 - x2), and (d) cos (x1 − x2).
56. If x1 is a quadrant II angle, x2 is a quadrant III angle, ![]() , find (a) sin(x1 + x2), (b) sin(x1 − x2), (c) cos(x1 + x2), and (d) cos(x1 − x2).
, find (a) sin(x1 + x2), (b) sin(x1 − x2), (c) cos(x1 + x2), and (d) cos(x1 − x2).
Miscellaneous Applications
57. Mach Number The ratio of the speed of an airplane to the speed of sound is called the Mach number M of the plane. If M > 1, the plane makes sound waves that form a (moving) cone, as shown in FIGURE 4.5.2. A sonic boom is heard at the intersection of the cone with the ground. If the vertex angle of the cone is θ, then
![]()
If θ = π/6, find the exact value of the Mach number.
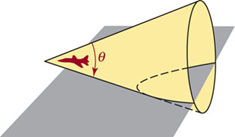
FIGURE 4.5.2 Airplane in Problem 57
58. Cardiovascular Branching A mathematical model for blood flow in a large blood vessel predicts that the optimal values of the angles θ1 and θ2, which represent the (positive) angles of the smaller daughter branches (vessels) with respect to the axis of the parent branch, are given by

where A0 is the cross-sectional area of the parent branch and A1 and A2 are the cross-sectional areas of the daughter branches. See FIGURE 4.5.3. Let ψ = θ1 + θ2 be the junction angle, as shown in the figure.
(a) Show that
![]()
(b) Show that for the optimal values of θ1 and θ2, the cross-sectional area of the daughter branches, A1 + A2, is greater than or equal to that of the parent branch. Therefore, the blood must slow down in the daughter branches.
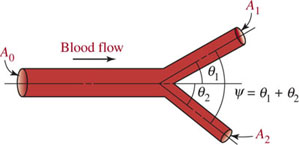
FIGURE 4.5.3 Branching of a large blood vessel in Problem 58
59. Area of a Triangle Show that the area of an isosceles triangle with equal sides of length x is
![]()
where θ is the angle formed by the two equal sides. See FIGURE 4.5.4. [Hint: Consider θ/2 as shown in the figure.]
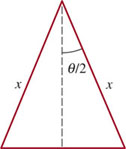
FIGURE 4.5.4 Isosceles triangle in Problem 59
60. Range of a Projectile If a projectile, such as a shot put, is released upward from a height h at an angle ø with velocity v0, then the range R at which it strikes the ground is given by
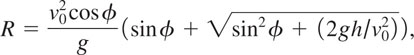
where g is the acceleration due to gravity. See FIGURE 4.5.5. It can be shown that the maximum range Rmax is achieved if the angle ø satisfies the equation
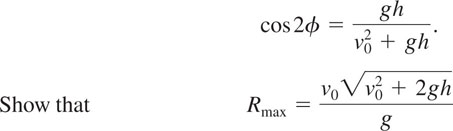
by using the expressions for R and cos 2ø and the half-angle formulas for the sine and the cosine with t = 2ø
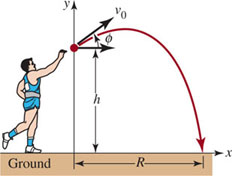
FIGURE 4.5.5 Projectile in Problem 60
For Discussion
61. Discuss: Why would you expect to get an error message from your calculator when you try to evaluate
![]()
62. In Example 3 we showed that ![]() . Following the example, we then showed that sin
. Following the example, we then showed that sin![]() . Demonstrate that these answers are equivalent.
. Demonstrate that these answers are equivalent.
63. Discuss: How would you express sin3θ in terms of sin θ? Carry out your ideas.
64. In Problem 55, in what quadrants do P(x1 + x2) and P(x1 − x2) lie?
65. In Problem 56, in which quadrant does the terminal side of x1 + x2 lie? The terminal side of x1 − x2?
66. Use the sum/difference formulas (4), (5), (7), and (8) to derive the product-to-sum formulas:
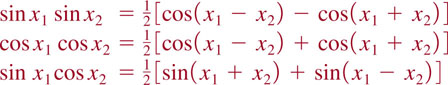
In Problems 67–70, use a product-to-sum formula in Problem 66 to write the giv product as a sum.
67. cos 4θ cos 3θ
68. ![]()
69. sin 2x sin5x
70. sin10x cos4x
71. Show that
![]()
72. Use the product-to-sum formulas in Problem 66 to derive the sum-to-product formulas
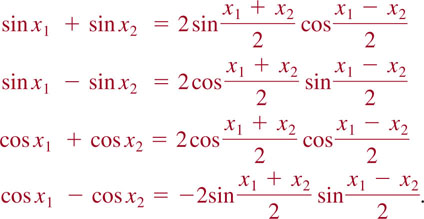
In Problems 73 and 74, use a sum-to-product formula in Problem 72 to find the exact value of the expression. Do not use a calculator.
73. sin75° + sin 15°
73. cos75° − cos 195°
In Problems 75 and 76, use a sum-to-product formula in Problem 72 to write the given sum or difference as a product.
75. cos t + cos5t
76. ![]()
77. (a) Use a graphing utility to obtain the graph of f(x) = 4 − 8sin24x.
(b) Use the graph in part (a) to estimate the period of the function f.
(c) Explain why the period of f is not 2π/4 = π/2.
(d) Determine the exact period of f. [Hint: Use (21) of this section.]
4.6 Trigonometric Equations
![]() Introduction In Section 4.5 we considered trigonometric identities, which are equations involving trigonometric functions that are satisfied by all values of the variable for which both sides of the equality are defined. In this section we examine conditional trigonometric equations, that is, equations that are true for only certain values of the variable. We discuss techniques for finding those values of the variable (if any) that satisfy the equation.
Introduction In Section 4.5 we considered trigonometric identities, which are equations involving trigonometric functions that are satisfied by all values of the variable for which both sides of the equality are defined. In this section we examine conditional trigonometric equations, that is, equations that are true for only certain values of the variable. We discuss techniques for finding those values of the variable (if any) that satisfy the equation.
We begin by considering the problem of finding all real numbers x that satisfy ![]() . As the graph of y = sin x in FIGURE 4.6.1 indicates, there exists an infinite number of solutions of this equation:
. As the graph of y = sin x in FIGURE 4.6.1 indicates, there exists an infinite number of solutions of this equation:

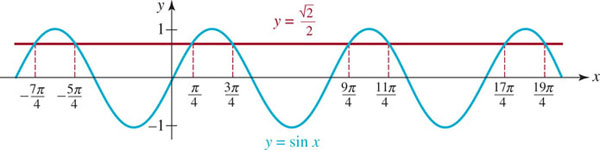
FIGURE 4.6.1 Graphs of y = sin x and ![]()
We observe that in each list in (1), every solution can be obtained by adding 2π = 8 π/4 to the preceding solution. This is a consequence of the periodicity of the sine function. It is common for trigonometric equations to have an infinite number of solutions because of the periodicity of the trigonometric functions. In general, to obtain solutions of an equation such as ![]() , it is more convenient to use a unit circle and reference angles rather than a graph of the trigonometric function. We illustrate this approach in the following example.
, it is more convenient to use a unit circle and reference angles rather than a graph of the trigonometric function. We illustrate this approach in the following example.
EXAMPLE 1 Using the Unit Circle
Find all real numbers x satisfying ![]() .
.
Solution If ![]() , the reference angle for x is π/4 radians. Since the value of sin x is positive, the terminal side of the angle x lies in either the first or second quadrant. Thus, as shown in FIGURE 4.6.2, the only solutions between 0 and 2π are
, the reference angle for x is π/4 radians. Since the value of sin x is positive, the terminal side of the angle x lies in either the first or second quadrant. Thus, as shown in FIGURE 4.6.2, the only solutions between 0 and 2π are
![]()
Since the sine function is periodic with period 2π, all of the remaining solutions can be obtained by adding integer multiples of 2π to these solutions:
![]()
where n is an integer.
![]()
When we are faced with a more complicated equation, such as
![]()
the basic approach is to solve for a single trigonometric function (in this case, it would be sin x) by using methods similar to those for solving algebraic equations. Then the values of the variable x are determined using the unit circle and reference angles. The following example illustrates this technique.

FIGURE 4.6.2 Unit circle for Example 1
EXAMPLE 2 Solving a Trigonometric Equation by Factoring
Find all solutions of 4 sin2x − 8 sin x + 3 = 0.
Solution We first observe that this is a quadratic equation in sin x, and that it factors as
![]() .
.
This implies that either
![]()
The first equation has no solution, since |sin x| ≤ 1. As we see in FIGURE 4.6.3, the two angles between 0 and 2π for which sin x equals ![]() are
are
![]()
Therefore, by the periodicity of the sine function, the solutions are
![]()
where n is an integer.
![]()
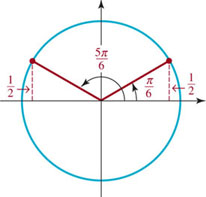
FIGURE 4.6.3 Unit circle for Example 2
EXAMPLE 3 Checking for Lost Solutions
Find all solutions of sin x = cos x. (2)
Solution In order to work with a single trigonometric function, we divide both sides of the equation by cos x to obtain
![]()
Equation (3) is equivalent to (2) provided that cos x ≠ 0. We observe that if cos x = 0, then by (2) of Section 4.3, x = (2n + 1)π/2 = π/2 + n p, for n an integer. By the sum formula for the sine,
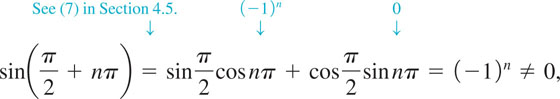
these values of x do not satisfy the original equation. Thus we will find all the solutions to (2) by solving equation (3).
Now tan x = 1 implies that the reference angle for x is π/4 radian. Since tan x = 1 > 0, the terminal side of the angle of x radians can lie either in the first or in the third quadrant, as shown in FIGURE 4.6.4. Thus the solutions are
![]()
where n is an integer. We can see from Figure 4.6.4 these two sets of numbers can be written more compactly as
![]()
where n is an integer.
![]()
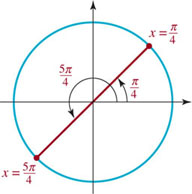
FIGURE 4.6.4 Unit circle in Example 3
![]() Losing Solutions When solving an equation, if you divide by an expression containing a variable, you may lose some solutions of the original equation. For example, in algebra a common mistake in solving equations such as x2 = x is to divide by x to obtain x = 1. But by writing x2 = x as x2 − x = 0 or x(x − 1) = 0, we see that in fact x = 0 or x = 1. To prevent the loss of a solution you must determine the values that make the expression zero and check to see whether they are solutions of the original equation. Note that in Example 3, when we divided by cos x, we took care to check that no solutions were lost.
Losing Solutions When solving an equation, if you divide by an expression containing a variable, you may lose some solutions of the original equation. For example, in algebra a common mistake in solving equations such as x2 = x is to divide by x to obtain x = 1. But by writing x2 = x as x2 − x = 0 or x(x − 1) = 0, we see that in fact x = 0 or x = 1. To prevent the loss of a solution you must determine the values that make the expression zero and check to see whether they are solutions of the original equation. Note that in Example 3, when we divided by cos x, we took care to check that no solutions were lost.
Whenever possible, it is preferable to avoid dividing by a variable expression. As illustrated with the algebraic equation x2 = x, this can frequently be accomplished by collecting all nonzero terms on one side of the equation and then factoring (something we could not do in Example 3). Example 4 illustrates this technique.
![]() cos π = 1, cos π= −1, cos 2π = 1, cos 3π = − 1, and so on. In general, cos nπ = (−1)n, where n is an integer.
cos π = 1, cos π= −1, cos 2π = 1, cos 3π = − 1, and so on. In general, cos nπ = (−1)n, where n is an integer.
![]() This follows from the fact that tanx is π-periodic.
This follows from the fact that tanx is π-periodic.
EXAMPLE 4 Solving a Trigonometric Equation by Factoring
![]()
Solution To avoid dividing by cos x, we write the equation as

Thus either

Since the cosine is zero for all odd multiples of π/2, the solutions from cos x = 0 are:
![]()
where n is an integer.
In the second equation we replace 2sin x cos x by sin 2x from the double-angle formula for the sine to obtain an equation with a single trigonometric function:
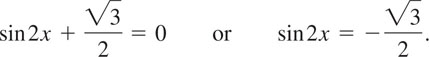
Thus the reference angle for 2x is π/3. Since the sine is negative, the angle 2x must be in either the third quadrant or in the fourth quadrant. As FIGURE 4.6.5 illustrates, either
![]()
Dividing by 2 gives,
![]()

FIGURE 4.6.5 Unit circle for Example 4
Therefore, all solutions of (4) are
![]()
where n is an integer.
![]()
![]() See (15) in Section 4.5.
See (15) in Section 4.5. ![]()
In Example 4, had we simplified the equation by dividing by cos x and not checked to see if the values of x for which cos x = 0 satisfied equation (4), we would have lost the solutions x = π/2 + nπ, where n is an integer.
EXAMPLE 5 Using a Trigonometric Identity
Solve 3 cos2x − cos 2x = 1.
Solution We observe that the given equation involves both the cosine of x and the cosine of 2x. Consequently, we use the double-angle formula for the cosine in the form
![]()
to replace the equation by an equivalent equation that involves cos x only. We find that
![]()
Therefore, cos x = 0, and the solutions are
![]()
where n is an integer.
![]()
So far in this section we have viewed the variable in the trigonometric equation as representing either a real number or an angle measured in radians. If the variable represents an angle measured in degrees, the technique for solving is the same.
EXAMPLE 6 Equation When the Angle Is in Degrees
Solve ![]() , where θ is an angle measured in degrees.
, where θ is an angle measured in degrees.
Solution Since ![]() , the reference angle for 2θ is 60° and the angle 2θ must be in either the second or the third quadrant. FIGURE 4.6.6 illustrates that either 2θ = 120° or 2θ = 240°. Any angle that is coterminal with one of these angles will also satisfy
, the reference angle for 2θ is 60° and the angle 2θ must be in either the second or the third quadrant. FIGURE 4.6.6 illustrates that either 2θ = 120° or 2θ = 240°. Any angle that is coterminal with one of these angles will also satisfy ![]() These angles are obtained by adding any integer multiple of 360° to 120° or to 240°:
These angles are obtained by adding any integer multiple of 360° to 120° or to 240°:
![]()
where n is an integer. Dividing by 2 the last line yields
![]()
![]()
The next example shows that by squaring an equation we may introduce extraneous solutions.
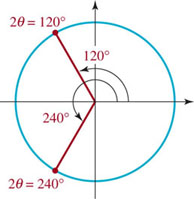
FIGURE 4.6.6 Unit circle for Example 6
EXAMPLE 7 Extraneous Roots
Find all solutions of 1 + tan α = sec α, where α is an angle measured in degrees.
Solution The equation does not factor, but we see that if we square both sides, we can use a fundamental identity to obtain an equation involving a single trigonometric function:
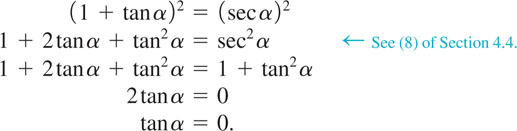
The values of α in [0°, 360°) for which tanα = 0 are
![]()
Since we squared each side of the original equation, we may have introduced extraneous solutions. Therefore, it is important that we check all solutions in the original equation. Substituting α = 0° into 1 + tan α = sec α, we obtain the true statement 1 + 0 = 1. But after substituting α = 180°, we obtain the false statement 1 + 0 = −1. Therefore, 180° is an extraneous solution and α = 0° is the only solution in the interval [0°, 360°). Thus, all the solutions of the equation are given by
![]()
where n is an integer. For n ≠ 0, these are the angles that are coterminal with 0°.
![]()
Recall from Section 2.1 that finding the x-intercepts of the graph of a function y = f(x) is equivalent to solving the equation f(x) = 0. The following example makes use of this fact.
EXAMPLE 8 Intercepts of a Graph
Find the first three x-intercepts of the graph of f(x) = sin 2x cos x on the positive x-axis.
Solution We must solve f(x) = 0, that is, sin 2x cos x = 0. It follows that either sin 2x = 0 or cos x = 0.
From sin 2x = 0, we obtain 2x = nπ, where n is an integer, or x = n π/2, where n is an integer. From cos x = 0, we find x = π/2 + nπ, where n is an integer. Then for n = 2,x = n π/2 gives x = π, whereas for n = 0 and n = 1, x = π/2 + nπ gives x = π/2 and x = 3π/2. Thus the first three x-intercepts on the positive x-axis are (π/2, 0), (π, 0), (3π/2, 0).
![]()
So far all of the trigonometric equations have had solutions that were related by reference angles to the special angles 0, π/6, π/4, π/3, or π/2. If this is not the case, we will see in the next section how to use inverse trigonometric functions and a calculator to find solutions.
4.6 Exercises
Answers to selected odd-numbered problems begin on page ANS–14.
In Problems 1–6, find all solutions of the given trigonometric equation if x represents an angle measured in radians.
1. ![]()
2. ![]()
3. ![]()
4. tan x = −1
5. ![]()
6. csc x = 2
In Problems 7–12, find all solutions of the given trigonometric equation if x represents a real number.
7. cos x = − 1
8. 2sin x = − 1
9. tan x = 0
10. ![]()
11. − csc x = 1
12. ![]()
In Problems 13–18, find all solutions of the given trigonometric equation if θ represents an angle measured in degrees.
13. ![]()
14. ![]()
15. 1 + cotθ = 0
16. ![]()
17. sec θ = −2
18. ![]()
In Problems 19–46, find all solutions of the given trigonometric equation if x is a real number and θ is an angle measured in degrees.
19. cos2 x − 1= 0
20. 2 sin2x − 3sin x +1= 0
21. 3sec2x = sec x
22. ![]()
23. 2cos2θ − 3cos θ − 2 = 0
24. 2sin2θ − sin θ − 1=0
25. cot2θ + cotθ = 0
26. ![]()
27. cos 2x = − 1
28. sec 2x = 2
29. 2 sin 3θ = 1
30. tan 4θ = − 1
31. cot (x/2) = 1
32. csc(θ/3) = −1
33. sin 2x + sin x = 0
34. cos 2x + sin2 x = 1
35. cos 2θ = sin θ
36. sin 2θ + 2sin θ − 2cos θ = 2
37. sin4x − 2sin2x + 1=0
38. tan4θ − 2sec2θ + 3 = 0
39. secx sin2x = tanx
40. ![]()
41. 1 + cotθ =cscθ
42. sin x + cos x
43. ![]()
44. ![]()
45. ![]()
46. ![]()
In Problems 47–54, find the first three x-intercepts of the graph of the given function on the positive x-axis.
47. f(x) = −5sin(3x + π)
48. ![]()
49. ![]()
50. f(x) = 1 + cos πx
51. f(x) = sin x + tanx
52. ![]()
53. f(x) = sin x − sin 2x
54. f(x) = cos x + cos3x [Hint: Write 3x = x + 2x.D]
In Problems 55–58, by graphing determine whether the given equation has any solutions.
55. tan x = x [Hint: Graph y = tan x and y = x on the same set of axes.]
56. sin x = x
57. cot x − x = 0
58. cos x + x + 1 = 0
Miscellaneous Applications
59. Isosceles Triangle From Problem 59 in Exercises 4.5, the area of the isosceles triangle with vertex angle θ as shown in Figure 4.5.4 is given by ![]() . If the length x is 4, what value of θ will give a triangle with area 4?
. If the length x is 4, what value of θ will give a triangle with area 4?
60. Circular Motion An object travels in a circular path centered at the origin with constant angular speed. The y-coordinate of the object at any time t seconds is given by y = 8cos(πt — π/12). At what time(s) does the object cross the x-axis?
61. Mach Number Use Problem 57 in Exercises 4.5 to find the vertex angle of the cone of sound waves made by an airplane flying at Mach 2.
62. Alternating Current An electric generator produces a 60-cycle alternating current given by ![]() , where I(t) is the current in amperes at t seconds. Find the smallest positive value of t for which the current is 15 amperes.
, where I(t) is the current in amperes at t seconds. Find the smallest positive value of t for which the current is 15 amperes.
63. Electrical Circuits If the voltage given by V = V0sin(ωt + α) is impressed on a series circuit, an alternating current is produced. If V0 = 110 volts, ω = 120π radians per second, and a = − π/6, when is the voltage equal to zero?
64. Refraction of Light Consider a ray of light passing from one medium (such as air) into another medium (such as a crystal). Let ø be the angle of incidence and θ the angle of refraction. As shown in FIGURE 4.6.7, these angles are measured from a vertical line. According to Snell’s law, there is a constant c, that depends on the two mediums, such that ![]() . Assume that for light passing from air into a crystal, c = 1.437. Find ø and θ such that the angle of incidence is twice the angle of refraction.
. Assume that for light passing from air into a crystal, c = 1.437. Find ø and θ such that the angle of incidence is twice the angle of refraction.
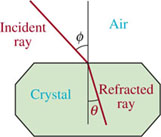
FIGURE 4.6.7 Light rays in Problem 64
65. Snow Cover On the basis of data collected from 1966 to 1980, the extent of snow cover S in the northern hemisphere, measured in millions of square kilometers, can be modeled by the function
![]()
where w is the number of weeks past January 1.
(a) How much snow cover does this formula predict for April Fool’s Day? (Round w to the nearest integer.)
(b) In which week does the formula predict the least amount of snow cover?
(c) What month does this fall in?
4.7 Inverse Trigonometric Functions
![]() Introduction Although we can find the values of the trigonometric functions of real numbers or angles, in many applications we must do the reverse: Given the value of a trigonometric function, find a corresponding angle or number. This suggests we consider inverse trigonometric functions. Before we define the inverse trigonometric functions, let’s recall from Section 2.7 some of the properties of a one-to-one function f and its inverse f−1.
Introduction Although we can find the values of the trigonometric functions of real numbers or angles, in many applications we must do the reverse: Given the value of a trigonometric function, find a corresponding angle or number. This suggests we consider inverse trigonometric functions. Before we define the inverse trigonometric functions, let’s recall from Section 2.7 some of the properties of a one-to-one function f and its inverse f−1.
![]() Recall that a function f is one-to-one if every y in its range corresponds to exactly one x in its domain.
Recall that a function f is one-to-one if every y in its range corresponds to exactly one x in its domain.
![]() Properties of Inverse Functions If y = f(x) is a one-to-one function then there is a unique inverse function f−1 with the following properties:
Properties of Inverse Functions If y = f(x) is a one-to-one function then there is a unique inverse function f−1 with the following properties:
- The domain of f−1 = range of f.
- The range of f−1 = domain of f.
- y = f(x) is equivalent to x = f−1(y).
- The graphs of f and f−1 are reflections in the line y = x.
- f(f−1(x)) = x for x in the domain of f−1.
- f−1(f(x)) = x for x in the domain of f.
Inspection of the graphs of the various trigonometric functions clearly shows that none of these functions is one-to-one. In Section 2.7 we discussed the fact that if a function f is not one-to-one, it may be possible to restrict the function to a portion of its domain where it is one-to-one. Then we can define an inverse for f on that restricted domain. Normally, when we restrict the domain, we make sure to preserve the entire range of the original function.
![]() See Example 7 in Section 2.7 .
See Example 7 in Section 2.7 .
![]() Arcsine Function From FIGURE 4.7.1(a) we see that the function y = sin x on the closed interval [ − π/2, π/2 ] takes on all values in its range [ − 1, 1 ]. Notice that any horizontal line drawn to intersect the red portion of the graph can do so at most once. Thus the sine function on this restricted domain is one-to-one and has an inverse. There are two commonly used notations to denote the inverse of the function shown in Figure 4.7.1(b):
Arcsine Function From FIGURE 4.7.1(a) we see that the function y = sin x on the closed interval [ − π/2, π/2 ] takes on all values in its range [ − 1, 1 ]. Notice that any horizontal line drawn to intersect the red portion of the graph can do so at most once. Thus the sine function on this restricted domain is one-to-one and has an inverse. There are two commonly used notations to denote the inverse of the function shown in Figure 4.7.1(b):
![]()
and are read arcsine of x and inverse sine of x, respectively.
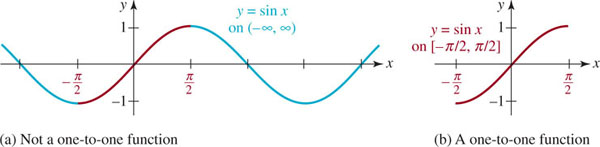
FIGURE 4.7.1 Restricting the domain of y = sin x to produce a one-to-one function
In FIGURE 4.7.2(a) we have reflected the portion of the graph of y = sin x on the interval [−π/2, π/2] (the red graph in Figure 4.7.1(b)) about the line y = x to obtain the graph of y = arcsin x (in blue). For clarity, we have reproduced this blue graph in Figure 4.7.2(b). As this curve shows, the domain of the arcsine function is [ − 1, 1 ] and the range is [−π/2, π/2].

FIGURE 4.7.2 Graph of y = arcsin x is the blue curve
ARCSINE FUNCTION
The arcsine function, or inverse sine function, is defined by
![]()
where −1≤ x ≤1 and −π/2 ≤ y ≤ π/2.
In other words:
The arcsine of the number x is that number y (or radian-measured angle) between −π/2 and π/2 whose sine is x.
When using the notation sin−1 x it is important to realize that “−1” is not an exponent; rather, it denotes an inverse function. The notation arcsin x has an advantage over the notation sin−1 x in that there is no “−1” and hence no potential for misinterpretation; moreover, the prefix “arc” refers to an angle— the angle whose sine is x. But since y = arcsin x and y = sin−1 x are used interchangeably in calculus and in applications, we will continue to alternate their use so that you become comfortable with both notations.
![]() Note of Caution:
Note of Caution: ![]()
EXAMPLE 1 Evaluating the Inverse Sine Function
Find (a) ![]() , (b)
, (b) ![]() ), and (c) sin−11( −1).
), and (c) sin−11( −1).
Solution
(a) If we let ![]() , then by (1) we must find the number y (or radian measured angle) that satisfies =
, then by (1) we must find the number y (or radian measured angle) that satisfies = ![]() and −π/2≤y≤π/2. Since =
and −π/2≤y≤π/2. Since = ![]() , and π/6 satisfies the inequality −π/2 ≤ y ≤ π/2 it follows that y = π/6.
, and π/6 satisfies the inequality −π/2 ≤ y ≤ π/2 it follows that y = π/6.
(b) If we let ![]() , then
, then ![]() . Since we must choose y such that −π/2≤y≤π/2, we find that y = −π/6.
. Since we must choose y such that −π/2≤y≤π/2, we find that y = −π/6.
(c) Letting y = sin−1( −1), we have that sin y = −1 and −π/2≤y≤π/2. Hence y = 2π/2.
![]()
In parts (b) and (c) of Example 1 we were careful to choose y so that −π/2≤y≤π/2. For example, it is a common error to think that because sin(3π/2) = −1, then necessarily sin−1(−1) can be taken to be 3π/2. Remember: If y = sin−1 x, then y is subject to the restriction −π/2≤y≤π/2, and 3π/2 does not satisfy this inequality.
![]() Read this paragraph several times.
Read this paragraph several times.
EXAMPLE 2 Evaluating a Composition
Without using a calculator, find ![]() .
.
Solution We must find the tangent of the angle of t radians with sine equal to ![]() , that is, tan t, where
, that is, tan t, where ![]() . The angle t is shown in FIGURE 4.7.3. Since
. The angle t is shown in FIGURE 4.7.3. Since
![]()
we want to determine the value of cos t. From Figure 4.7.3 and the Pythagorean identity sin2t + cos2t = 1, we see that
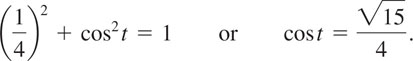
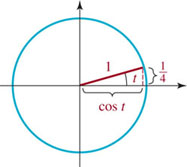
FIGURE 4.7.3 The angle ![]() in Example 2
in Example 2
Hence we have
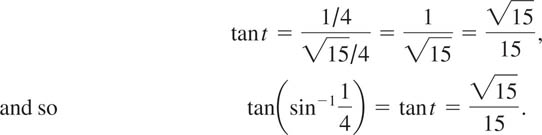
![]()
![]() Arccosine Function If we restrict the domain of the cosine function to the closed interval [0, π], the resulting function is one-to-one and thus has an inverse. We denote this inverse by
Arccosine Function If we restrict the domain of the cosine function to the closed interval [0, π], the resulting function is one-to-one and thus has an inverse. We denote this inverse by
![]()
which gives us the following definition.
ARCCOSINE FUNCTION
The arccosine function, or inverse cosine function, is defined by
![]()
where −1 ≤ x ≤ 1 and 0≤y≤π.
The graphs shown in FIGURE 4.7.4 illustrate how the function y = cos x restricted to the interval [0, π] becomes a one-to-one function. The inverse of the function shown in Figure 4.7.4(b) is y = arcoss x.

FIGURE 4.7.4 Restricting the domain of y = cos x to produce a one-to-one function
By reflecting the graph of the one-to-one function in Figure 4.7.4(b) in the line y = x we obtain the graph of y = arcoss x shown in FIGURE 4.7.5.
Note that the figure clearly shows that the domain and range of y = arcoss x are
[ − 1, 1 ] and [0, π], respectively.
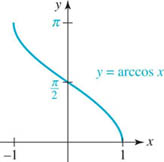
FIGURE 4.7.5 Graph of y = arcoss x.
EXAMPLE 3 Evaluating the Inverse Cosine Function
Find (a) arccos![]() and (b)
and (b) ![]() .
.
Solution
(a) If we let ![]() , then
, then ![]() , and 0≤y≤p. Thus y = π/4.
, and 0≤y≤p. Thus y = π/4.
(b) Letting ![]() , we have that
, we have that ![]() , and we must find y such that 0≤y≤π. Therefore, y = 5π/6,
, and we must find y such that 0≤y≤π. Therefore, y = 5π/6, ![]() .
.
![]()
EXAMPLE 4 Evaluating the Compositions of Functions
Write sin(cos−1 x) as an algebraic expression in x.
Solution In FIGURE 4.7.6 we have constructed an angle of t radians with cosine equal to x. Then t = cos−1x, or x = cos t, where 0≤t≤p. Now to find sin(cos−1x) = sin t, we use the identity sin2t + cos2t = 1. Thus


FIGURE 4.7.6 The angle t = cos −1x in Example 4
We use the nonnegative square root of 1 − x2, since the range of cos −1 x is [0, π] and the sine of an angle t in the first or second quadrant is positive.
![]()
![]() Arctangent Function If we restrict the domain of tanx to the open interval (− π/2, π/2), then the resulting function is one-to-one and thus has an inverse. This inverse is denoted by
Arctangent Function If we restrict the domain of tanx to the open interval (− π/2, π/2), then the resulting function is one-to-one and thus has an inverse. This inverse is denoted by
![]()
ARCTANGENT FUNCTION
The arctangent, or inverse tangent, function is defined by
![]()
where − ∞ < x < ∞ and − π/ 2< y < π/2.
The graphs shown in FIGURE 4.7.7 illustrate how the function y = tan x restricted to the open interval ( −π/2, π/2) becomes a one-to-one function.
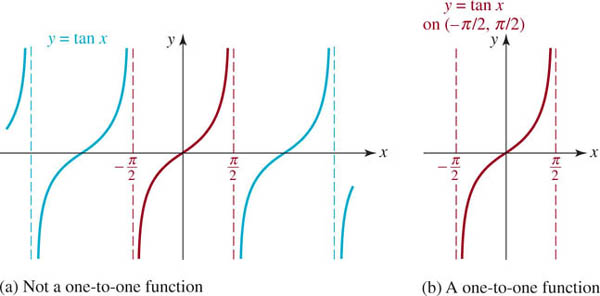
FIGURE 4.7.7 Restricting the domain of y = tanx to produce a one-to-one function
By reflecting the graph of the one-to-one function in Figure 4.7.7(b) in the line y = x we obtain the graph of y = arctan x shown in FIGURE 4.7.8. We see in the figure that the domain and range of y = arctan x are, in turn, the intervals (− ∞, ∞) and (− π/2, π/2).
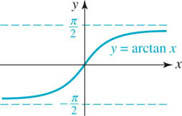
FIGURE 4.7.8 Graph of y = arctan x
EXAMPLE 5 Evaluating the Inverse Tangent
Find tan−1(−1).
Solution If tan−1(−1) = y, then tan y = −1, where − π/2 < y <π/2. It follows that tan−1( −1) = y = −π/4.
![]()
EXAMPLE 6 Evaluating Compositions of Functions
Without using a calculator, find ![]() .
.
Solution If we let ![]() , then
, then ![]() . The Pythagorean identity 1 + tan2t = sec2t can be used to find sec t:
. The Pythagorean identity 1 + tan2t = sec2t can be used to find sec t:

In the preceding line we take the positive square root because ![]() is in the interval (−π/2, π/2) (the range of the arctangent function) and the secant of an angle t in the first or fourth quadrant is positive. Also, from
is in the interval (−π/2, π/2) (the range of the arctangent function) and the secant of an angle t in the first or fourth quadrant is positive. Also, from ![]() we find the value of cos t from the reciprocal identity:
we find the value of cos t from the reciprocal identity:
![]()
Finally we can use the identity tant = sin t/cos t in the form sin t = tant cos t to compute ![]() . It follows that
. It follows that
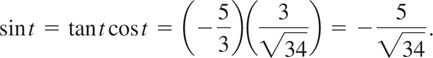
![]()
![]() Properties of the Inverses Recall from Section 2.7 that f−1(f(x)) = x and f(f−1(x)) = x hold for any function f and its inverse under suitable restrictions on x. Thus for the inverse trigonometric functions, we have the following properties.
Properties of the Inverses Recall from Section 2.7 that f−1(f(x)) = x and f(f−1(x)) = x hold for any function f and its inverse under suitable restrictions on x. Thus for the inverse trigonometric functions, we have the following properties.
PROPERTIES OF INVERSE TRIGONOMETRIC FUNCTIONS
(i) arcsin(sin x) = sin−1(sin x) = x if −π/2≤x≤π/2
(ii) sin(arcsin x) = sin(sin−1x) =x if −1≤x≤1
(iii) arcos(cos x) = cos−1(cos x) =x if 0 ≤ x ≤ p
(iv) cos(arcos x) = cos(cos−1x) = x if −1≤x≤1
(v) arctan(tanx) = tan−1(tanx) = x if − π/2< x < π/2
(vi) tan(arctan x) = tan(tan−1 x) = x if −∞< x <∞
EXAMPLE 7 Applying the Inverse Properties
Without using a calculator, evaluate:
(a) ![]()
(b) ![]()
(c) ![]()
Solution
(a) By (i) of the properties of the inverse trigonometric functions,
![]()
(b) By property (iv), ![]()
(c) In this case we cannot apply property (v), since the number 3π/4 is not in the interval (−π/2,π/2). If we first evaluate tan(3π/4) = −1, then we have
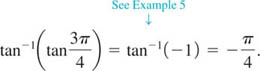
![]()
The next example shows how inverse trigonometric functions can be used to solve trigonometric equations.
EXAMPLE 8 Solving Equations Using Inverse Functions
Find the solutions of 4 cos2x − 3cos x − 2 = 0 in the interval [0, π].
Solution We recognize that this is a quadratic equation in cos x. Since it does not readily factor, we apply the quadratic formula to obtain
![]()
At this find the second quadrant angle ![]() , since cos x cannot be greater than 1. We then use the inverse cosine function (and the aid of a calculator) to solve the remaining equation:
, since cos x cannot be greater than 1. We then use the inverse cosine function (and the aid of a calculator) to solve the remaining equation:

Of course, had we attempted to compute ![]() with a calculator, we would have received an error message.
with a calculator, we would have received an error message.
![]()
![]() Postscript—The Other Inverse Trig Functions The functions cot x, sec x, and csc x also have inverses when their domains are suitably restricted. See Problems 55–57 in Exercises 4.7. Because these functions are not used as often as arctan, arccos, and arcsin, most scientific calculators do not have keys for them. However, any calculator that computes arcsin, arccos, and arctan can be used to obtain values for arccsc, arcsec, and arccot. Unlike the fact that sec x = 1/cos x, we note that sec−1 x ≠ 1/cos−1 x; rather, sec−1x = cos−1(1/x) for |x| ≥ 1. Similar relationships hold for csc−1x and cot−1 x. See Problems 62–64 in Exercises 4.7.
Postscript—The Other Inverse Trig Functions The functions cot x, sec x, and csc x also have inverses when their domains are suitably restricted. See Problems 55–57 in Exercises 4.7. Because these functions are not used as often as arctan, arccos, and arcsin, most scientific calculators do not have keys for them. However, any calculator that computes arcsin, arccos, and arctan can be used to obtain values for arccsc, arcsec, and arccot. Unlike the fact that sec x = 1/cos x, we note that sec−1 x ≠ 1/cos−1 x; rather, sec−1x = cos−1(1/x) for |x| ≥ 1. Similar relationships hold for csc−1x and cot−1 x. See Problems 62–64 in Exercises 4.7.
4.7 Exercises
Answers to selected odd-numbered problems begin on page ANS–15.
In Problems 1–14, find the indicated value without using a calculator.
1. sin −1 0
2. ![]()
3. arccos (−1)
4. ![]()
5. ![]()
6. ![]()
7. ![]()
8. ![]()
9. tan−11
10. ![]()
11. ![]()
12. ![]()
13. ![]()
14. arctan 0
In Problems 15–32, find the indicated value without using a calculator.
15. ![]()
16. ![]()
17. ![]()
18. ![]()
19. cos(arctan( −2))
20. ![]()
21. ![]()
22. sec(tan−14)
23. ![]()
24. ![]()
25. tan(tan−11.2)
26. sin(arcsin 0.75)
27. ![]()
28. ![]()
29. tan−1(tanπ)
30. ![]()
31. ![]()
32. ![]()
In Problems 33–40, write the given expression as an algebraic expression in x.
33. sin(tan−1x)
34. cos(tan−1x)
35. tan(arcsin x)
36. sec(arccos x)
37. cot(sin−1x)
38. cos(sin−1x)
39. csc(arctanx)
40. tan(arccos x)
In Problems 41–48, sketch the graph of the given function.
41. y = arctan|x|
42. ![]()
43. y = |arcsin x|
44. y = sin−1(x + 1)
45. y = 2 cos−1 x
46. y = cos−12x
47. y = arccos(x − 1)
48. y = cos(arcsin x)
In Problems 49–54, find the solutions of the given equation in the indicated interval. (Give your answers to two decimal places.)
49. 20cos2x + cos x − 1=0, [0, π]
50. 3sin2x − 8sin x + 4 = 0, [−π/2, π/2]
51. tan2x + tanx − 1= 0, (−π/2, π/2)
52. 3sin 2x + cos x = 0, [−π/2, π/2]
53. 5cos3x − 3cos2x − cos x = 0, [0, π]
54. tan4x − 3tan2x + 1= 0, ( − π/2, π/2).
55. The arccotangent function can be defined by y = arccot x (or y = cot −1 x) if and only if x = cot y, where 0 < y < π. Graph y = arccot x, and give the domain and the range of this function.
56. The arccosecant function can be defined by y = arccsc x (or y = csc−1x) if and only if x = csc y, where −π/2 ≤ y ≤ π/2 and y ≠ 0. Graph y = arccsc x and give the domain and the range of this function.
57. One definition of the arcsecant function is y = arcsec x ( or y = sec−1x) if and only if x = sec y, where 0≤y≤π and y ≠ π/2. (See Problem 58 for an alternative definition.) Graph y = arcsec x and give the domain and the range of this function.
58. An alternative definition of the arcsecant function can be made by restricting the domain of the secant function to [0, π/2) ∪ [π, 3π/2). Under this restriction, define the arcsecant function. Graph y = arcsec x, and give the domain and the range of this function.
59. Using the definition of the arccotangent function from Problem 55, for what values of x is it true that (a) cot(arccot x) = x and (b) arccot(cotx) = x?
60. Using the definition of the arccosecant function from Problem 56, for what values of x is it true that (a) csc (arccsc x) = xand (b) arccsc(cscx) = x?
61. Using the definition of the arcsecant function from Problem 57, for what values of x is it true that (a) sec (arcsec x) = x and (b) arcsec (sec x) = x?
62. Verify that arccot x = π/2 − arctanx, for all real numbers x.
63. Verify that arccscx = arcsin(1/x) for |x| ≥ 1.
64. Verify that arcsecx = arcos(1/x) for |x| ≥ 1.
In Problems 65–70, use the results of Problems 62–64 and a calculator to find the indicated value.
65. cot−10.75
66. csc−1(−1.3)
67. arccsc(−1.5)
68. arccot(−0.3)
69. arcsec(−1.2)
70. sec−12.5
Miscellaneous Applications
71. Projectile Motion The departure angle θ for a bullet to hit a target at a distance R (assuming that the target and the gun are at the same height) satisfies
![]()
where v0 is the muzzle velocity and g is the acceleration due to gravity. If the target is 800 ft from the gun and the muzzle velocity is 200 ft/s, find the departure angle. Use g = 32 ft/s2. [Hint: There are two solutions.]
72. Olympic Sports For the Olympic event, the hammer throw, it can be shown that the maximum distance is achieved for the release angle θ (measured from the horizontal) that satisfies
![]()
where h is the height of the hammer above the ground at release, v0 is the initial velocity, and g is the acceleration due to gravity. For v0 = 13.7m/s and h = 2.25 m, find the optimal release angle. Use g = 9.81 m/s2.
73. Highway Design In the design of highways and railroads, curves are banked to provide centripetal force for safety. The optimal banking angle θ is given by tanθ = v2/Rg, where v is the speed of the vehicle, R is the radius of the curve, and g is the acceleration due to gravity. See FIGURE 4.7.9. As the formula indicates, for a given radius there is no one correct angle for all speeds. Consequently, curves are banked for the average speed of the traffic over them. Find the correct banking angle for a curve of radius 600 ft on a country road where speeds average 30 mi/h. Use g = 32 ft/s2. [Hint: Use consistent units.]

FIGURE 4.7.9 Banked curve in promlem 73
74. Highway Design-Continued If μ is the coefficient of friction between the car and the road, then the maximum velocity vm that a car can travel around a curve without slipping is given by v2m = gR tan(θ + tan−1μ), where θ is the banking angle of the curve. Find vm for the country road in Problem 73 if μ = 0.26.
75. Geology Viewed from the side, a volcanic cinder cone usually looks like an isosceles trapezoid. See FIGURE 4.7.10. Studies of cinder cones less than 50,000 years old indicate that cone height Hco and crater width Wcr are related to the cone width Wco by the equations Hco = 0.18Wco and Wcr = 0.40Wco. If Wco = 1.00, use these equations to determine the base angle ø of the trapezoid in Figure 4.7.10.

volcanic cone

FIGURE 4.7.10 Volcanic cinder cone in problem 75
76. Electrical Circuits Under certain conditions the current I(t) in an electrical circuit at time t is given by I(t) = I0[sin(ωt + θ) cos ø + cos(ωt + θ) sinø]. Solve for t. [Hint: Use the sum formula for the sine to write the expression in brackets as a single sine function. See (7) of Section 4.5.]
For Discussion
77. Using a calculator set in radian mode, evaluate arctan(tan 1.8), arccos (cos 1.8), and arcsin1sin 1.82. Explain the results.
78. Using a calculator set in radian mode, evaluate tan−1 (tan(−1)), cos −1(cos(−1)), and sin−1(sin(−1)). Explain the results.
79. In Section 4.3 we saw that the graphs of y = sin x and y = cos x are related by shifting and reflecting. Justify the identity
![]()
for all x in [− 1,1] by finding a similar relationship between the graphs of y = arcsin x and y = arccos x.
80. With a calculator set in radian mode, determine which of the following inverse trigonometric evaluations result in an error message: (a) sin−1( −2), (b) cos−1 (−2), (c) tan−1(−2). Explain.
81. Discuss: Can any periodic function be one-to-one?
4.8 Simple Harmonic Motion
![]() Introduction Many physical objects vibrate or oscillate in a regular manner, repeatedly moving back and forth over a definite time interval. Some examples are clock pendulums, a mass on a spring, sound waves, strings on a guitar when plucked, the human heart, tides, and alternating current. In this section we will focus on mathematical models of the undamped oscillatory motion of a mass on a spring.
Introduction Many physical objects vibrate or oscillate in a regular manner, repeatedly moving back and forth over a definite time interval. Some examples are clock pendulums, a mass on a spring, sound waves, strings on a guitar when plucked, the human heart, tides, and alternating current. In this section we will focus on mathematical models of the undamped oscillatory motion of a mass on a spring.
Before proceeding with the main discussion we need to discuss the graph of the sum of constant multiples of cosBx and sinBx, that is, y = c1 cos Bx + c2 sin Bx, where c1 and c2 are constants.
![]() Addition of Two Sinusoidal Functions In Section 4.3 we examined the graphs of horizontally shifted sine and cosine graphs. It turns out that any linear combination of a sine function and a cosine function of the form
Addition of Two Sinusoidal Functions In Section 4.3 we examined the graphs of horizontally shifted sine and cosine graphs. It turns out that any linear combination of a sine function and a cosine function of the form
![]()
where c1 and c2 are constants, can be expressed either as shifted sine function y = Asin(Bx + ø), B > 0, or as a shifted cosine function y = Acos(Bx + ø).Note that in (1) the sine and cosine functions sin Bx and cos Bx have the same period 2π/B.
EXAMPLE 1 Addition of a Sine and a Cosine
Graph the function ![]()
Solution Using a graphing utility we have shown in FIGURE 4.8.1 four cycles of the graphs of y = cos 2x (in red) and ![]() sin 2x (in green). It is apparent in FIGURE 4.8.2 that the period of the sum of these two functions is π, the common period of cos 2x and sin 2x. Also apparent is that the blue graph is a horizontally shifted sine (or cosine) function. Although Figure 4.8.2 suggests that the amplitude of the function
sin 2x (in green). It is apparent in FIGURE 4.8.2 that the period of the sum of these two functions is π, the common period of cos 2x and sin 2x. Also apparent is that the blue graph is a horizontally shifted sine (or cosine) function. Although Figure 4.8.2 suggests that the amplitude of the function ![]() is 2, the exact phase shift of the graph is certainly not apparent.
is 2, the exact phase shift of the graph is certainly not apparent.

FIGURE 4.8.1 Superimposed graphs of y = cos 2.x and ![]() in Example 1
in Example 1
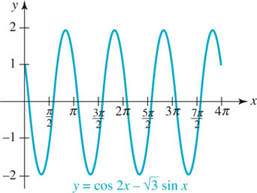
FIGURE 4.8.2 Graph of the sum ![]() in Example 1
in Example 1
![]()
![]() Reduction to a Sine Function We examine only the reduction of (1) to the form y = A sin (Bx + ø), B > 0.
Reduction to a Sine Function We examine only the reduction of (1) to the form y = A sin (Bx + ø), B > 0.
REDUCTION OF (1) TO (2)
For real numbers c1, c2, B, and x,
![]()
where A and ø are defined by

PROOF To prove (2), we use the sum formula (7) of Section 4.5:
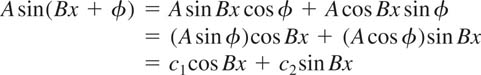
and identify Asin ø = c1, Acos ø = c2. Thus, ![]() and
and ![]() .
.
![]() The sine form y = Asin(Bx + ø) is slightly easier to use than the cosine form y = Acos (Bx + (ø)).
The sine form y = Asin(Bx + ø) is slightly easier to use than the cosine form y = Acos (Bx + (ø)).
![]()
EXAMPLE 2 Example 1 Revisited
Express ![]() as a single sine function.
as a single sine function.
Solution With the identifications c1 = 1, ![]() , and B = 2, we have from (3) and (4),
, and B = 2, we have from (3) and (4),

Although ![]() we cannot blindly assume that
we cannot blindly assume that ![]() . The angle we take for ø must be consistent with the algebraic signs of sin ø and cos ø. Because sin ø > 0 and cos ø < 0 the terminal side of the angle ø lies in the second quadrant. But since the range of the inverse tangent function is the interval (−π/2, π/2 ),
. The angle we take for ø must be consistent with the algebraic signs of sin ø and cos ø. Because sin ø > 0 and cos ø < 0 the terminal side of the angle ø lies in the second quadrant. But since the range of the inverse tangent function is the interval (−π/2, π/2 ), ![]() is a fourth quadrant angle. The correct angle is found by using the reference angle π/6 for
is a fourth quadrant angle. The correct angle is found by using the reference angle π/6 for ![]() to find the second quadrant angle
to find the second quadrant angle
![]()
Therefore ![]() can be rewritten as
can be rewritten as

Hence the graph of ![]() is the graph of y = 2 sin 2x, which has amplitude 2, period 2π/2 2π, and is shifted 5π/12 units to the left.
is the graph of y = 2 sin 2x, which has amplitude 2, period 2π/2 2π, and is shifted 5π/12 units to the left.
![]()
![]() Simple Harmonic Motion Consider the motion of a mass on a spring as shown in FIGURE 4.8.3. In the absence of frictional or damping forces, a mathematical model for the displacement (or directed distance) of the mass measured from a position called the equilibrium position is given by the function,
Simple Harmonic Motion Consider the motion of a mass on a spring as shown in FIGURE 4.8.3. In the absence of frictional or damping forces, a mathematical model for the displacement (or directed distance) of the mass measured from a position called the equilibrium position is given by the function,
![]()
Oscillatory motion modeled by the function (5) is said to be simple harmonic motion.
More precisely, we have the following definition.
SIMPLE HARMONIC MOTION
A point moving on a coordinate line whose position at time t is given by
![]()
where A, ω > 0, and ø are constants, is said to exhibit simple harmonic motion.
Special cases of the trigonometric functions in (6) are y(t) = Asin ωt, y(t) = Acos ωt, and y(t) = c1cos ωt + c2sin ωt.
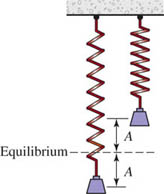
FIGURE 4.8.3 An undamped spring/mass system exhibits simple harmonic motion
![]() Terminology The function (5) is said to be the equation of motion of the mass. Also, in (5),
Terminology The function (5) is said to be the equation of motion of the mass. Also, in (5), ![]() , where k is the spring constant (an indicator of the stiffness of the spring), m is the mass attached to the spring (measured in slugs or kilograms), y0 is the initial displacement of the mass (measured above or below the equilibrium position), v0 is the initial velocity of the mass, t is time measured in seconds, and the period p of motion is p = 2π/ω seconds. The number f = 1/π = 1/(2π/ ω)2 = ω/2π is called the frequency of motion. The frequency indicates the number of cycles completed by the graph per unit time. For example, if the period of (5) is, say, π = 2 seconds, then we know that one cycle of the function is complete in 2 seconds. The frequency
, where k is the spring constant (an indicator of the stiffness of the spring), m is the mass attached to the spring (measured in slugs or kilograms), y0 is the initial displacement of the mass (measured above or below the equilibrium position), v0 is the initial velocity of the mass, t is time measured in seconds, and the period p of motion is p = 2π/ω seconds. The number f = 1/π = 1/(2π/ ω)2 = ω/2π is called the frequency of motion. The frequency indicates the number of cycles completed by the graph per unit time. For example, if the period of (5) is, say, π = 2 seconds, then we know that one cycle of the function is complete in 2 seconds. The frequency ![]() means one-half of a cycle is complete in 1 second.
means one-half of a cycle is complete in 1 second.
In the study of simple harmonic motion it is convenient to recast the equation of motion (5) as a single expression involving only the sine function:
![]()
The reduction of (5) to the sine function (7) can be done in exactly the same manner as illustrated in Example 2. In this situation we make the following identifications between (2) and (5):
![]()
EXAMPLE 3 Equation of Motion
(a) Find the equation of simple harmonic motion (5) for a spring mass system if ![]() .
.
(b) Find the period and frequency of motion.
Solution (a) We begin with the simple harmonic motion equation (5). Since ![]() . Therefore (5) becomes
. Therefore (5) becomes
![]()
(b) The period of motion is 2π/8 = π/4 second; the frequency is 4/π = 1.27 cycles per second.
![]()
EXAMPLE 4 Example 3 Continued
Express the equation of motion (8) as a single sine function (7).
Solution With ![]() , we find the amplitude of motion is
, we find the amplitude of motion is
![]()
Then from
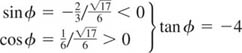
we can see from algebraic signs sin ø < 0 and cos ø > 0 that the terminal side of the angle ø lies in the fourth quadrant. Hence the correct, but approximate, value of ø is tan−1(−4) = −1.3258. The equation of motion is then ![]() . As shown in FIGURE 4.8.4, the amplitude of motion is
. As shown in FIGURE 4.8.4, the amplitude of motion is ![]() . Since we are assuming that there is no resistance to the motion, once the spring/mass system is set in motion the model indicates it stays in motion bouncing back and forth between its maximum displacement
. Since we are assuming that there is no resistance to the motion, once the spring/mass system is set in motion the model indicates it stays in motion bouncing back and forth between its maximum displacement ![]() feet above the equilibrium position and a minimum of
feet above the equilibrium position and a minimum of ![]() feet below the equilibrium position.
feet below the equilibrium position.
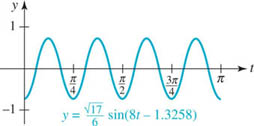
FIGURE 4.8.4 Graph of the equation of motion in
![]()
Only in the two cases, c1 > 0, c2> 0 or c1 < 0, c2 > 0, can we use tan ø in (4) to write ø = tan-1 (c1/c2). (Why?) Correspondingly, ø is a first or a fourth quadrant angle.
4.8 Exercises
Answers to selected odd-numbered problems begin on page ANS–15.
In Problems 1–6, proceed as in Example 2 and reduce the given trigonometric expression to the form y = A sin(Bx + ø). Sketch the graph and give the amplitude, the period, and the phase shift.
1. y = cos πx − sin πx
2. ![]()
3. ![]()
4. ![]()
5. ![]()
6. y = sin x + cos x
In Problems 7–10, proceed as in Examples 3 and 4 and use the given information to express the equation of simple harmonic motion (5) for a spring/mass system in the trigonometric form (7). Give the amplitude, period, and frequency of motion.
7. ![]()
8. ![]()
9. m = 1 slug, y0 = −1 ft, k = 16 lb/ft, and v0 = −2 ft/s
10. ![]()
11. The equation of simple harmonic motion of a spring/mass system is ![]() . Determine the initial displacement y0 and initial velocity v0 of the mass. [Hint: Use (5).]
. Determine the initial displacement y0 and initial velocity v0 of the mass. [Hint: Use (5).]
12. Use the equation of simple harmonic motion of the spring/mass system given in Problem 11 to find the times for which the mass passes through the equilibrium position y = 0.
Miscellaneous Applications
13. Electrical Circuits Under certain conditions the current I(t) in an electrical circuit at time t is given by I(t) = I0[sin((ωt + 0)cosø + cos((ωt + 0)sin ø]. Express I(t) as a single sine function of the form given in (7). [Hint: Review the sum formula in (7) of Section 4.5.]
4.9 Right Triangle Trigonometry
![]() Introduction The word trigonometry (from the Greek trigonon meaning triangle and metria meaning measurement) refers to the measurement of triangles. In Section 4.2 we defined the trigonometric functions using coordinates of points on the unit circle, and by using radian measure we were able to define the trigonometric functions not only for any angle but for any real number as well. In this section we will show that the trigonometric functions of an acute angle in a right triangle have an equivalent definition in terms of the lengths of the sides of the triangle.
Introduction The word trigonometry (from the Greek trigonon meaning triangle and metria meaning measurement) refers to the measurement of triangles. In Section 4.2 we defined the trigonometric functions using coordinates of points on the unit circle, and by using radian measure we were able to define the trigonometric functions not only for any angle but for any real number as well. In this section we will show that the trigonometric functions of an acute angle in a right triangle have an equivalent definition in terms of the lengths of the sides of the triangle.
![]() Opposite, Adjacent, and Hypotenuse In FIGURE 4.9.1(a) we have drawn a right triangle with sides labeled a, b, and c (indicating their respective lengths) and one of the acute angles denoted by θ. From the Pythagorean theorem we know that a2 + b2 = c2. The side opposite the right angle is called the hypotenuse; the remaining sides are referred to as the legs of the triangle. The legs labeled a and b are, in turn, said to be the side adjacent to the angle θ and the side opposite the angle θ. We will also use the abbreviations hyp, adj, and opp to denote the lengths of these sides.
Opposite, Adjacent, and Hypotenuse In FIGURE 4.9.1(a) we have drawn a right triangle with sides labeled a, b, and c (indicating their respective lengths) and one of the acute angles denoted by θ. From the Pythagorean theorem we know that a2 + b2 = c2. The side opposite the right angle is called the hypotenuse; the remaining sides are referred to as the legs of the triangle. The legs labeled a and b are, in turn, said to be the side adjacent to the angle θ and the side opposite the angle θ. We will also use the abbreviations hyp, adj, and opp to denote the lengths of these sides.
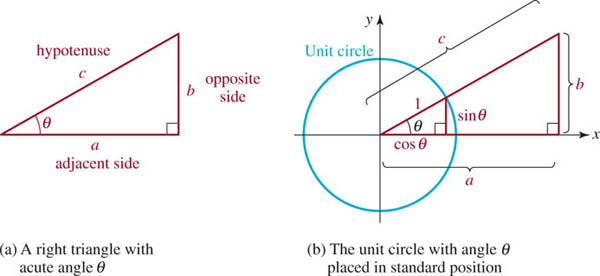
FIGURE 4.9.1 In (a) and (b) the right triangles are the same
If we place θ in standard position and draw a unit circle centered at the origin, we see from Figure 4.9.1(b) that there are two similar right triangles containing the same angle θ. Since corresponding sides of similar triangles are proportional, it follows that

Also, we have
![]()
Then, applying the reciprocal identities in Section 4.4, each trigonometric function of θ can be written as the ratio of the lengths of the sides of a right triangle as follows. See FIGURE 4.9.2.
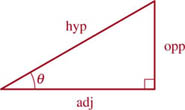
FIGURE 4.9.2 Defining the trigonometric functions of θ
TRIGONOMETRIC FUNCTIONS OF θ IN A RIGHT TRIANGLE
For an acute angle θ in a right triangle as shown in Figure 4.9.2,
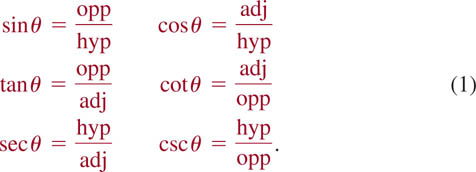
EXAMPLE 1 Values of the Six Trigonometric Functions
Find the exact values of the six trigonometric functions of the angle θ in the right triangle shown in FIGURE 4.9.3.
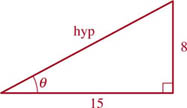
FIGURE 4.9.3 Right triangle in Example 1
Solution From Figure 4.9.3 we see that the side opposite θ has length 8 and the side adjacent has length 15. From the Pythagorean theorem the hypotenuse c is
![]()
Thus from (1) the values of the six trigonometric functions are:
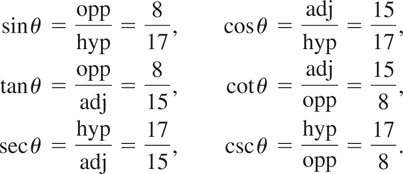
![]()
EXAMPLE 2 Using a Triangle Sketch
If θ is an acute angle and ![]() , find the values of the other trigonometric functions of θ.
, find the values of the other trigonometric functions of θ.
Solution We sketch a right triangle with an acute angle θ satisfying ![]() , by making opp = 2 and hyp = 7 as shown in FIGURE 4.9.4. From the Pythagorean theorem we have
, by making opp = 2 and hyp = 7 as shown in FIGURE 4.9.4. From the Pythagorean theorem we have
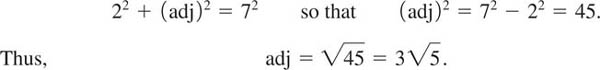
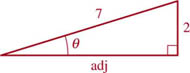
FIGURE 4.9.4 Right triangle in Example 2
The values of the remaining five trigonometric functions are obtained from the definitions in (1):
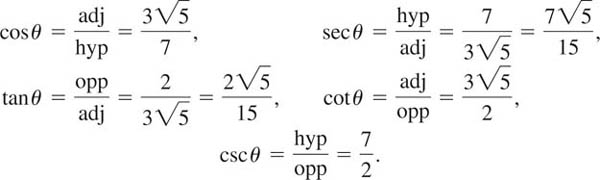
![]()
![]() Solving Right Triangles Applications of right triangle trigonometry in fields such as surveying and navigation involve solving right triangles. The expression “to solve a triangle” means that we wish to find the length of each side and the measure of each angle in the triangle. We can solve any right triangle if we know either two sides or one acute angle and one side. As the following examples will show, sketching and labeling the triangle is an essential part of the solution process. It will be our general practice to label a right triangle as shown in FIGURE 4.9.5. The three vertices will be denoted by A, B, and C, with C at the vertex of the right angle. We denote the angles at A and B by α and β and the lengths of the sides opposite these angles by a and b, respectively. The length of the side opposite the right angle at C is denoted by c.
Solving Right Triangles Applications of right triangle trigonometry in fields such as surveying and navigation involve solving right triangles. The expression “to solve a triangle” means that we wish to find the length of each side and the measure of each angle in the triangle. We can solve any right triangle if we know either two sides or one acute angle and one side. As the following examples will show, sketching and labeling the triangle is an essential part of the solution process. It will be our general practice to label a right triangle as shown in FIGURE 4.9.5. The three vertices will be denoted by A, B, and C, with C at the vertex of the right angle. We denote the angles at A and B by α and β and the lengths of the sides opposite these angles by a and b, respectively. The length of the side opposite the right angle at C is denoted by c.

FIGURE 4.9.5 Standard labeling for a right triangle
EXAMPLE 3 Solving a Right Triangle
Solve the right triangle having a hypotenuse of length ![]() and one 60° angle.
and one 60° angle.
Solution First we make a sketch of the triangle and label it as shown in FIGURE 4.9.6. We wish to find a, b, and β. Since α and β are complementary angles, α + β = 90° yields
![]()

FIGURE 4.9.6 Right triangle in Example 3
We are given the length of the hypotenuse, namely, ![]() . To find a, the length of the side opposite the angle α = 60°, we select the sine function. From sin α = opp/hyp, we obtain
. To find a, the length of the side opposite the angle α = 60°, we select the sine function. From sin α = opp/hyp, we obtain
![]()
Since ![]() ,we have
,we have
![]()
Finally, to find the length b of the side adjacent to the 60° angle we select the cosine function. From cos α = adj/hyp, we obtain
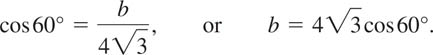
Because ![]() , we find
, we find
![]()
![]()
In Example 3 once we determined a, we could have found b by using either the Pythagorean theorem or the tangent function. In general, there are usually several ways to solve a triangle.
![]() Use of a Calculator If angles other than 30°, 45°, or 60° are involved in a problem, we can obtain approximations of the desired trigonometric function values with a calculator. For the remainder of this chapter, whenever an approximation is used, we will round the final results to the nearest hundredth unless the problem specifies otherwise. To take full advantage of the calculator’s accuracy, store the computed values of the trigonometric functions in the calculator for subsequent calculations. If, instead, a rounded version of a displayed value is written down and then later keyed back into the calculator, the accuracy of the final result may be diminished.
Use of a Calculator If angles other than 30°, 45°, or 60° are involved in a problem, we can obtain approximations of the desired trigonometric function values with a calculator. For the remainder of this chapter, whenever an approximation is used, we will round the final results to the nearest hundredth unless the problem specifies otherwise. To take full advantage of the calculator’s accuracy, store the computed values of the trigonometric functions in the calculator for subsequent calculations. If, instead, a rounded version of a displayed value is written down and then later keyed back into the calculator, the accuracy of the final result may be diminished.
EXAMPLE 4 Solving a Right Triangle
Solve the right triangle with legs of length 4 and 5.
Solution After sketching and labeling the triangle as shown in FIGURE 4.9.7, we see that we need to find c, α, and β. From the Pythagorean theorem, the hypotenuse c is given by
![]()

FIGURE 4.9.7 Right triangle in Example 4
To find β we use tan β = opp/adj. (By choosing to work with the given quantities, we avoid error due to previous approximations.) Thus we have
![]()
From a calculator set in degree mode, we find β ≈ 38.66°. Since α = 90° – β we obtain α ≈ 51.34°.
![]()
EXAMPLE 5 Finding the Height of a Tree
A kite is caught in the top branches of a tree. If the 90-ft kite string makes an angle of 22° with the ground, estimate the height of the tree by finding the distance from the kite to the ground.
Solution Let h denote the height of the kite. From FIGURE 4.9.8 we see that
![]()

FIGURE 4.9.8 Tree in Example 5
![]()
EXAMPLE 6 Finding Dimensions of a Saw Cut
A carpenter cuts the end of a 4-in.-wide board on a 25° bevel from the vertical, starting at a point ![]() in. from the end of the board. Find the lengths of the diagonal cut and the remaining side. See FIGURE 4.9.9.
in. from the end of the board. Find the lengths of the diagonal cut and the remaining side. See FIGURE 4.9.9.
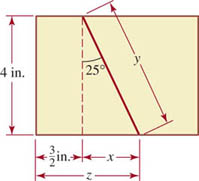
FIGURE 4.9.9 Saw cut in Example 6
Solution Let x, y, and z be the (unknown) dimensions, as labeled in Figure 4.9.9. It follows from the definition of the tangent function that
![]()
To find y we observe that
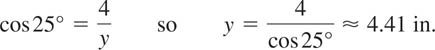
Since ![]() and x ≈ 1.87 in., we see that z ≈ 1.5 + 1.87 3.37
and x ≈ 1.87 in., we see that z ≈ 1.5 + 1.87 3.37
![]()
![]() Angles of Elevation and Depression The angle between an observer’s line of sight to an object and the horizontal is given a special name. As FIGURE 4.9.10 illustrates, if the line of sight is to an object above the horizontal, the angle is called an angle of elevation, whereas if the line of sight is to an object below the horizontal, the angle is called an angle of depression.
Angles of Elevation and Depression The angle between an observer’s line of sight to an object and the horizontal is given a special name. As FIGURE 4.9.10 illustrates, if the line of sight is to an object above the horizontal, the angle is called an angle of elevation, whereas if the line of sight is to an object below the horizontal, the angle is called an angle of depression.

FIGURE 4.9.10 Angles of elevation and depression
EXAMPLE 7 Using Angles of Elevation
A surveyor uses an instrument called a theodolite to measure the angle of elevation between ground level and the top of a mountain. At one point the angle of elevation is measured to be 41°. A half kilometer farther from the base of the mountain, the angle of elevation is measured to be 37°. How high is the mountain?
Solution Let h represent the height of the mountain. FIGURE 4.9.11 shows that there are two right triangles sharing the common side h, so we obtain two equations in two unknowns z and h:
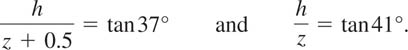
We can solve each of these for h, obtaining
![]()
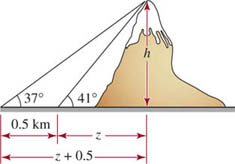
FIGURE 4.9.11 Mountain in Example 7
Equating the last two results gives an equation from which we can determine the distance z:
![]()
Solving for z gives us
![]()
Now h can be found using h = z tan 41°:
![]()
![]()
![]() Building a Function Section 2.8 was devoted to setting up or building functions that were described or expressed in words. As emphasized in that section, this is a task that you will surely face in a course in calculus. Our last example illustrates a recommended procedure for sketching a figure and labeling quantities of interest with appropriate variables.
Building a Function Section 2.8 was devoted to setting up or building functions that were described or expressed in words. As emphasized in that section, this is a task that you will surely face in a course in calculus. Our last example illustrates a recommended procedure for sketching a figure and labeling quantities of interest with appropriate variables.
EXAMPLE 8 Defining Functions That Involve Trigonometry
A plane flying horizontally at an altitude of 2 miles approaches a radar station as shown in FIGURE 4.9.12.
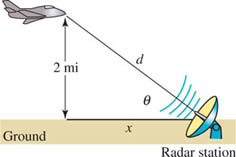
FIGURE 4.9.12 Plane in Example 8
(a) Express the distance d between the plane and the radar station as a function of the angle of elevation θ.
(b) Express the angle of elevation θ of the plane as a function of the horizontal separation x between the plane and the radar station.
Solution As shown in Figure 4.9.12,θ is an acute angle in a right triangle.
(a) We can relate the distance d and the angle θ by sin θ = 2/d. Solving for d gives
![]()
where 0° < θ = 90°.
(b) The horizontal separation x and θ are related by tan θ = 2/x. We make use of the inverse tangent function to solve for θ:
![]()
where 0 < x < ∞.
![]()
4.9 Exercises
Answers to selected odd-numbered problems begin on page ANS–15.
In Problems 1–10, find the values of the six trigonometric functions of the angle θ in the given triangle.
1. 
FIGURE 4.9.13 Triangle for Problem 1
2. 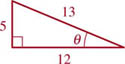
FIGURE 4.9.14 Triangle for Problem 2
3. 
FIGURE 4.9.15 Triangle for Problem 3
4. 
FIGURE 4.9.16 Triangle for Problem 4
5. ![]()
FIGURE 4.9.17 Triangle for Problem 5
6. 
FIGURE 4.9.18 Triangle for Problem 6
7. 
FIGURE 4.9.19 Triangle for Problem 7
8. 
FIGURE 4.9.20 Triangle for Problem 8
9. 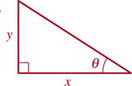
FIGURE 4.9.21 Triangle for Problem 9
10. 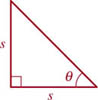
FIGURE 4.9.22 Triangle for Problem 10
In Problems 11–22, find the indicated unknowns. Each problem refers to the triangle shown in FIGURE 4.9.23.
11. α = 4, β = 27°; b, c
12. c = 10, β = 49°; a, b
13. b = 8, β = 34.33°; a, c
14. c = 25, a = 50°; a, b
15. b = 1.5, c = 3; α, β, a
16. α = 5, b = 2; α, β, c
17. α = 4, b = 10; α, β, c
18. b = 4, a = 58°; a, c
19. α = 9,c = 12; α, β, b
20. b = 3, c = 6; α, β, a
21. b = 20, α = 23°; a, c
22. α = 11, α = 33.5°; b, c
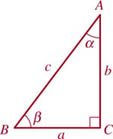
FIGURE 4.9.23 Triangle for Problems 11–22
In Problems 23 and 24, solve for x in the given triangle.
23. 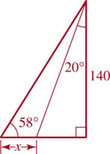
FIGURE 4.9.24 Triangle for Problem 23
24. 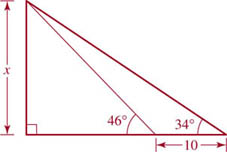
FIGURE 4.9.25 Triangle for Problem 24
25. A building casts a shadow 20 m long. If the angle from the tip of the shadow to a point on top of the building is 69°, how high is the building?
26. Two trees are on opposite sides of a river, as shown in FIGURE 4.9.26. A base line of 100 ft is measured from tree T1, and from that position the angle β to T2 is measured to be 29.7°. If the base line is perpendicular to the line segment between T1 and T2, find the distance between the two trees.
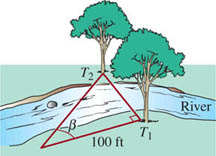
FIGURE 4.9.26 Trees and river in Problem 26
27. A 50-ft tower is located on the edge of a river. The angle of elevation between the opposite bank and the top of the tower is 37°. How wide is the river?
28. A surveyor uses a geodometer to measure the straight-line distance from a point on the ground to a point on top of a mountain. Use the information given in FIGURE 4.9.27 to find the height of the mountain.

FIGURE 4.9.27 Mountain in Problem 28
29. An observer on the roof of building A measures a 27° angle of depression between the horizontal and the base of building B. The angle of elevation from the same point to the roof of the second building is 41.42°. What is the height of building B if the height of building A is 150 ft? Assume buildings A and B are on the same horizontal plane.
30. Find the height h of a mountain using the information given in FIGURE 4.9.28.
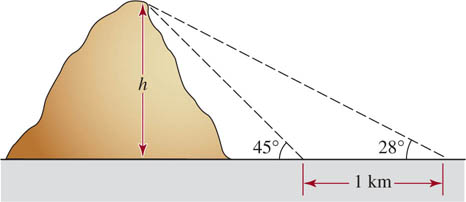
FIGURE 4.9.28 Mountain in Problem 30
31. The top of a 20-ft ladder is leaning against the edge of the roof of a house. If the angle of inclination of the ladder from the horizontal is 51°, what is the approximate height of the house and how far is the bottom of the ladder from the base of the house?
32. An airplane flying horizontally at an altitude of 25,000 ft approaches aradar station located on a 2000-ft-high hill. At one instant in time, the angle between the radar dish pointed at the plane and the horizontal is 57°. What is the straight-line distance in miles between the airplane and the radar station at that particular instant?
33. A 5-mi straight segment of a road climbs a 4000-ft hill. Determine the angle that the road makes with the horizontal.
34. A box has dimensions as shown in FIGURE 4.9.29. Find the length of the diagonal between the corners P and Q. What is the angle θ formed between the diagonal and the bottom edge of the box?

FIGURE 4.9.29 Box in Problem 34
35. Observers in two towns A and B on either side of a 12,000-ft mountain measure the angles of elevation between the ground and the top of the mountain. See FIGURE 4.9.30. Assuming that the towns and the mountain top lie in the same vertical plane, find the horizontal distance between them.
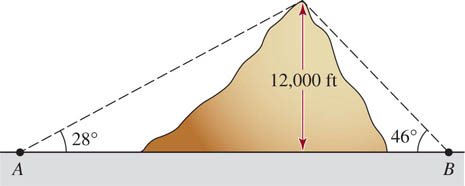
FIGURE 4.9.30 Mountain in Problem 35
36. A drawbridge* measures 7.5 m from shore to shore, and when completely open it makes an angle of 43° with the horizontal. See FIGURE 4.9.31(a). When the bridge is closed, the angle of depression from the shore to a point on the surface of the water below the opposite end is 27°. See Figure 4.9.31(b). When the bridge is fully open, what is the distance d between the highest point of the bridge and the water below?
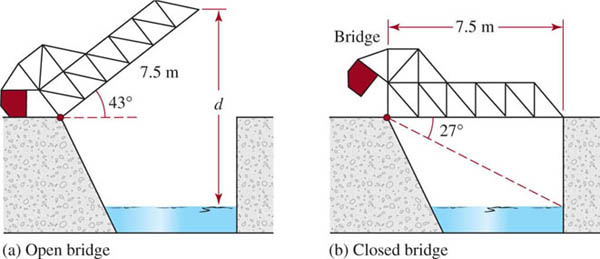
FIGURE 4.9.31 Drawbridge in Problem 36
37. A flagpole is located at the edge of a sheer 50-ft cliff at the bank of a river of width 40 feet. See FIGURE 4.9.32. An observer on the opposite side of the river measures an angle of 9° between her line of sight to the top of the flagpole and her line of sight to the top of the cliff. Find the height of the flagpole.
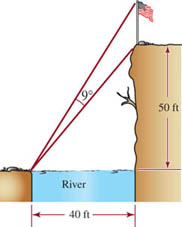
FIGURE 4.9.32 Flagpole in Problem 35
38. From an observation sight 1000 ft from the base of Mt. Rushmore, the angle of elevation to the top of the sculpted head of George Washington is measured to be 80.05°, whereas the angle of elevation to the bottom of his head is 79.946°. Determine the height of George Washington’s head.
Bust of George Washington on Mt. Rushmore
Sundial
39. The length of a Boeing 747 airplane is 231 ft. What is the plane’s altitude if it subtends an angle of 2° when it is directly above an observer on the ground? See FIGURE 4.9.33.
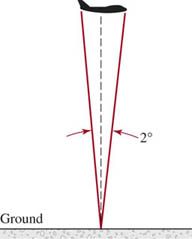
FIGURE 4.9.33 Airplane in Problem 39
40. The height of a gnomon (pin) of a sundial is 4 in. If it casts a 6-in. shadow, what is the angle of elevation of the sun?
41. Weather radar is capable of measuring both the angle of elevation to the top of a thunderstorm and its range (the horizontal distance to the storm). If the range of a storm is 90 km and the angle of elevation is 4°, can a passenger plane that is able to climb to 10 km fly over the storm?
42. Cloud ceiling is the lowest altitude at which solid cloud is present. The cloud ceiling at airports must be sufficiently high for safe takeoffs and landings. At night the cloud ceiling can be determined by illuminating the base of the clouds with a searchlight pointed vertically upward. If an observer is 1 km from the searchlight and the angle of elevation to the base of the illuminated cloud is 8°, find the cloud ceiling. See FIGURE 4.9.34. (During the day cloud ceilings are generally estimated by sight. However, if an accurate reading is required, a balloon is inflated so that it will rise at a known constant rate. Then it is released and timed until it disappears into the cloud. The cloud ceiling is determined by multiplying the rate by the time of the ascent; trigonometry is not required for this calculation.)
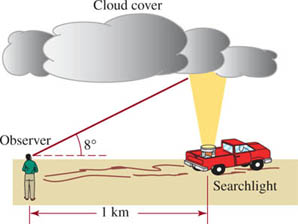
FIGURE 4.9.34 Searchlight in Problem 42
43. Assuming that the Earth is a sphere, show that Ce = Cecos θ, where Cθ is the circumference of the parallel of latitude at the latitude angle θ and Ce is the Earth’s circumference at the equator. See FIGURE 4.9.35. [Hint: R cos θ = r.]
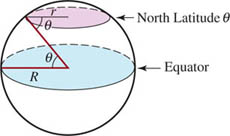
FIGURE 4.9.35 Earth in Problem 43
44. Use Problem 43 and the fact that the radius R of the Earth is 6400 km to find:
(a) the circumference of the Arctic Circle, which lies at 66°33' N (66.55° N) latitude,
(b) the distance “around the world” at the 58°40' N (58.67° N) latitude.
45. The distance between the Earth and the Moon varies as the Moon revolves around the Earth. At a particular time the geocentric parallax angle shown in FIGURE 4.9.36 is measured to be 1°. Calculate to the nearest hundred miles the distance between the center of the Earth and the center of the Moon at this instant. Assume that the radius of the Earth is 3963 miles.
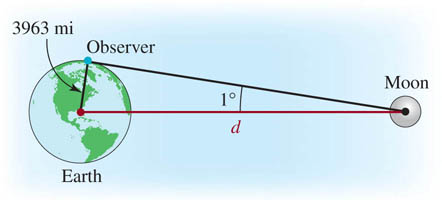
FIGURE 4.9.36 Angle in Problem 45
46. The final length of a volcanic lava flow seems to decrease as the elevation of the lava vent from which it originates increases. An empirical study of Mt. Etna gives the final lava flow length L in terms of elevation h by the formula
![]()

Mount Etna
where L is measured in kilometers and h is measured in meters. Suppose that a Sicilian village at elevation 750 m is on a 10° slope directly below a lava vent at 2500 m. See FIGURE 4.9.37. According to the formula, how close will the lava flow get to the village?
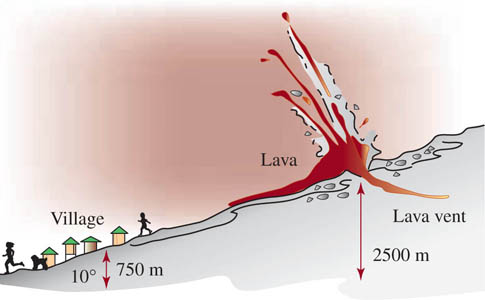
FIGURE 4.9.37 Lava flow in Problem 46

FIGURE 4.9.38 Weather balloon in Problem 47
47. As shown in FIGURE 4.9.38, two tracking stations S1 and S2 sight a weather balloon between them at elevation angles α and β, respectively. Express the height h of the balloon in terms of κ and β, and the distance c between the tracking stations. Asssume the tracking stations and the balloon lie in the same vertical plane.
48. An entry in a soapbox derby rolls down a hill. Using the information given in FIGURE 4.9.39, find the total distance d1 + d2 that the soapbox travels.

FIGURE 4.9.39 Soapbox in Problem 48
49. Recent History Most airplanes approach San Francisco International Airport (SFO) on a straight 3° glide path starting at a point 5.5 miles from the field. In the 1980s, the FAA experimented at SFO with a computerized two-segment approach where a plane approaches the field on a 6° glide path starting at a point 5.5 mi out and then switches to a 3° glide path at a point Q 1.5 mi from the point of touchdown. The purpose of this experimental approach was to reduce the noise of the planes over the outlying residential areas. Compare the height of a plane P' using the standard 3° approach with the height of a plane P using the experimental approach when both planes are 5.5 mi from the airport. See FIGURE 4.9.40.

FIGURE 4.9.40 Two glide paths in Problem 49
50. Ancient History In an article from the online encyclopedia Wikipedia, the height h of the Lighthouse of Alexandria, one of the Seven Wonders of the Ancient World built between 280 and 247 BCE, is estimated to have been between 393 ft and 450 ft. The article goes on to say that there are ancient claims that the light could be seen on the ocean up to 29 miles away. Use the right triangle in FIGURE 4.9.41 along with the two given heights h to determine the accuracy of the 29-mile claim. Assume that the radius of the Earth is r = 3963 mi and s is distance measured in miles on the ocean. [Hint: Use 1 ft and (4) of Section 4.1.]
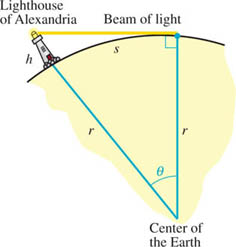
FIGURE 4.9.41 Lighthouse in Problem 50
In Problems 51–54, proceed as in Example 8 and translate the words into an appropriate function.
51. A tracking telescope, located 1.25 km from the point of a rocket launch, follows a vertically ascending rocket. Express the height h of the rocket as a function of the angle of elevation θ.
52. A searchlight one-half mile offshore illuminates a point P on the shore. Express the distance d from the searchlight to the point of illumination P as a function of the angle θ shown in FIGURE 4.9.42.

Artist’s rendering of the Lighthouse of Alexandria
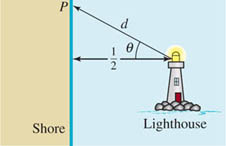
FIGURE 4.9.42 Searchlight in Problem 52
53. A statue is placed on a pedestal as shown in FIGURE 4.9.43. Express the viewing angle θ as a function of the distance x from the pedestal.
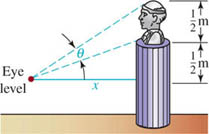
FIGURE 4.9.43 Viewing angle in Problem 53
54. A woman on an island wishes to reach a point R on a straight shore on the mainland from a point P on the island. The point P is 9 mi from the shore and 15 mi from point R. See FIGURE 4.9.44. If the woman rows a boat at a rate of 3 mi/h to a point Q on land, then walks the rest of the way at a rate of 5 mi/h, express the total time it takes the woman to reach point R as a function of the indicated angle θ. [Hint: Distance = rate × time.]
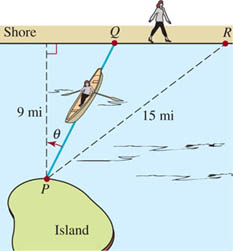
FIGURE 4.9.44 Woman rowing to shore in Problem 54
4.10 Law of Sines and Law of Cosines
![]() Introduction In Section 4.9 we saw how to solve right triangles. In this section we consider two techniques for solving general triangles.
Introduction In Section 4.9 we saw how to solve right triangles. In this section we consider two techniques for solving general triangles.
![]() Law of Sines Consider the triangle ABC, shown in FIGURE 4.10.1, with angles α β, and γ, and corresponding opposite sides BC, AC, and AB. If we know the length of one side and two other parts of the triangle, we can then find the remaining three parts. One way of doing this is by the Law of Sines.
Law of Sines Consider the triangle ABC, shown in FIGURE 4.10.1, with angles α β, and γ, and corresponding opposite sides BC, AC, and AB. If we know the length of one side and two other parts of the triangle, we can then find the remaining three parts. One way of doing this is by the Law of Sines.
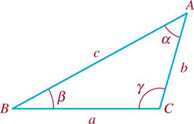
FIGURE 4.10.1. General triangle
THE LAW OF SINES
Suppose angles α, β and γ, and opposite sides of length a, b, and c are as shown in Figure 4.10.1. Then
![]()
Although the Law of Sines is valid for any triangle, we will derive it only for acute triangles—that is, a triangle in which all three angles α β and γ are less than 90°. As shown in FIGURE 4.10.2, let h be the length of the altitude from vertex A to side BC. Since the altitude is perpendicular to the base BC it determines two right triangles. Consequently, we can write
![]()

FIGURE 4.10.2 Acute triangle
Thus (2) gives
![]()
Equating the two expressions in (3) gives c sin β = b sin γ so that

If we use the altitude from the vertex C to the side AB, it follows in the same manner that
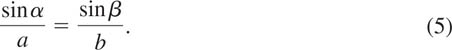
Combining (4) and (5) yields the result in (1).
EXAMPLE 1 Determining the Parts of a Triangle
Find the remaining parts of the triangle shown in FIGURE 4.10.3.
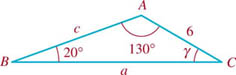
FIGURE 4.10.3 Triangle in Example 1
Solution Let β = 20°, α = 130°, and b = 6. It follows then that γ = 180° -20° - 130° = 30°. From (1) we see that
![]()
We use the first equality in (6) to solve for a:
![]()
The second equality in (6) gives c:
![]()
![]()
EXAMPLE 2 Height of a Building
A building is situated on the side of a hill that slopes downward at an angle of 15°. The Sun is uphill from the building at an angle of elevation of 42°. Find the building’s height if it casts a shadow 36 ft long.
Solution Denote the height of the building on the downward slope by h and construct a right triangle QPS as shown in FIGURE 4.10.4. Now α + 15° = 42° so that α = 27°. Since ΔQPS is a right triangle, γ = 90° - 42° = 48°. From the Law of Sines (1),
![]()

FIGURE 4.10.4 Triangle QPS in Example 2
![]()
In Examples 1 and 2, where we were given two angles and a side, each triangle had a unique solution. However, this may not always be true for triangles where we know two sides and an angle opposite one of these sides. The next example illustrates the latter situation.
EXAMPLE 3 Given Parts Determine Two Triangles
Find the remaining parts of the triangle with β = 50°, b = 5, and c = 6.
Solution From the Law of Sines, we have
![]()
From a calculator set in degree mode, we obtain γ ≈ 66.82°. At this point it is essential to recall that the sine function is also positive for second quadrant angles. In other words, there is another angle satisfying 0° ≤ θ ≤ 180° for which sin θ ≈ 0.9193. Using 66.82° as a reference angle we find the second quadrant angle to be 180° - 66.82° = 113.18°. Therefore, the two possibilities for γ are γ1 ≈ 66.82° and θ2 ≈ 113.18°. Thus, as shown in FIGURE 4.10.5, there are two possible triangles ABC1 and ABC2 satisfying the given three conditions.
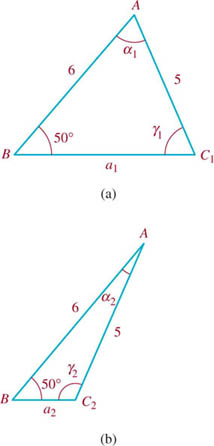
FIGURE 4.10.5 Triangles in Example 3
To complete the solution of triangle ABC1 (Figure 4.10.5(a)), we first find a1 = 180° – θ1 – β ≈ 63.18°. To find the side opposite this angle we use

To complete the solution of triangle ABC2 (Figure 4.10.5(b)), we find a2 = 180° – θ2 – β ≈ 16.82°. Then from

![]()
![]() Ambiguous Case When solving triangles, the situation where two sides and an angle opposite one of these sides are given is called the ambiguous case. We have just seen in Example 3 that the given information may determine two different triangles. In the ambiguous case other complications can arise. For instance, suppose that the length of sides AB and AC (that is, c and b) and the angle β in triangle ABC are specified. As shown in FIGURE 4.10.6, we draw the angle β and mark off side AB with length c to locate the vertices A and B. The third vertex C is located on the base by drawing an arc of a circle of radius b (the length of AC) with center A. As shown in FIGURE 4.10.7, there are four possible outcomes of this construction:
Ambiguous Case When solving triangles, the situation where two sides and an angle opposite one of these sides are given is called the ambiguous case. We have just seen in Example 3 that the given information may determine two different triangles. In the ambiguous case other complications can arise. For instance, suppose that the length of sides AB and AC (that is, c and b) and the angle β in triangle ABC are specified. As shown in FIGURE 4.10.6, we draw the angle β and mark off side AB with length c to locate the vertices A and B. The third vertex C is located on the base by drawing an arc of a circle of radius b (the length of AC) with center A. As shown in FIGURE 4.10.7, there are four possible outcomes of this construction:
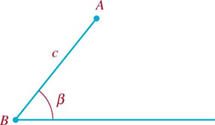
FIGURE 4.10.6 Horizontal base, the angle β, and side AB
- The arc does not intersect the base and no triangle is formed.
- The arc intersects the base in two distinct points C1 and C2 and two triangles are formed (as in Example 3).
- The arc intersects the base in one point and one triangle is formed.
- The arc is tangent to the base and a single right triangle is formed.

FIGURE 4.10.7 Solution possibilities for the ambiguous case in the Law of Sines
EXAMPLE 4 Determining the Parts of a Triangle
Find the remaining parts of the triangle with β = 40°, b = 5, and c = 9.
Solution From the Law of Sines (1), we have
![]()
Since the sine of any angle must be between –1 and 1, sin γ ≈ 1.1570 is impossible. This means the triangle has no solution; the side with length b is not long enough to reach the base. This is the case illustrated in Figure 4.10.7(a).
![]()
Triangles for which we know either three sides or two sides and the included angle (that is, the angle formed by the given sides) cannot be solved directly using the Law of Sines. The method we consider next can be used to solve triangles in these two cases.
![]() Pythagorean Theorem In a right triangle, such as the one shown in FIGURE 4.10.8, the length c of the hypotenuse is related to the lengths a and b of the other two sides by the Pythagorean theorem
Pythagorean Theorem In a right triangle, such as the one shown in FIGURE 4.10.8, the length c of the hypotenuse is related to the lengths a and b of the other two sides by the Pythagorean theorem
![]()
This last equation is a special case of a general formula that relates the lengths of the sides of any triangle.

FIGURE 4.10.8 Right triangle
![]() Law of Cosines Suppose again that the triangle ABC, shown in Figure 4.10.1, represents a general triangle. The generalization of (7) is called the Law of Cosines.
Law of Cosines Suppose again that the triangle ABC, shown in Figure 4.10.1, represents a general triangle. The generalization of (7) is called the Law of Cosines.
THE LAW OF COSINES
Suppose angles a, β, and γ and opposite sides a, b, and c are as shown in Figure 4.10.1. Then
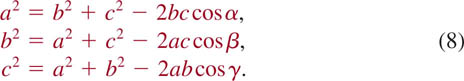
Like (1), the Law of Cosines is valid for any triangle. But for convenience, we will derive the last two equations in (8) using the same acute triangle given in Figure 4.10.2. However, this time let P denote the point where the altitude from the vertex A intersects side BC. Then, since both ΔBPA and ΔCPA in FIGURE 4.10.9 are right triangles we have from (7),
![]()
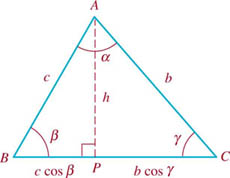
FIGURE 4.10.9 Acute triangle
Now the length of BC is α = c cos β + b cos θ so that
![]()
Moreover, from (10),
![]()
Substituting (11) and (12) into (9) and simplifying yields the third equation in (8):
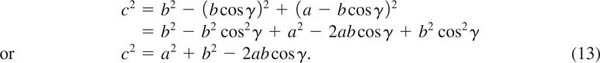
Note that equation (13) reduces to the Pythagorean theorem (7) when θ = 90°.
Similarly, if we use b cosγ = a - c cos β and h2 = c2 - (c cos β)2 to eliminate b cos γ and h2 in (10) we obtain the second equation in (8).
EXAMPLE 5 Determining the Parts of a Triangle
Find the remaining parts of the triangle shown in FIGURE 4.10.10.
Solution First, if we call the unknown side b and identify α = 12, c = 10, and β = 26°, then from the second equation in (8) we can write
![]()
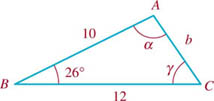
FIGURE 4.10.10 Triangle in Example 5
Therefore, b2 ≈ 28.2894 and b ≈ 5.32.
Next, we use the Law of Cosines to determine the remaining angles in the triangle in Figure 4.10.10. If γ is the angle at the vertex C, then the third equation in (8) gives
![]()
With the aid of a calculator we find γ ≈ 55.51°. Note that since the cosine of an angle between 90° and 180° is negative, there is no need to consider two possibilities as we did in Example 3. Finally, the angle at the vertex A is α = 180° – β – γ or a ≈ 98.49°. ¦
![]()
In Example 5, observe that after b is found, we know two sides and an angle opposite one of these sides. Hence we could have used the Law of Sines to find the angle γ.
In the next example we consider the case in which the lengths of the three sides of a triangle are given.
EXAMPLE 6 Determining the Angles in a Triangle
Find the angles a, β, and γ in the triangle shown in FIGURE 4.10.11.
Solution We use the Law of Cosines to find the angle opposite the longest side:
![]()
A calculator then gives θ ≈ 87.27°. Although we could use the Law of Cosines, we choose to find θ by the Law of Sines:

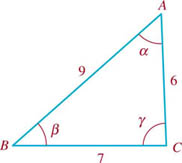
FIGURE 4.10.11 Triangle in Example 6
Since γ is the angle opposite the longest side it is the largest angle in the triangle, so β must be an acute angle. Thus, sin β ≈ 0.6659 yields β ≈ 41.75°. Finally, from α = 180° – β – γ we find a ≈ 50.98°.
![]()
![]() Bearing In navigation directions are given using bearings. A bearing designates the acute angle that a line makes with the north–south line. For example, FIGURE 4.10.12(a) illustrates a bearing of S40°W, meaning 40 degrees west of south. The bearings in Figures 4.10.12(b) and 4.10.12(c) are N65°E and S80°E, respectively.
Bearing In navigation directions are given using bearings. A bearing designates the acute angle that a line makes with the north–south line. For example, FIGURE 4.10.12(a) illustrates a bearing of S40°W, meaning 40 degrees west of south. The bearings in Figures 4.10.12(b) and 4.10.12(c) are N65°E and S80°E, respectively.
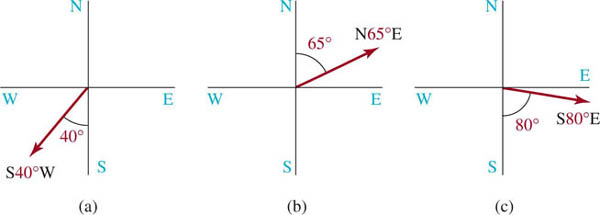
FIGURE 4.10.12 Three examples of bearings
EXAMPLE 7 Bearings of Two Ships
Two ships leave a port at 7:00 A.M., one traveling at 12 knots (nautical miles per hour) and the other at 10 knots. If the faster ship maintains a bearing of N47°W and the other ship maintains a bearing of S20°W, what is their separation (to the nearest nautical mile) at 11:00 A.M. that day?
Solution Since the elapsed time is 4 hours, the faster ship has traveled 4 · 12 = 48 nautical miles from port and the slower ship 4 · 10 = 40 nautical miles. Using these distances and the given bearings, we can sketch the triangle (valid at 11:00 A.M.) shown in FIGURE 4.10.13. In the triangle c denotes the distance separating the ships and γ is the angle opposite that side. Since 47° + γ + 20° = 180° we find γ = 113°. Finally, the Law of Cosines
![]()
gives c2 ≈ 5404.41 or c ≈ 73.51. Thus the distance between the ships (to the nearest nautical mile) is 74 nautical miles. ¦
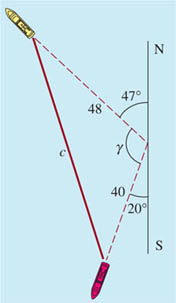
FIGURE 4.10.13 Ships in Example 7
![]()
NOTES FROM THE CLASSROOM
(i) An important first step in solving a triangle is determining which of the three approaches we have discussed to use: right triangle trigonometry, the Law of Sines, or the Law of Cosines. The following table describes the various types of problems and gives the most appropriate approach for each. The term oblique refers to any triangle that is not a right triangle.

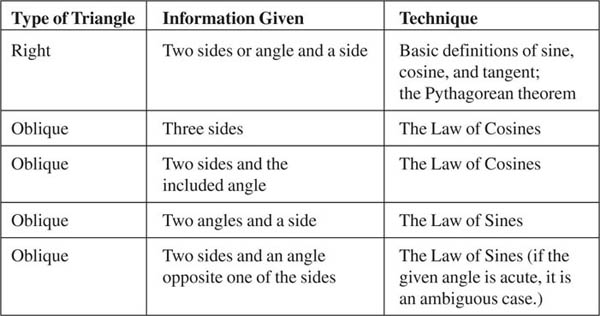
(ii) Here are some additional bits of advice for solving triangles.
- Students will frequently use the Law of Sines when a right triangle trigonometric function could have been used. A right triangle approach is the simplest and most efficient.
- When three sides are given, check first to see whether the length of the longest side is greater than or equal to the sum of the lengths of the other two sides. If it is, there can be no solution (even though the given information indicates a Law of Cosines approach). This is because the shortest distance between two points is the length of the line segment joining them.
- In applying the Law of Sines, if you obtain a value greater than 1 for the sine of an angle, there is no solution.
- In the ambiguous case of the Law of Sines, when solving for the first unknown angle, you must consider both the acute angle found from your calculator and its supplement as possible solutions. The supplement will be a solution if the sum of the supplement and the angle given in the triangle is less than 180°.
4.10 Exercises
Answers to selected odd-numbered problems begin on page ANS–16.
![]() In Problems 1–32, refer to Figure 4.10.1.
In Problems 1–32, refer to Figure 4.10.1. ![]()
In Problems 1–10, use the Law of Sines to solve the triangle.
1. α = 80°, β = 20°, b = 7
2. α = 60°, β = 15°, c = 30
3. β = 37°, θ = 51°, α = 5
4. α = 30°, θ = 75°, α = 6
5. β = 72°, b = 12, c = 6
6. α = 120°, α = 9, c = 4
7. γ = 62°, b = 7, c = 4
8. β = 110°, θ = 25°, α = 14
9. γ = 15°, α = 8, c = 5
10. α = 55°, α = 20, c = 18
In Problems 11–20, use the Law of Cosines to solve the triangle.
11. γ = 65°, α = 5, b = 8
12. β = 48°, α = 7, c = 6
13. a = 8, b = 10, c = 7
14. γ = 31.5°, α = 4, b = 8
15. γ = 97.33°, α = 3, b = 6
16. a = 7, b = 9, c = 4
17. a = 11,b = 9.5, c = 8.2
18. α = 162°, b = 11, c = 8
19. a = 5, b = 7, c = 10
20. a = 6, b = 5, c 7
In Problems 21–32, use either the Law of Sines or the Law of Cosines as appropriate to solve the triangle.
21. γ = 150°, b = 7, c = 5
22. a = 5, b = 12, c = 13
23. a = 3, b = 4, c = 5
24. α = 35°, a = 9, b = 12
25. β = 30°, a = 10, b = 7
26. α = 140°, θ = 20, c = 12
27. a = 6, b = 8, c = 12
28. β = 130°, a = 4, c = 7
29. α = 22°, b = 3, c = 9
30. α = 75°, 7 = 45°, b = 8
31. α = 20°, a = 8, c = 27
32. β = 100°, a = 22.3, b = 16.1
Miscellaneous Applications
In Problems 33–44, use either the Law of Sines or the Law of Cosines as appropriate.
33. Length of a Pool A 10-ft rope that is available to measure the length between two points A and B at opposite ends of a kidney-shaped swimming pool is not long enough. A third point C is found such that the distance from A to C is 10 ft. It is determined that angle ACB is 115° and angle ABC is 35°. Find the distance from A to B. See FIGURE 4.10.14.
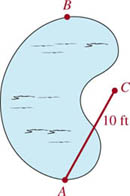
FIGURE 4.10.14 Pool in Problem 33
34. Width of a River Two points A and B lie on opposite sides of a river. Another point C is located on the same side of the river as B at a distance of 230 ft from B. If angle ABC is 105° and angle ACB is 20°, find the distance across the river from A to B.
35. Length of a Telephone Pole A telephone pole makes an angle of 82° with the level ground. As shown in FIGURE 4.10.15, the angle of elevation of the Sun is 76°. Find the length of the telephone pole if its shadow is 3.5 m. (Assume that the tilt of the pole is away from the sun and in the same plane as the pole and the sun.)
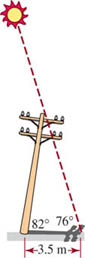
FIGURE 4.10.15 Telephone pole in Problem 35
36. Not on the Level A man 5 ft 9 in. tall stands on a sidewalk that slopes down at a constant angle. A vertical street lamp directly behind him causes his shadow to be 25 ft long. The angle of depression from the top of the man to the tip of his shadow is 31°. Find the angle α as shown in FIGURE 4.10.16, that the sidewalk makes with the horizontal.

FIGURE 4.10.16 Sloping sidewalk in Problem 36
37. How High? If the man in Problem 36 is 20 ft down the sidewalk from the lamppost, find the height of the light above the sidewalk.
38. Plane with an Altitude Angles of elevation to an airplane are measured from the top and the base of a building that is 20 m tall. The angle from the top of the building is 38°, and the angle from the base of the building is 40°. Find the altitude of the airplane.
39. How Far? A ship sails due west from a harbor for 22 nautical miles. It then sails S62°W for another 15 nautical miles. How far is the ship from the harbor?
40. How Far Apart? Two hikers leave their camp simultaneously, taking bearings of N42°W and S20°E, respectively. If they each average a rate of 5 km/h, how far apart are they after 1 hr?
41. Bearings On a hiker’s map point A is 2.5 in. due west of point B and point C is 3.5 in. from B and 4.2 in. from A, respectively. See FIGURE 4.10.17. Find (a) the bearing of A from C, (b) the bearing of B from C.

FIGURE 4.10.17 Triangle in Problem 41
42. How Long Will it Take? Two ships leave port simultaneously, one traveling at 15 knots and the other at 12 knots. They maintain bearings of S42°W and S10°E, respectively. After 3 hrs the first ship runs aground and the second ship immediately goes to its aid.
(a) How long will it take the second ship to reach the first ship if it travels at 14 knots?
(b) What bearing should it take?
43. A Robotic Arm A two-dimensional robot arm “knows” where it is by keeping track of a “shoulder” angle α and an “elbow” angle β. As shown in FIGURE 4.10.18, this arm has a fixed point of rotation at the origin. The shoulder angle is measured counterclockwise from the x-axis, and the elbow angle is measured counterclockwise from the upper to the lower arm. Suppose that the upper and lower arms are both of length 2 and that the elbow angle β is prevented from “hyper-extending” beyond 180°. Find the angles α and β that will position the robot’s hand at the point (1, 2).

FIGURE 4.10.18 Robotic arm in Problem 43
44. Which Way? Two lookout towers are situated on mountain tops A and B, 4 mi from each other. A helicopter firefighting team is located in a valley at point C, 3 mi from A and 2 mi from B. Using the line between A and B as a reference, a lookout spots a fire at an angle of 40° from tower A and 82° from tower B. See FIGURE 4.10.19. At what angle, measured from CB, should the helicopter fly in order to head directly for the fire?

FIGURE 4.10.19 Fire in Problem 44
For Discussion
45. Heron’s Formula Use the Law of Cosines to derive the formula
![]()
for the area of a triangle with sides of lengths a, b, c, and ![]() . This formula is named after the Greek mathematician and inventor Heron of Alexandria (c. 20–62 C.E.) but should actually be credited to Archimedes. [Hint: Use the third formula in (8) to solve for cos γ.]
. This formula is named after the Greek mathematician and inventor Heron of Alexandria (c. 20–62 C.E.) but should actually be credited to Archimedes. [Hint: Use the third formula in (8) to solve for cos γ.]
46. Garden Plot Use Heron’s formula in Problem 45 to find the area of a triangular garden plot if the lengths of the three sides are 25, 32, and 41 m.
47. Corner Lot Find the area of the irregular corner lot shown in FIGURE 4.10.20. [Hint: Divide the lot into two triangular lots as shown and then find the area of each triangle. Use Heron’s formula in Problem 45 for the area of the acute triangle.]

FIGURE 4.10.20 Corner lot in Problem 47
48. More Area Use Heron’s formula in Problem 45 to find the area of a triangle with vertices located at (3, 2), (−3, −6), and (0, 6) in a rectangular coordinate system.
49. Blue Man The effort in climbing a flight of stairs depends largely on the flexing angle of the leading knee. A simplified blue stick-figure model of a person walking up a staircase indicates that the maximum flexing of the knee occurs when the back leg is straight and the hips are directly over the heel of the front foot. See FIGURE 4.10.21. Show that
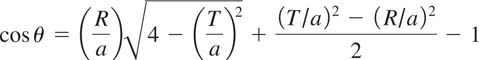
where θ is the knee joint angle, 2a is the length of the leg, R is the rise of a single stair step, and T is the width of a step. [Hint: Let h be the vertical distance from hip to heel of the leading leg, as shown in the figure. Set up two equations involving h: one by applying the Pythagorean theorem to the right triangle whose hypotenuse consists of the back leg of length 2a and the other by using the Law of Cosines on the angle θ. Then eliminate h and solve for cos θ.]
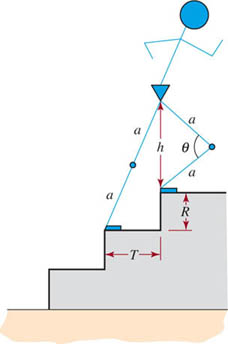
FIGURE 4.10.21 Blue man in Problem 49
50. Help! One Coast Guard vessel is located 4 nautical miles due south of a second Coast Guard vessel when they receive a distress signal from a sailboat. To offer assistance, the first vessel sails on a bearing of S50°E at 5 knots and the second vessel sails S10°E at 10 knots. Which one of the Coast Guard vessels will reach the sailboat first?
4.11 The Limit Concept Revisited

![]() Introduction As we saw in Section 2.9, the fundamental motivating problem of differential calculus, find a tangent line to the graph of the function, is answered by the concept of a limit. In that section we purposely kept the discussion about limits at an intuitive level; our emphasis was on reviewing the appropriate algebra, such as factoring and rationalization, necessary to be able to compute a limit analytically. In the study of the calculus of the trigonometric functions you will, of course, be expected to compute limits involving trigonometric functions. As the examples in this section will illustrate, computation of trigonometric limits entail both algebraic manipulations and knowledge of basic trigonometric identities.
Introduction As we saw in Section 2.9, the fundamental motivating problem of differential calculus, find a tangent line to the graph of the function, is answered by the concept of a limit. In that section we purposely kept the discussion about limits at an intuitive level; our emphasis was on reviewing the appropriate algebra, such as factoring and rationalization, necessary to be able to compute a limit analytically. In the study of the calculus of the trigonometric functions you will, of course, be expected to compute limits involving trigonometric functions. As the examples in this section will illustrate, computation of trigonometric limits entail both algebraic manipulations and knowledge of basic trigonometric identities.
We begin with a fundamental limit result for the sine function.
![]() An Important Trigonometric Limit To do the calculus of the trigonometric functions, sin x, cos x, tan x, and so on, it is important to realize that the variable x is areal number or an angle x measured in radians. With that in mind, consider the numerical values of (sin x)/x as x approaches 0 from the right (x → 0+) given in the table that follows.
An Important Trigonometric Limit To do the calculus of the trigonometric functions, sin x, cos x, tan x, and so on, it is important to realize that the variable x is areal number or an angle x measured in radians. With that in mind, consider the numerical values of (sin x)/x as x approaches 0 from the right (x → 0+) given in the table that follows.
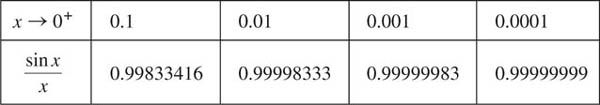
It is easy to see that the same results given in the table hold as x→ 0-. Because sin x is an odd function, for x > 0 and – x < 0 we have sin(–x) = –sin x and as a consequence ![]() . In other words, when the value of x is small in absolute value
. In other words, when the value of x is small in absolute value
![]()
While numerical calculations such as this do not constitute a proof, they do suggest that ![]() as x → 0. Using the limit symbol, we have motivated the following result
as x → 0. Using the limit symbol, we have motivated the following result
![]()
Problem 40 in Exercises 4.11 gives a guided tour through the basic steps of a proof of (1) that is usually presented in calculus.
![]() Important
Important
In this discussion we make the same assumption that we did in Sections 1.5 and 2.9, namely, that all limits under consideration actually exist. Everything that we do, algebraic manipulations, taking limits of products and quotients in the examples in this section is predicated on this assumption.
Other limits of importance are

The results (2) and (3) are immediate consequences of the fact that f(x) = sin x and g(x) = cos x are continuous functions for all x. As we have seen in Section 4.3 the graphs of sin x and cos x are smooth and unbroken. For example, from (2),
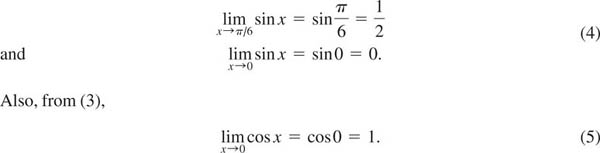
The results in (1), (2), and (3) are used often to compute other limits. As in Section 1.5 many of the limits considered in this section are limits of fractional expressions where both the numerator and the denominator are approaching 0. Recall, these kinds of limits are said to have the indeterminate form 0/0. Note that the limit (1) is of this indeterminate form.
EXAMPLE 1 Using (1)
Find ![]()
Solution We rewrite the fractional expression as two fractions with the same denominator x:
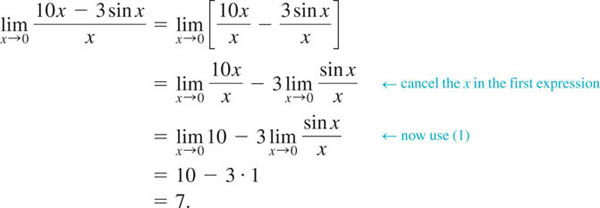
![]()
EXAMPLE 2 Using the Double-Angle Formula
Find ![]()
Solution To evaluate the given limit, we make use of the double-angle formula sin 2x = 2sin xcos xof Section 4.5 and the results in (1) and (5):

Thus, ![]() (6)
(6)
![]()
![]() Using a Substitution We are often interested in limits similar to that considered in Example 2. But if we wish to find, say,
Using a Substitution We are often interested in limits similar to that considered in Example 2. But if we wish to find, say, ![]() the procedure employed in Example 2 breaks down at a practical level since we have not developed a trigonometric identity for sin 5x. There is an alternative procedure that allows us to quickly find
the procedure employed in Example 2 breaks down at a practical level since we have not developed a trigonometric identity for sin 5x. There is an alternative procedure that allows us to quickly find ![]() , where k ≠ 0 is any real constant, by simply changing the variable by means of a substitution. If we let t = kx,then x = t/k. Notice that as x → 0 then necessarily t → 0. Thus we can write
, where k ≠ 0 is any real constant, by simply changing the variable by means of a substitution. If we let t = kx,then x = t/k. Notice that as x → 0 then necessarily t → 0. Thus we can write

Thus we have proved the general result
![]()
Hence ![]() . See Problem 25 in Exercises 4.11.
. See Problem 25 in Exercises 4.11.
EXAMPLE 3 Trigonometric Limit
Find ![]()
Solution Using the definition tan x = sin x/cos x we can write
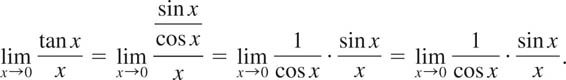
From (5) and (1) we know that cos x→ and (sin x)/x→1 as x →0, and so the preceding line becomes
![]()
![]()
EXAMPLE 4 Using a Pythagorean Identity
Find ![]()
Solution To compute this limit we start with a bit of algebraic cleverness by multiplying the numerator and denominator by the conjugate factor of the numerator. Next we use the fundamental Pythagorean identity sin2x + cos2x = 1 in the form 1 - cos2x = sin2x:
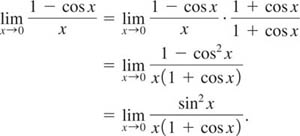
For the next step we resort back to algebra to rewrite the fractional expression as a product, then use the results in (1), (4), and (5):
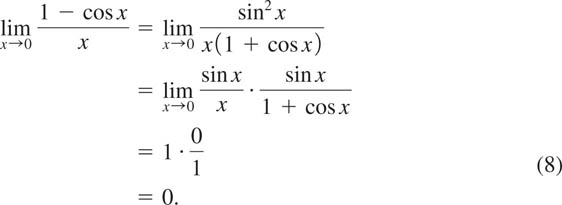
That is, ![]()
![]()
From (8) we obtain a limit result that is used in calculus to find the derivatives of the sine and cosine functions. Since the limit in (8) is equal to 0, we can write
![]()
Dividing by - 1 then gives
![]()
![]() The Calculus Connection In Section 2.9 we saw that the derivative of a function y = f(x) is the function f′(x) defined by a limit of a difference quotient:
The Calculus Connection In Section 2.9 we saw that the derivative of a function y = f(x) is the function f′(x) defined by a limit of a difference quotient:

In computing this limit we shrink h to zero, but x is held fixed. Recall too, if a number x = a is in the domains of f and f′ n f(a) is the y-coordinate of the point of tangency (a, f(a)) and f' (a) is the slope of the tangent line at that point.
![]() Derivatives of f(x) = sin x and f(x) = cos x To find the derivative of f(x) = sin x we use the four-step process illustrated in Example 3 of Section 2.9. In the first step we use from Section 4.5 the sum formula for the sine function:
Derivatives of f(x) = sin x and f(x) = cos x To find the derivative of f(x) = sin x we use the four-step process illustrated in Example 3 of Section 2.9. In the first step we use from Section 4.5 the sum formula for the sine function:
![]()
(i) With x and h playing the parts of x1 and x2, we have from (11):
![]()
(ii) 
As we see in the next line, we cannot cancel the h’s in the difference quotient, but we can rewrite the expression to make use of the limit results in (1) and (9).
(iii) 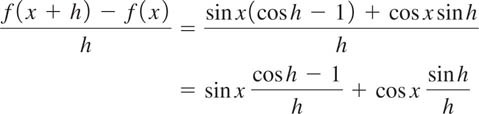
(iv) In this line, the symbol h plays the part of the symbol x in (1) and (9):
![]()
From the limit results in (1) and (9), the last line is the same as

In summary:
![]()
It is left to you the student to show that:
![]()
See Problems 23 and 24 in Exercises 4.11.
EXAMPLE 5 Equation of a Tangent Line
Find an equation of the tangent line to the graph of f(x) = sin x at x = 4p/3.
Solution We start by finding the point of tangency. From
![]()
we see that the point of tangency is ![]() . The slope of the tangent line at that point is the derivative of f(x) = sin x evaluated at the x-coordinate. From (12) we know that f'(x) = cos x and so the slope at
. The slope of the tangent line at that point is the derivative of f(x) = sin x evaluated at the x-coordinate. From (12) we know that f'(x) = cos x and so the slope at ![]() is
is
![]()
From the point-slope form of a line, an equation of the tangent line is See FIGURE 4.11.1.
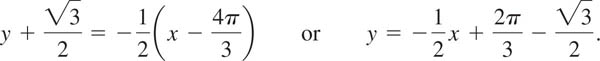
![]()

FIGURE 4.11.1 Tangent line in Example 5
4.11 Exercises
Answers to selected odd-numbered problems begin on page ANS–16.
In Problems 1–18, use the results in (1), (2), (3), (7), and (9) to find the indicated limit.
1. ![]()
2. ![]()
3. ![]()
4. ![]()
5. ![]()
6. ![]()
7. ![]()
8. ![]()
9. ![]()
10. ![]()
11. ![]()
12. ![]()
13. ![]()
14. ![]()
15. ![]()
16. ![]()
17. ![]()
18. ![]()
In Problems 19–22, proceed as in Example 5 to find an equation of the tangent line to the graph of f(x) = sin x at the indicated value of x.
19. x = 0
20. x = π/2
21. x = π/6
22. x = 2π/3
23. Proceed as on page 276–277 and find the derivative of f(x) = cos x.
24. Use the result of Problem 23 to find an equation of the tangent line to the graph of f(x) = cos x at x = π/3.
25. Use the facts that
![]()
to find the derivative of f(x) = sin5x.
26. Use the result of Problem 25 to find an equation of the tangent line to the graph of f(x) = sin5x at x = π.
Calculator/Computer Problems
In Problems 27 and 28, use a calculator or computer to estimate the given limit by completing each table. Round the entries in each table to eight decimal places.
27. ![]()

Explain why we do not have to consider x → 0–.
28. ![]()
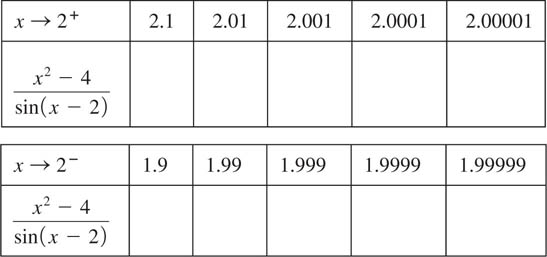
For Discussion
In Problems 29–36, discuss how to use the result in (1) along with some clever algebra, trigonometry, or a substitution to find the given limit.
29. ![]()
30. ![]()
31. ![]()
32. ![]()
33. ![]()
34. ![]()
35. ![]()
36. ![]()
37. Using what you have learned in Problems 29 and 36, find the limit
![]()
without the aid of the numerical table in Problem 28.
38. (a) Use a calculator to complete the following table.

(b) Find the limit ![]() using the method given in Example 4.
using the method given in Example 4.
(c) Discuss any differences that you observe between parts (a) and (b).
39. (a) A regular n-gon is an n-sided polygon inscribed in a circle; the polygon is formed by n equally spaced points on the circle. Suppose the polygon shown in FIGURE 4.11.2 represents a regular n-gon inscribed in a circle of radius r. Use trigonometry to show that the area A(n) of the n-gon is given by
![]()

FIGURE 4.11.2 Inscribed n-gon in Problem 39
(b) It stands to reason that the area A(n) approaches the area of the circle as the number of sides of the n-gon increases. Compute A100 and A1000.
(c) Let x = 2p /n in A(n) and note that as n → ∞ then x → 0. Use (1) of this section to show that lim ![]() .
.
40. Consider a circle centered at the origin O with radius 1. As shown in FIGURE 4.11.3(a), let the shaded region OPR be a sector of the circle with central angle t such that 0 < t < π/2. We see from Figures 4.11.3(a)–4.11.3(d) that
![]()
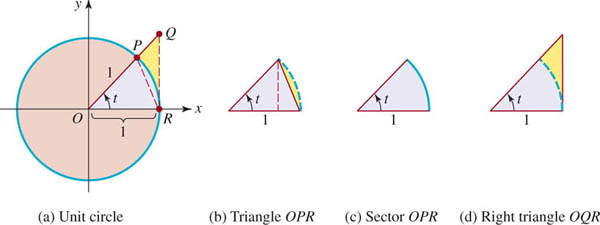
FIGURE 4.11.3 Unit circle in Problem 40
(a) Show that the area of ΔOPR is ![]() sin t and that the area of ΔOQR is
sin t and that the area of ΔOQR is ![]() tan t.
tan t.
(b) Since the area of a sector of a circle is ![]() r29, where r is its radius and θ is measured in radians, it follows that the area of sector OPR is
r29, where r is its radius and θ is measured in radians, it follows that the area of sector OPR is ![]() . Use this result, along with the areas in part (a), to show that the inequality in (12) yields
. Use this result, along with the areas in part (a), to show that the inequality in (12) yields
![]()
(c) Discuss how the preceding inequality proves (1) when we let t → 0+.
CHAPTER 4 Review Exercises
Answers to selected odd-numbered problems begin on page ANS–16.
In Problems 1–20, fill in the blanks.
1. π/5 radians =______degrees.
2. 10 degrees =______radians.
3. The exact values of the coordinates of the point P(t) on the unit circle corresponding to t = 5 π/6 are______.
4. The reference angle for 4 π/3 radians is______radians.
5. ![]()
6. In standard position, the terminal side of the angle ![]() radians lies in the ______ quadrant.
radians lies in the ______ quadrant.
7. If ![]() and θ is in quadrant IV, then sec θ =______.
and θ is in quadrant IV, then sec θ =______.
8. If tan t = 2 and t is in quadrant III, then cos t =______.
9. The y-intercept for the graph of the function y = 2 sec(x + p) is______.
10. The values of t in the interval [0, 2π] that satisfy ![]() are______.
are______.
11. If ![]() ,0 < u < p/2, and
,0 < u < p/2, and ![]() ,3π/2 < v < 2π, then cos(u + v) =______.
,3π/2 < v < 2π, then cos(u + v) =______.
12. If ![]() , then
, then ![]() .
.
13. A sine function with period 4 and amplitude 6 is given by______.
14. The first vertical asymptote for the graph of ![]() to the right of the y-axis is______.
to the right of the y-axis is______.
15. ![]() .
.
16. If ![]() .
.
17. The amplitude of ![]() is.
is.
18. ![]() .
.
19. The exact value of ![]() .
.
20. The period of the function ![]() is.
is.
In Problems 21–40, answer true or false.
21. If ![]() , then sin t = 3 and cos t = 4._____
, then sin t = 3 and cos t = 4._____
22. In a right triangle, If ![]() , then
, then ![]() ._____
._____
23. ![]()
24. There is no angle t such that sec t = ![]() .
.
25. sin(2 p – t) = –sin t _____
26. 1 + sec2 θ = tan2θ_____
27. (5, 0) is an x-intercept of the graph of y = 3sin p x._____
28. ![]() is a point on the graph of y = cot x._____
is a point on the graph of y = cot x._____
29. The range of the function y = csc x is( – 8, –1] ∪ [1, 8)._____
30. The graph of y = csc x does not intersect the y-axis._____
31. The line x = π/2 is a vertical asymptote for the graph of y = tanx._____
32. If tan(x + π) = 0.3, then tanx = 0.3.______.
33. For the sine function y = –2sin x we have –2 ≤ y ≤ 2._____
34. sin6x = 2 sin3xcos3x_____
35. The graph of ![]() is the graph of y = sin 2 x shifted π/3 units to the right._____
is the graph of y = sin 2 x shifted π/3 units to the right._____
36. Since tan(5π/4) = 1,then arctan(1) = 5π/4._____
37. ![]()
38. f(x) = arcsin x is not periodic._____
39. f(x) = x sin x is 2p periodic._____
40. f(x) = sin(cos x) is an even function._____
In Problems 41–46, find all t in the interval 30, 2p4 that satisfy the given equation.
41. cos tsin t – cos t + sin t – 1= 0
42. cos t – sin t = 0
43. 4 sin2t − 1=0
44. sin t = 2 tan t
45. sin t + cos t = 1
46. tant−3cott = 2
In Problems 47–50, solve the triangle satisfying the given conditions.
47. α = 30°, β = 70°, b = 10
48. γ = 145°, α = 25, c = 20
49. α = 51°, b = 20, c = 10
50. α = 4, b = 6, c = 3
In Problems 51–58, find the indicated value without using a calculator.
51. ![]()
52. arcsin(−1)
53. ![]()
54. ![]()
55. sin−1(sin π)
56. cos(arccos 0.42)
57. ![]()
58. arctan(cos π)
In Problems 59 and 60, write the given expression as an algebraic expression in x.
59. sin(arccos x)
60. sec(tan−1x)
In Problems 61–64, the given graph can be interpreted as a rigid/nonrigid transformation of the graph of y = sin x and of the graph of y = cos x. Find an equation of the graph using the sine function. Then find an equation of the same graph using the cosine function.
61. 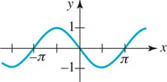
FIGURE 4.R.1 Graph for Problem 61
62. 
FIGURE 4.R.2 Graph for Problem 62
63. 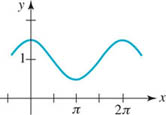
FIGURE 4.R.3 Graph for Problem 63
64. 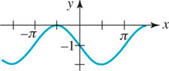
FIGURE 4.R.4 Graph for Problem 64
65. A surveyor 100 m from the base of an overhanging cliff measures a 28° angle of elevation from that point to the top of the cliff. See FIGURE 4.R.5. If the cliff makes an angle of 65° with the horizontal ground, determine its height h.
66. A rocket is launched from ground level at an angle of elevation of 43°. If the rocket hits a drone target plane flying at 20,000 ft, find the horizontal distance between the rocket launch site and the point directly beneath the plane. What is the straight-line distance between the rocket launch site and the target plane?

FIGURE 4.R.5 Cliff in Problem 65
67. A competition water-skier leaves a ramp at point R and lands at S. See FIGURE 4.R.6. A judge at point J measures an ∠RJS as 47°. If the distance from the ramp to the judge is 110 ft, find the length of the jump. Assume that ∠SRJ is 90°.
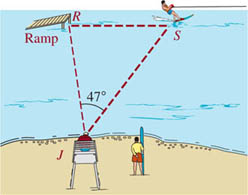
FIGURE 4.R.6 Water-skier in Problem 67
68. The angle between two sides of a parallelogram is 40°. If the lengths of the sides are 5 and 10 cm, find the lengths of the two diagonals.
69. A weather satellite orbiting the equator of the Earth at a height of H = 36,000 km spots a thunderstorm to the north at P at an angle of θ = 6.5° from its vertical. See FIGURE 4.R.7.

FIGURE 4.R.7 Satellite in Problem 69
(a) Given that the Earth’s radius is approximately R = 6370 km, find the latitude f of the thunderstorm.
(b) Show that angles θ and ø are related by
![]()
70. It can be shown that a basketball of diameter d approaching the basket from an angle θ to the horizontal will pass through a hoop of diameter D if D sin θ > d, where 0° ≤ θ ≤ 90°. See FIGURE 4.R.8. If the basketball has diameter 24.6 cm and the hoop has diameter 45 cm, what range of approach angles θ will result in a basket?
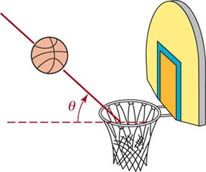
FIGURE 4.R.8 Basketball in Problem 70
71. Each of the 24 NAVSTAR Global Positioning System (GPS) satellites orbits the Earth at an altitude of h = 20,200 km. Using this network of satellites, an inexpensive hand-held GPS receiver can determine its position on the surface of the Earth to within 10 m. Find the greatest distance s (in km) on the surface of the Earth that can be observed from a single GPS satellite. See FIGURE 4.R.9. Take the radius of the Earth to be 6370 km. [Hint: Find the central angle θ subtended by s.]

FIGURE 4.R.9 GPS satellite in Problem 71
72. An airplane flying horizontally at a speed of 400 miles per hour is climbing at an angle of 6° from the horizontal. When it passes directly over a car traveling 60 miles per hour, it is 2 miles above the car. Assuming that the airplane and the car remain in the same vertical plane, find the angle of elevation from the car to the airplane after 30 minutes.
73. A house measures 45 ft from front to back. The roof measures 32 ft from the front of the house to the peak and 18 ft from the peak to the back of the house. See FIGURE 4.R.10. Find the angles of elevation of the front and back parts of the roof.

FIGURE 4.R.10 House in Problem 73
74. A regular five-sided polygon is called a regular pentagon. See Figure 4.11.2. Using radian measure, determine the sum of the vertex angles in a regular pentagon.
75. According to the online encyclopedia Wikipedia, a French helicopter flown by Jean Boulet attained the world’s record height of 12,440 m in 1972. What would the angle of elevation to the helicopter have been from a point P on the ground 2000 m from the point directly beneath the helicopter?
76. Consider the blue rectangle circumscribed around the red rectangle in FIGURE 4.R.11. With the aid of calculus it can be shown that the area of the blue rectangle is greatest when θ = π/4. Find this area in terms of a and b.

FIGURE 4.R.11 Rectangles in Problem 76
In Problems 77–84, translate the words into an appropriate function.
77. A 20-ft-long water trough has ends in the form of isosceles triangles with sides that are 4 ft long. See Figure 2.8.21 in Exercises 2.8. As shown in FIGURE 4.R.12, let 9 denote the angle between the vertical and one of the sides of a triangular end. Express the volume of the trough as a function of 2θ.

FIGURE 4.R.12 End of water trough in Problem 77
78. A person driving a car approaches a freeway sign as shown in FIGURE 4.R.13. Let 9 be her viewing angle of the sign and let x represent her horizontal distance (measured in feet) to that sign. Express θ as a function of x.
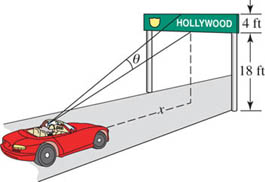
FIGURE 4.R.13 Freeway sign in Problem 78
79. As shown in FIGURE 4.R.14, a plank is supported by a sawhorse so that one end rests on the ground and the other end rests against a building. Express the length of the plank as a function of the indicated angle θ.

FIGURE 4.R.14 Plank in Problem 79
80. A farmer wishes to enclose a pasture in the form of a right triangle using 2000 ft of fencing on hand. See FIGURE 4.R.15. Show that the area of the pasture as a function of the indicated angle θ is
![]()

FIGURE 4.R.15 Pasture in Problem 80
81. Express the volume of the box shown in FIGURE 4.R.16 as a function of the indicated angle θ.
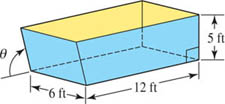
FIGURE 4.R.16 Box in Problem 81
82. A corner of an 8.5 in. × 11 in. piece of paper is folded over to the other edge of the paper as shown in FIGURE 4.R.17. Express the length L of the crease as a function of the angle θ shown in the figure.
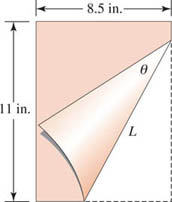
FIGURE 4.R.17 Folded paper in Problem 82
83. A gutter is to be made from a sheet of metal 30 cm wide by turning up the edges of width 10 cm along each side so that the sides make equal angles ø with the vertical. See FIGURE 4.R.18. Express the cross-sectional area of the gutter as a function of the angle ø.
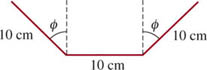
FIGURE 4.R.18 Gutter in Problem 83
84. A metal pipe is to be carried horizontally around a right-angled corner from a hallway 8 feet wide into a hallway that is 6 feet wide. See FIGURE 4.R.19. Express the length L of the pipe as a function of the angle θ shown in the figure.

FIGURE 4.R.19 Pipe in Problem 84
* The drawbridge shown in Figure 4.9.31, where the span is continuously balanced by a counterweight, is called a bascule bridge.