Appendix B
Square‐Wave Frequency Spectrum
B.1 Introduction
One of the most powerful tools in circuit analysis is the Fourier analysis. Signals that enter a circuit are often repetitive but not sinusoidal. Typical repetitive signals are square waves, triangle waves, trapezoids, or pulses. Square waves can have different leading and falling edges. A Fourier analysis provides an infinite series of sine waves with different amplitudes that when added together create the original waveform. The response to a repetitive waveform is found by summing the responses to all the individual sine waves (harmonics). In most practical applications, the response to the first three harmonics is sufficient to characterize the amplitude of the waveform. The assumption that must be made is that the circuit being analyzed is linear. This means that the system does not generate new harmonics.
B.2 Ideal Square Waves
Figure B.1 shows how an ideal square wave voltage is built up from sinusoids. If the square wave were shifted in time by 90 electrical degrees, the harmonics would all be cosines.

Figure B.1 The harmonics that make up a square wave.
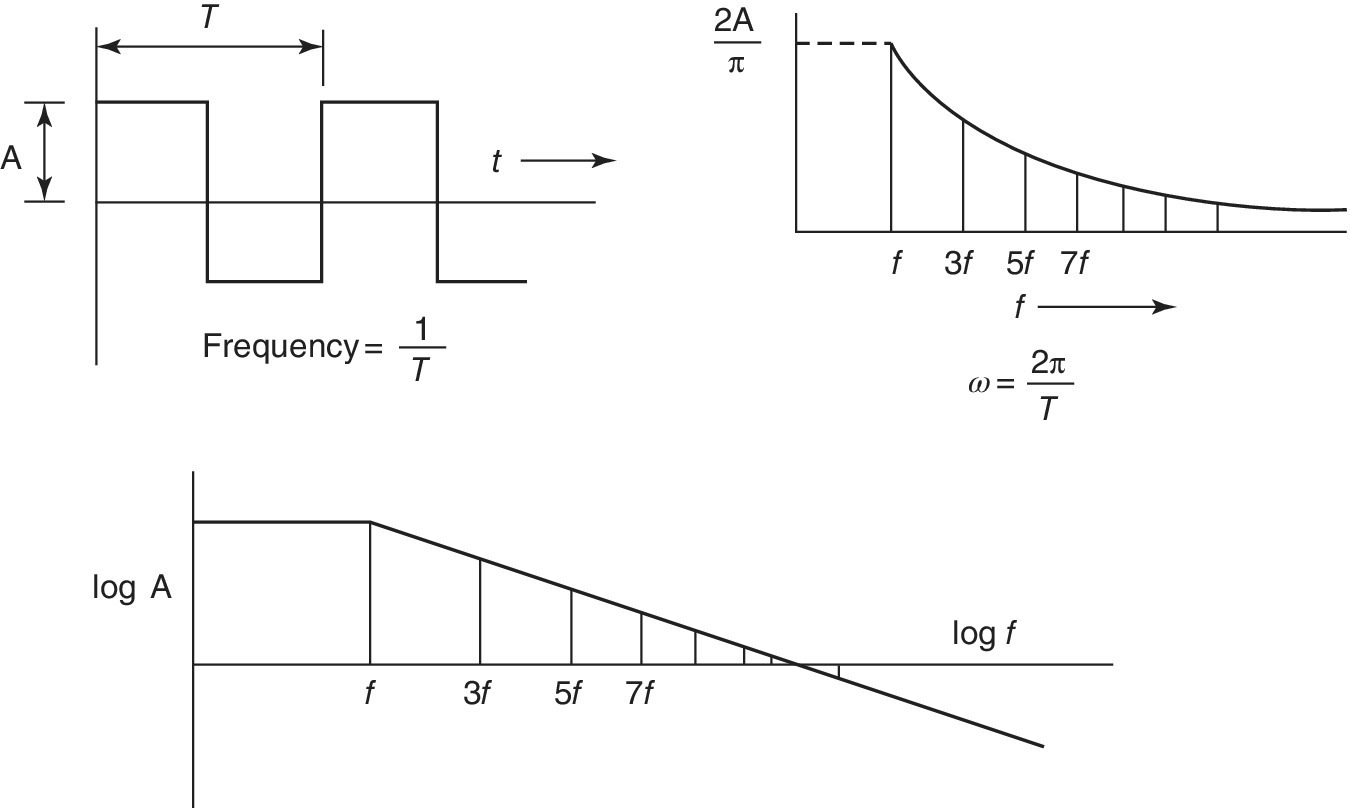
The graphs that follow show the nature of the spectrum for square waves. Practical logic signals are not fully repetitive, so the harmonic content shown in the figures is approximate. Note that the amplitude A is one‐half the peak‐to‐peak value. For 5‐V logic, A is 2.5 V. The envelope of amplitudes is presented only as a guide. There is no energy content except at the harmonic frequencies.
The amplitudes of the harmonics of an ideal square wave on both a linear and a logarithmic scale are shown in Figure B.2. The harmonics that make up an ideal square wave have amplitudes that are inversely proportional to frequency. On a logarithmic scale the amplitudes lie along a straight line with a negative slope of one. The fundamental frequency is simply 1/t, where t is the time of one full cycle. The amplitude of the fundamental or first harmonic sine wave voltage is
where

Figure B.2 The harmonics that make up a square wave plotted linearly and on a logarithmic scale.
The amplitude of the nth harmonic is
B.3 Square Waves with a Rise Time
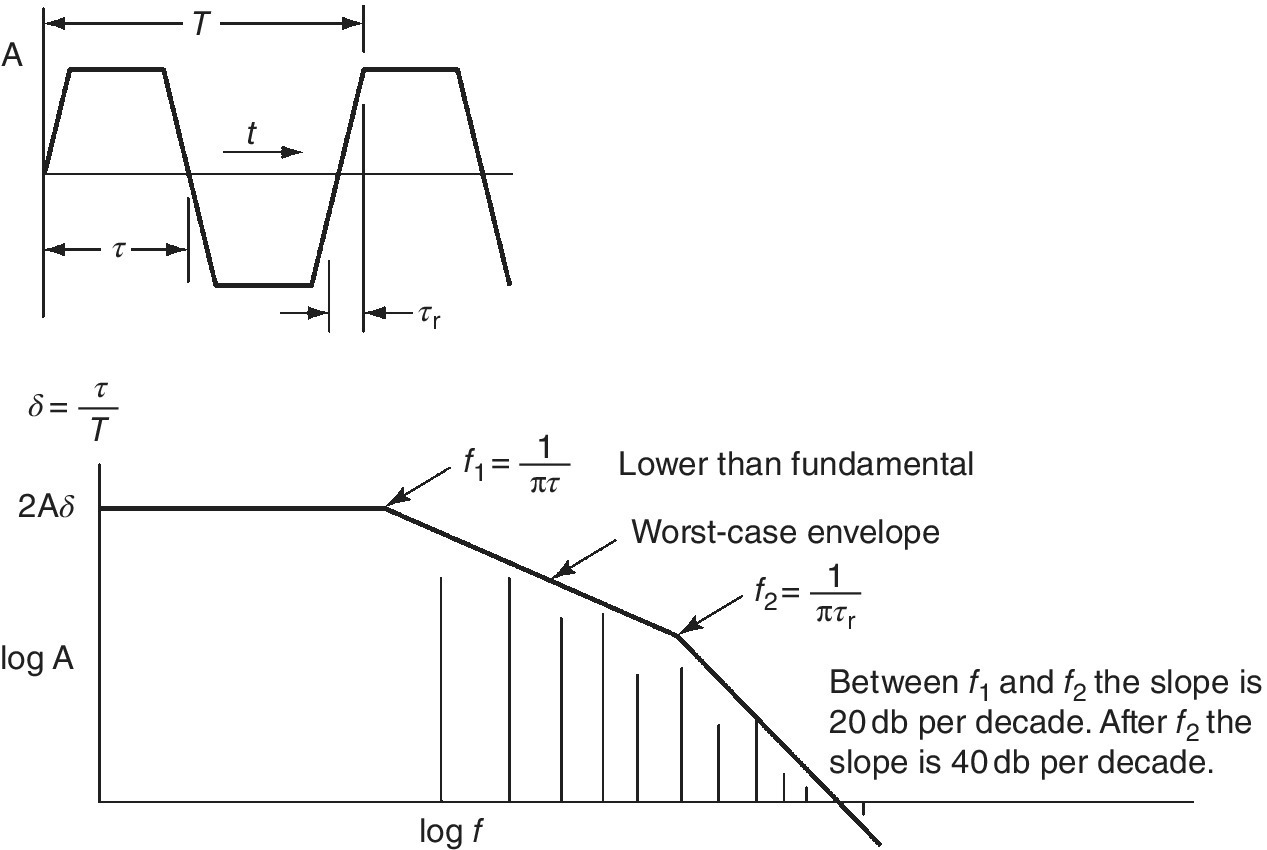
A repetitive square wave with a symmetric rise and fall time can be represented by a series of sine waves. The amplitudes of the harmonics determined in a Fourier analysis vary in a complex way. Figure B.3 shows that the harmonics have amplitudes that are contained under a logarithmic envelope with two slopes. These slopes intersect at frequencies that are called corner frequencies. The first or lower corner frequency is at ![]() where τ is the time between zero crossings. The amplitude of the harmonics above this frequency falls off proportional to frequency or 20 dB per decade. The second or upper corner frequency is at
where τ is the time between zero crossings. The amplitude of the harmonics above this frequency falls off proportional to frequency or 20 dB per decade. The second or upper corner frequency is at ![]() where τR is the rise time. Above this upper corner frequency the harmonic amplitudes fall off at the square of frequency or 40 dB per decade.
where τR is the rise time. Above this upper corner frequency the harmonic amplitudes fall off at the square of frequency or 40 dB per decade.

Figure B.3 The harmonics of a square wave with a finite rise time.
The two corner frequencies have significance when considered in terms of interference coupling. In general, coupling processes increase proportional to frequency. This would cancel the attenuation of harmonics in the frequency range 1/πτ to 1/πτR. This would imply that the interfering signal is effective out to the second corner frequency. Above 1/πτR, coupling falls off proportional to frequency. The impact of interference is thus related to its upper corner frequency.
