
Appendix C
CITY OF CHARLOTTESVILLE — MD&A AND STATISTICAL SECTION
CITY OF CHARLOTTESVILLE, VIRGINIA
Management’s Discussion and Analysis
Year Ended June 30, 2019
As management of the City of Charlottesville, Virginia, we offer readers this narrative overview and analysis of the financial activities of the City of Charlottesville, Virginia for the fiscal year ended June 30, 2019. Please read it in conjunction with the transmittal letter at the front of this report and the City’s financial statements, which follow this section. The intent of this discussion and analysis is to evaluate the City’s financial performance as a whole.
FINANCIAL HIGHLIGHTS
Government-wide
- The City’s total net position, on a government-wide basis excluding component units, totaled $196.0 million at June 30, 2019. Of this amount, $1.8 million is unrestricted.
- The City’s total net position increased by $10.8 million over the prior year. This increase is the sum of a $6.6 million increase, as restated, for the governmental net position and a $43 million increase in business-type net position.
Government Funds
- At June 30, 2019, the City’s governmental funds reported combined ending fund balances of $77.6 million, an increase of $3.4 million over the prior year. Approximately 38.0 percent, or $33.5 million, of this amount is unassigned.
- The General Fund, on a current financial resource measurement focus and the modified accrual basis of accounting, reported revenues over budget of $1,653,647, primarily due to several of the tax revenues (real estate, personal property, business license, and lodging) performing better than expected. The expenditures and other financing sources (net) finished out the year under budget primarily due City departments continued budget monitoring, which resulted in expenditures less than budget. Savings resulted from vacancies, efficiencies and staff s constant due diligence with city tax dollars.
- At the end of the fiscal year, unassigned fund balance for the General Fund was $33.5 million, or 17.1 percent of total General Fund expenditures and net transfers.
Long-term liabilities
- The City’s total long-term liabilities, consisting of general obligation bands, compensated absences, pension, and OPEB obligations decreased by $268.039 during the current fiscal year.
OVERVIEW OF THE FINANCIAL STATEMENTS
This discussion and analysis is intended to serve as an introduction to the City of Charlottesville’s basic financial statements. The City’s basic financial statements comprise the following three components:
- Government-wide financial statements, Exhibits A and B
- Fund financial statements, Exhibits C, D, E, and F
- Notes to the financial statements
This report contains other supplementary information in addition to the basic financial statements themselves.
The basic financial statements include two kinds of statements presenting different views of the City:
- The first two statements are government-wide financial statements that provide both long-term and short-term information about the City’s overall financial status.
- The remaining statements are fund financial statements that focus on individual parts of the City’s government, reporting the City’s operations in more detail than the government-wide statements.
- Governmental fund statements tell how general government services such as public safety were financed in the short term as well as what amounts remain for future spending.
- Proprietary fund statements offer short- and long-term financial information about the activities the government operates like businesses, such as the public utility systems (water, sewer, and gas) and the golf course.
- Fiduciary fund statements provide information about the financial relationship in which the City acts solely as a trustee or agent for the benefit of others, to whom the resources in question belong. such as the City’s retirement and post-employment benefit plans.
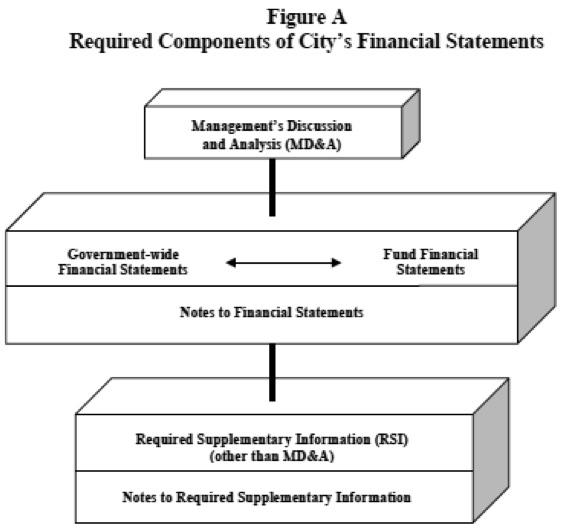
The financial statements also include notes that explain same of the information in the financial statements and provide more detailed data. The statements are followed by a section of required supplementary information that further explains and supports the information in the financial statements. Figure A shows how the required parts of this Management’s. Discussion and Analysis and the City’s basic financial statements are arranged and relate to one another.
The governments-wide financial statements provide both long-term and short-term information about the City’s overall financial status. The fund financial statements focus on the individual parts of the City government, reporting the City’s operations in more detail than the government-wide statements. Both perspectives (government-wide and fund) allow the user to address relevant questions, broaden the basis of comparison (year-to-year or government-to-government) and enhance the City’s accountability.
GOVERNMENT-WIDE FINANCIAL STATEMENTS
The government-wide financial statements are designed to provide readers with a broad overview of the City’s finances, in a manner similar to a private-sector business.
The Statement of Net Position presents financial information on all of the City’s assets and liabilities, with the difference reported as net position. Over time, increases or decreases in net position may serve as a useful indicator of whether the financial position of the City is improving or deteriorating.
The Statement of Activities presents information showing bow the City’s net position changed during the most recent fiscal year. All changes in net position are reported as soon as the underlying event giving rise to the change occurs, regardless of the timing of related cash flows. Thus, revenues and expenses are reported for some items that will only result in cash flows in future fiscal periods (e.g., uncollected taxes and earned but unused accrued vacation leave.)
The government-wide financial statements distinguish functions of the City that are principally supported by taxes and intergovernmental revenues (governmental activities) from other functions that are intended to recover all or a significant portion of their costs through user fees and charges (business-type activities).
In the Statement of Net Position and the Statement of Activities, the City is divided into three categories:
- Governmental activities - Most of the City’s basic services are included here, such as the activities of the police, fire, public works, social services, parks and recreation departments, and general administration Property taxes and state and federal grants finance most of these activities.
- Business-type activities - The City charges fees to customers to cover the cost of certain services it provides. The City’s water, sewer, and gas systems as well as the golf course are included haie.
- Component units - The City includes two separate legal entities in its report - the City of Charlottesville Economic Development Authority and the Charlottesville Public Schools. Although legally separate, these “component units” are important because the City is financially accountable for tham and provides operating funding.
FUND FINANCIAL STATEMENTS
A fund is a grouping of related accounts that is used to maintain control over resources that have been segregated for specific activities or objectives. The City, like other state and local governments, uses fund accounting to ensure and demonstrate compliance with finance-related legal requirements. All the funds of the City of Charlottesville, Virginia can be divided into three categories: governmental funds, proprietary funds, and fiduciary funds.
- Governmental Funds. Most of the City’s basic services are included in governmental funds, which focus on (1) how cash and other financial assets that can readily be converted to cash flow in and out and (2) the balances remaining at year-end that are available for spending. Consequently, governmental fund statements provide a detailed short-term view that helps the reader determine whether there are more or fewer financial resources that can be spent in the near future to finance the City’s programs. Because this information does not encompass the long-term focus of the government-wide financial statements, additional information is provided on a subsequent page that explains the relationship (or differences) between the government-wide and fund financial statements.
- Proprietary Funds. Services for which the City charges customers a fee are generally reported in proprietary fonds. Proprietary fund statements, like the government-wide financial statements, provide both short-term and long-term financial information. The City’s enterprise funds (one type of proprietary fund) are the same as its business-type activities, with the exception of the Internal Service Funds’ allocation, but they provide more detail and additional information, such as a statement of cash flows. The City also uses internal service funds (another kind of proprietary fund) to report activities that provide supplies and services for the City’s other programs and activities - such as the Risk Management Fund and the Information Technology Fund.
- Fiduciary Funds. Fiduciary funds are used to report assets held in a trustee or agency capacity for others outside the government. The City maintains two pension trust funds for retirement and post-employment benefits. These activities are reported in a separate statement of fiduciary net assets. Tbe City excludes this activity from its government-wide financial statements because the City cannot use these assets to finance its operations.
The Total Governmental Funds column requires reconciliation because of the different measurement focus from the government-wide statements (current financial resources versus total economic resources) which is reflected at the bottom of or following each statement. The flow of current financial resources will reflect bond proceeds and inter-fund transfers as other financing sources as well as capital expenditures and bond principal payments as expenditures. The reconciliation will eliminate these transactions and incorporate the capital assets and long-term obligations (bond and others) into the Governmental Activities column (in the government-wide statements).
NOTES TO THE FINANCIAL STATEMENTS
The notes provide additional information that is necessary to acquire a full understanding of the data provided in the government-wide and fund financial statements. The notes to the financial statements can be found following Exhibit F-2 at the end of the basic financial section of this report.
OTHER INFORMATION
In addition to the basic financial statements and accompanying notes, this report also presents required supplementary information and notes. General and Social Service major fund budget and actual reports are presented on a budgetary reporting basis as Exhibits G-1 and G-2. Progress in funding its obligations to provide pension and other post-employment benefits (OPEB) plans to its employees is provided as Exhibits H-1, H-2, H-3, H-4, and H-5.
The supplementary section has other major fund budget and actual reports presented on a budgetary reporting basis as Exhibits 1-1 and 1-2, as well as individual fiduciary statements in Exhibits 1-3, and 1-4. Non-major governmental funds are presented in Exhibits J, K, K-1, K2, K-3, K-4, K-5, and K-6. Proprietary fund statements are presented as Exhibits E-1, E-2. and E-3. Internal Service funds are presented as Exhibits L-1, L-2, and L-3.
Financial Statements for the Charlottesville School Board — Component unit are presented in Exhibits M-1, M-2, M-3, M-4, M-5, M-6 and M-7. Progress in funding School Board obligation to provide pension and other postemployment benefits (OPEB) plans to its employees is provided as Exhibits N-1, N-2, N-3, N-4, N-5, N-6, and N-7.
FINANCIAL ANALYSIS OF THE CITY AS A WHOLE
Statement of Net Position
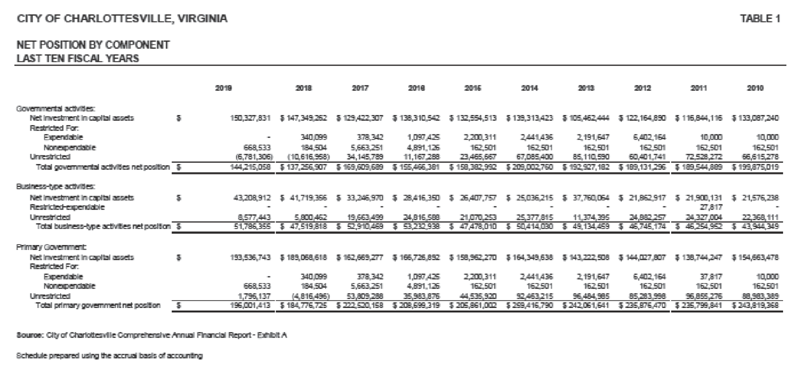
The following table reflects the condensed Statement of Net Position
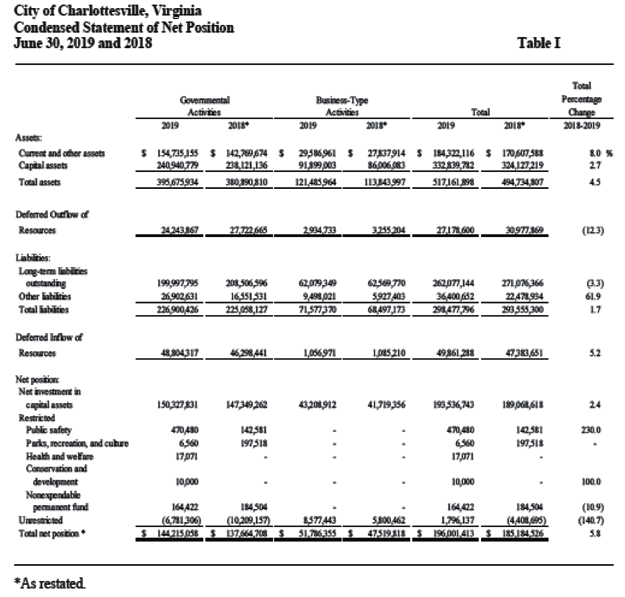
Net position (the difference between assets and liabilities plus deferred outflows of resources less defened inflows of resources) may serve over time as a useful indicator of a government’s financial position. In the case of the City of Charlottesville, the net position was $196.0 million at the close of fiscal year 2019. The largest portion of the City’s net position reflects its net investment in capital assets (e.g.. land buildings, equipment, and infrastructure) less accumulated depreciation, less any related outstanding debt and adding unspent proceeds from debt used to acquire those assets. The City uses these assets to provide services to its citizens and consequently, these assets are not available for future spending. The resources needed to repay the debt related to these capital assets must be provided from other sources.
Governmental Activities
The net position of the City’s governmental activities increased from $137.7 million to $-144.2 million.
Business-type Activities
The City’s business-type activities net position increased by $4.3 million primarily due to a consistent increase in net postion of all utility activities. Business-type activity resources are not to be used to make up for a net position deficit in the governmental activities. In general, the City can only use the unrestricted net position of business-type activities to finance the continued operations of its enterprise operations, which include the Water, Sewer, Stormwatar, Gas and Meadowcreek Golf Course funds.
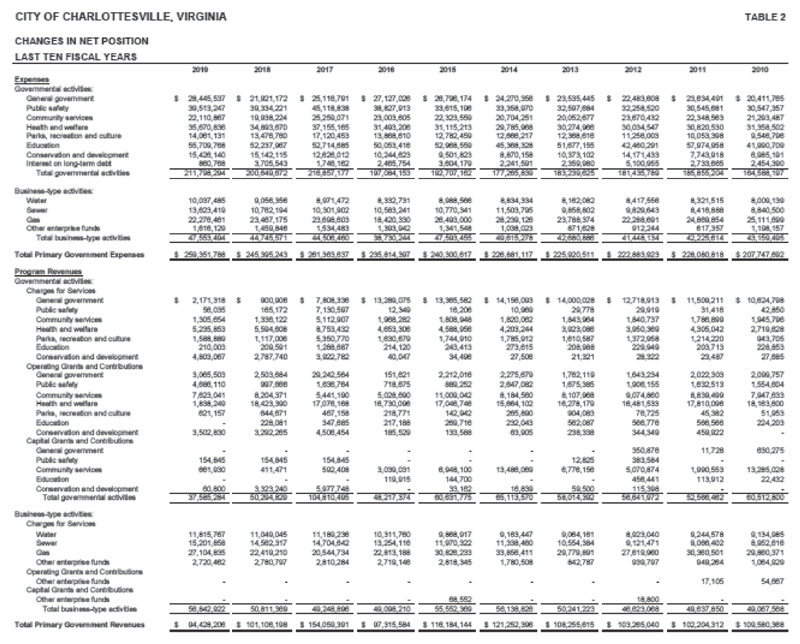
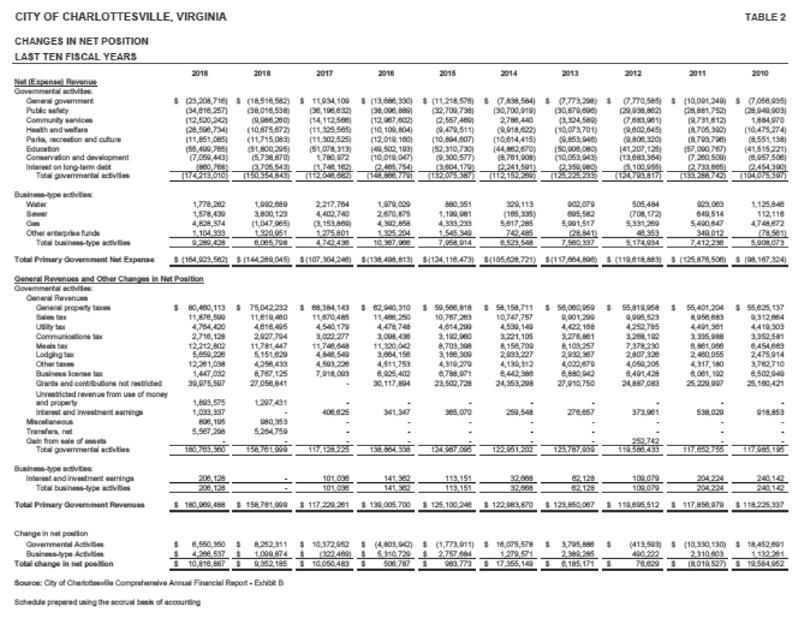
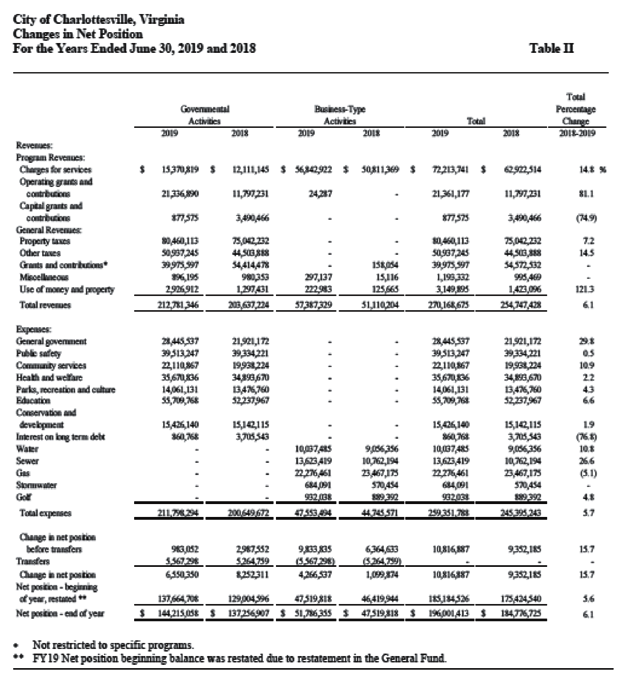
Statement of Activities
The following table shows the revenues and expenses of the government and bussiness-type activities:
Governmental Activities
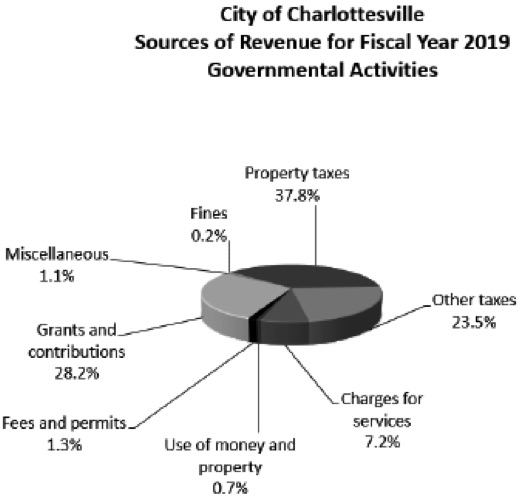
The City’s total revenues from governmental activities were $212.8 million for the fiscal year ended June 30, 2019
Approximately 61.3% of the City’s reverme from governmental activities comes from property and other taxes (58% in 2018).
Revenues by Source - Governmental Activities
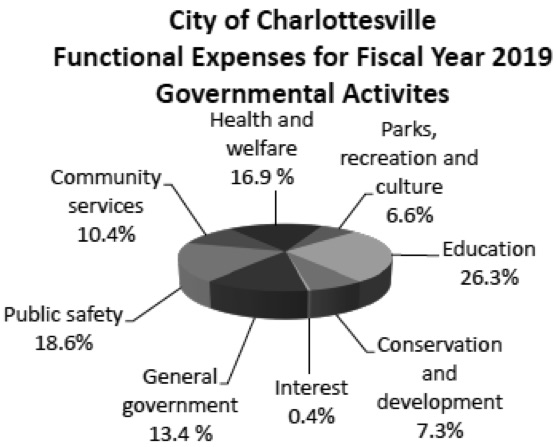
The City’s govermmental activity expenses increased by $7.5 million in 2019. Expenses for fiscal year 2019 cover a wide range of services, with 16.8% or $35.7 million related to health and welfare. 26.3% or $54.8 million for education (primarily payments to the City’s Public Schools, a component unit), and 18.7% or $38.1 million related to public safety.
Expenses by Function – Government Activities
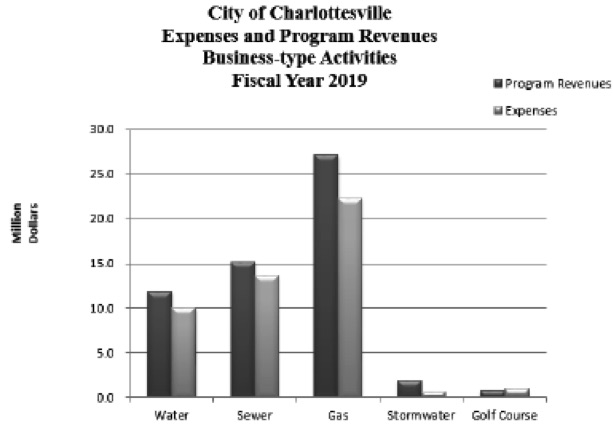
Bussiness-Type Activities
Net position for the city’s bussiness-type increased by $4.3 million.
FINANCIAL ANALYSIS OF THE CITY’S FUNDS
The City of Charlottesville uses fund accounting to ensure and demonstrate compliance with finance-related legal requirements
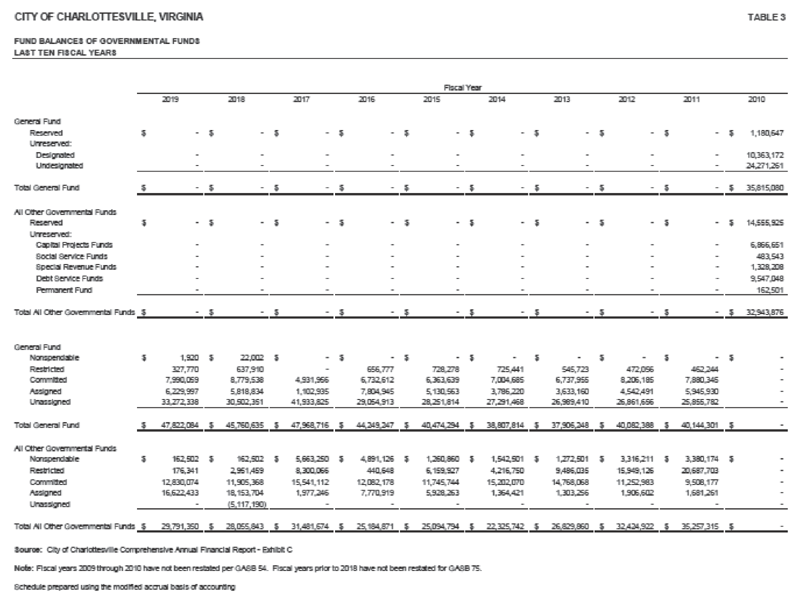
Governmental Funds
The focus of Charlottesville’s governmental funds is to provide information on near-term inflows, outflows and balances of spendable resources. In particular, restricted, committed, assigned, and unassigned fund balances may serve as a useful measure of a city’s net resources available at the end of a fiscal year. For the fiscal Year ended June 30, 2019, the governmental funds reported combined ending fund balances of $77.6 million, an increase of $3.4 million, with restatement, in comparison with the prior year. Included in this are the following major transactions:
- $10.2 million spent in the Capital Projects Fund for capital outlay to fund Mclntire Part trail, Circuit Court renovation, CHS track, Skateboard Park, replacement Fire apparatus, road and sidewalk construction and other projects.
- $54.8 million net, contributed by the City’s governmental funds to finance the Public Schools’ operations.
Approximately $43.5 million of the combined total fund balances constitutes committed and assigned fund balance, which generally is available for spending at the government’s discretion This balance includes $12.8 million committed for debt service.
Nonspendable fund balance is $164.4 thousand from the Permanent Fund. This amount represents assets that are not readily available to the City for current expenditures. The City also has $504.1 thousand in restricted fund balance. Restricted fund balance represents resources that have restrictions placed on them by an outside party. In this case, the City has received grant funds that must be used for a specific purpose but have not yet been spent.
The remaining fund balance at June 30, 2019, indicated as unassigned, is $33.5 million in the General Fund. This amount represents 17.9% of General Fund expenditures and transfers (net) and is a measure of the General Fund’s liquidity. Total fund balance of the General Fund increased by $1.7 million in fiscal year 2019.
Propiiftary Funds
The City of Charlottesville’s proprietary fund statements provide the same type of information found in the government-wide financial statements, but in more detail.
The Water Fund had an increase in net position of $1,105,155. The Sewer Fund had an increase in net position of $739.096. The Gas Fund had an increase in net position of $1.064.962. The Stormwater Fund had an increase in net position of $1.332.171. The Golf Fund had an increase in net position of $21,572.
GENERAL FUND BUDGETARY HIGHLIGHTS
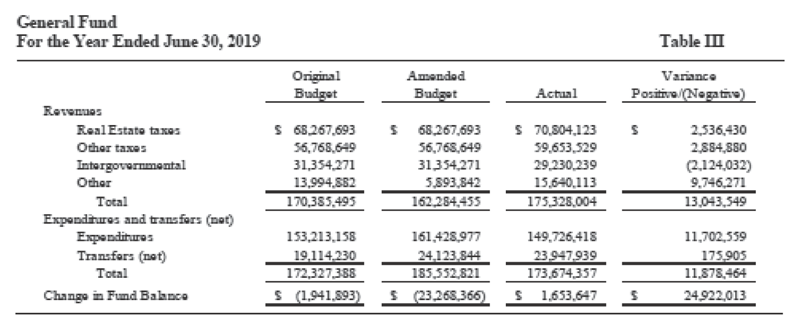
The City’s budget ordinance includes, as part of the original budget for expenditures, the amount of $1,107,752 for encumbrances re-appropriated from June 30, 2018, as well as continuing appropriations from the prior year totaling $2,839,995 for equipment and facilities as well as S2,390,433 for the Landfill Remediation Reserve.
Differences between the original and the final amended budget for the City’s General Fund for expenditures, totaled $13,225,433. This difference is primarily due to the continuing appropriations from the prior year and supplemental appropriations during the year.
Actual total revenues were greater than the amended budget by $1,653,645. primarily due to higher than estimated tax revenues. Several of the significant differences between budgeted and actual revenue ware in meals tax, lodging tax, real estate tax and personal property tax. Expenditures and transfers were below budget by $ 11,878,467.
CAPITAL ASSETS AND DEBT ADMINISTRATION
Capital Assets
The City of Charlottesville’s investment in capital assets for its governmental and business-type activities as of June 30, 2019, amounts to $332.7 million (net of depreciation). This investment includes land, municipal and school buildings and improvements, water, sewer and gas distribution systems, machinery and equipment, roads, and bridges.
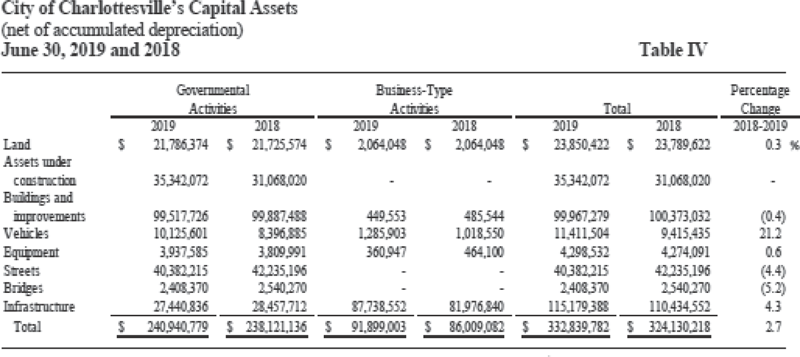
Major capital asset additions during the fiscal Year included the following:
- Utility Infrastructure Improvements (Water, Sewer, and Stormwater)
- McIntire Park Trail Bridge
- Circuit Court Renovations
- CHS Track Improvements
The City’s fiscal Year 2019 capital budget provided approximately $24.9 million for various capital projects. Some of the major categories include $2.1 million in school related projects, $1.2 million for street projects, $7.7 million for parts and recreation facility improvements. $2.5 million for public safety, and $10.5 million for urban redevelopment and housing, General obligation bonds have been issued for a portion of the funding, in accordance with the City’s on-going, five year capital plan.
Additional information about the City of Charlottesville’s capital assets can be found in note 8 of the notes to the financial statements.
Long-term Liabilities
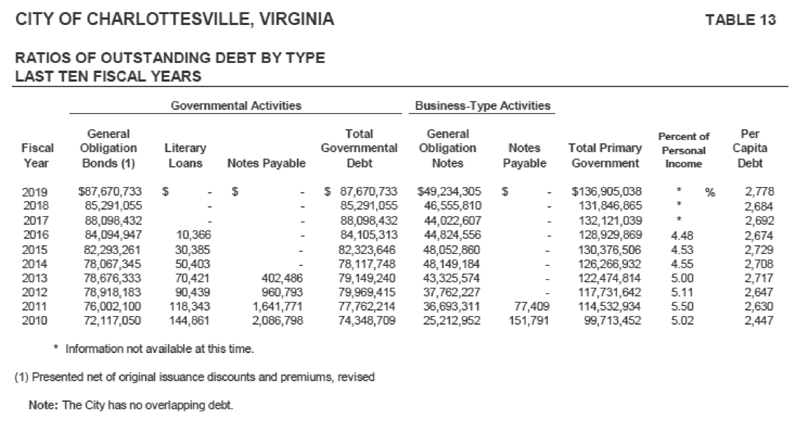
At the end of the current fiscal year, the City of Charlottesville had total bonded debt (including unamortized premiums, and notes payable) outstanding of $144.1 million This entire amount is backed by the full faith and credit of the City and $48.7 million is being repaid by the City’s utilities.
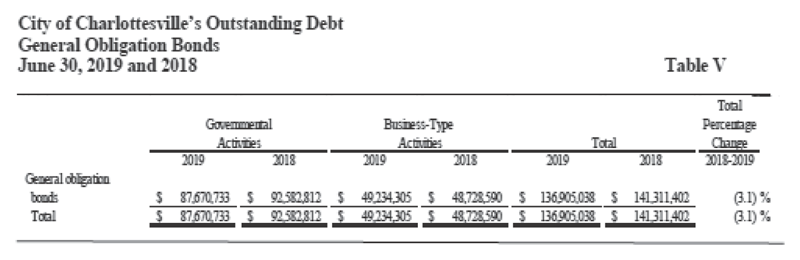
Charlottesville’s total debt increased by $2.8 million during the fiscal year. On its most recent bond issue in May 2019, flue City’s bond rating was reaffirmed by Standard & Poor’s Corporation and Moody’s Investors Savice. as AAA and Aaa. respectively.
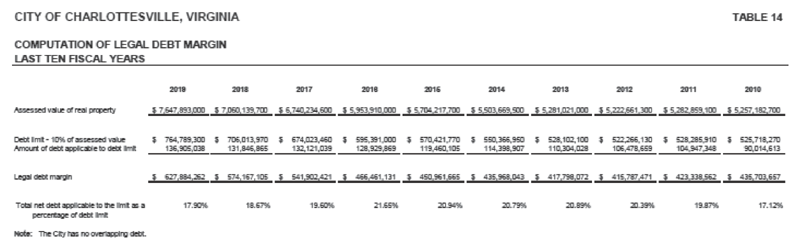
State statutes limit the amount of general obligation debt a government entity may issue to 10 percent of its total assessed valuation of real property. The current debt limitation for the City of Charlottesville is $766 million. This is significantly more than the City’s current total outstanding debt.
Additional information on the City of Charlottesville’s long-term liabilities can be found in note 9 of the notes to the financial statements.
ECONOMIC FACTORS AND NEXT YEAR’S BUDGET AND RATES
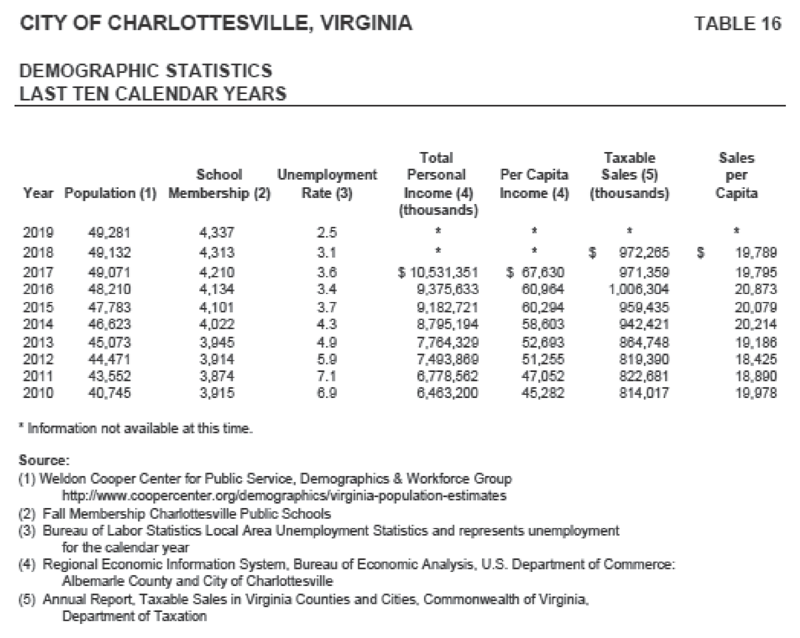
- The City’s unemployment rate has stabilized from its high in 2010 and as of July 2019 is at 2.6%. This compares favorably to the national unemployment rate of 3.7%. and the state’s rate of 2.9%.
- City labor force increased 0.99% from 25,758 in July 2018 to 26,014 in July 2019 based on current Virginia Employment Commission statistics.
- The City has an estimated population of 49.281 according to the Weldon Cooper Center for Public Service.
These indicators were taken into account when adopting the General Fund budget for 2020. Amounts available for appropriation in the General Fund budget for 2020 are $192.8 million, an increase of 13.1% over the 2019 budget of $179.7 million.
CONTACTING THE CITY’S FINANCIAL MANAGEMENT
This financial report is designed to provide citizens, taxpayers, customers, investors, and creditors with a general overview of te City’s finances and to demonstrate the City’s accountability for the funds it receives. If you have questions about this report or need additional financial information, contact the Director of Finance. City of Charlottesville, 605 East Main Street, Charlottesville, Virginia 22902.

STATISTICAL SECTION
This section of the City of Charlottesville’s comprehensive annual financial report presents detailed information as a context for understanding what the information in the financial statements, note disclosures, and required supplementary information says about the City of Charlottesville’s overall financial health.
Contents
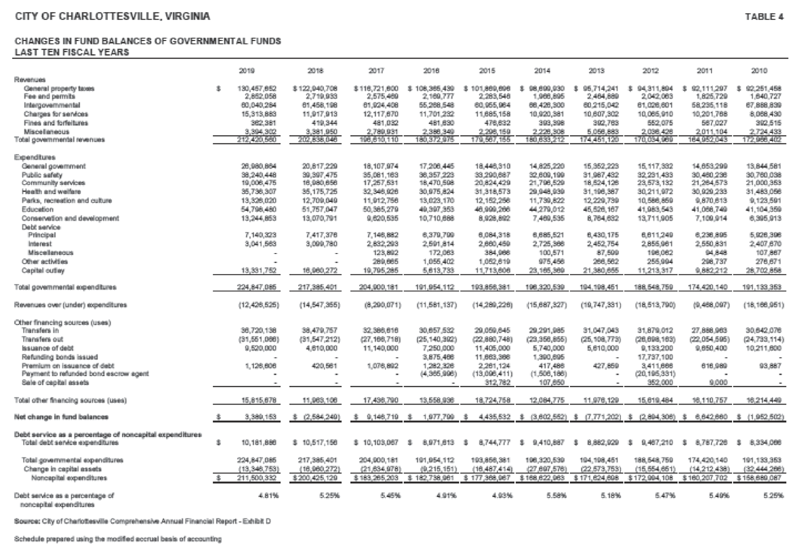
| Financial Trends | Tables 1 - 4 |
| These schedules show comparative information about how the City’s financial perfofmance has changed over time. | |
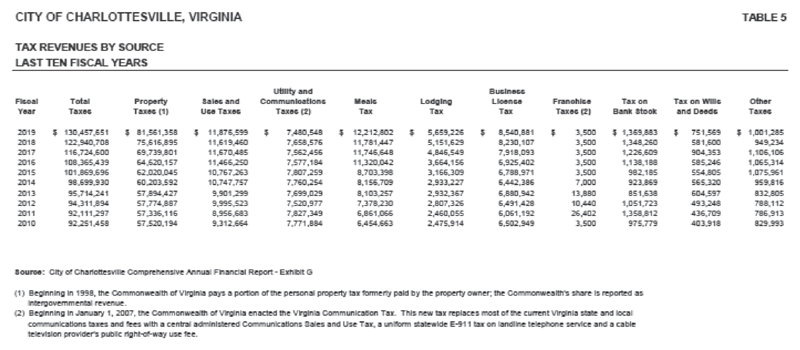
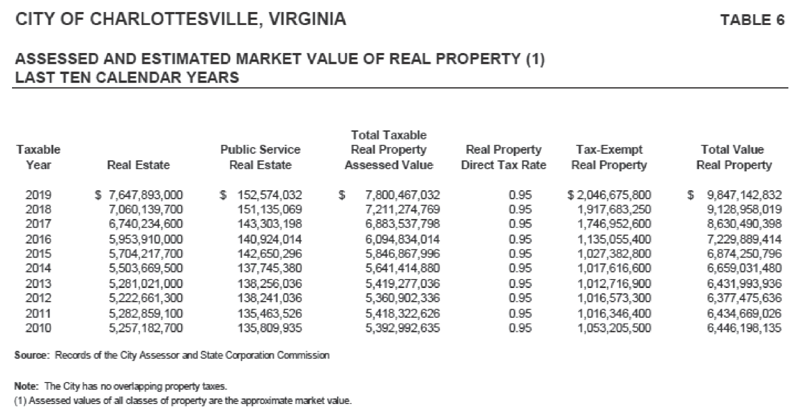
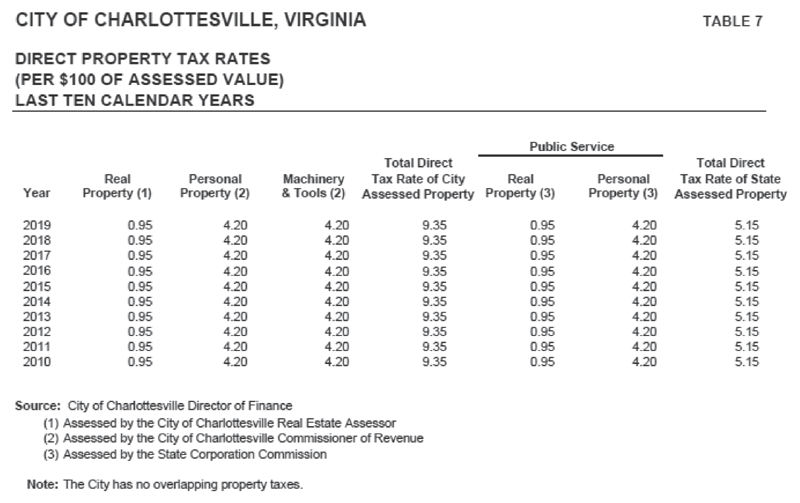
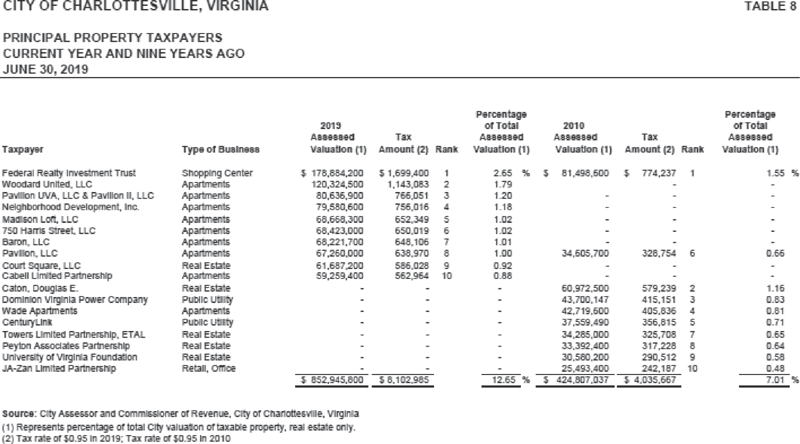
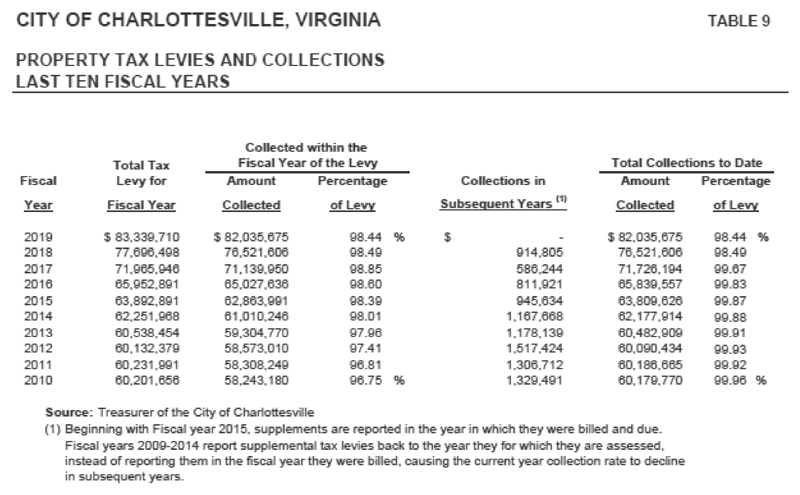
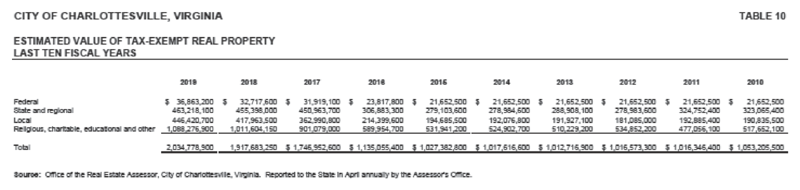
| Revenue Capacity | Tables 5 - 10 |
| These schedules show the City’s significant local revenue sources and how they have changed over time. | |
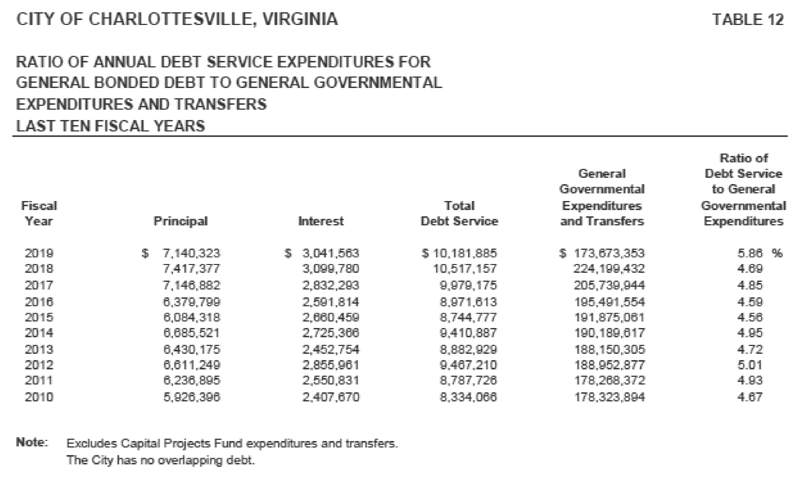
| Debt Capacity | Tables 11 - 14 |
| These schedules demonstrate the affordability of the City’s outstanding debt along with the City’s ability to issue additional debt in the future. | |
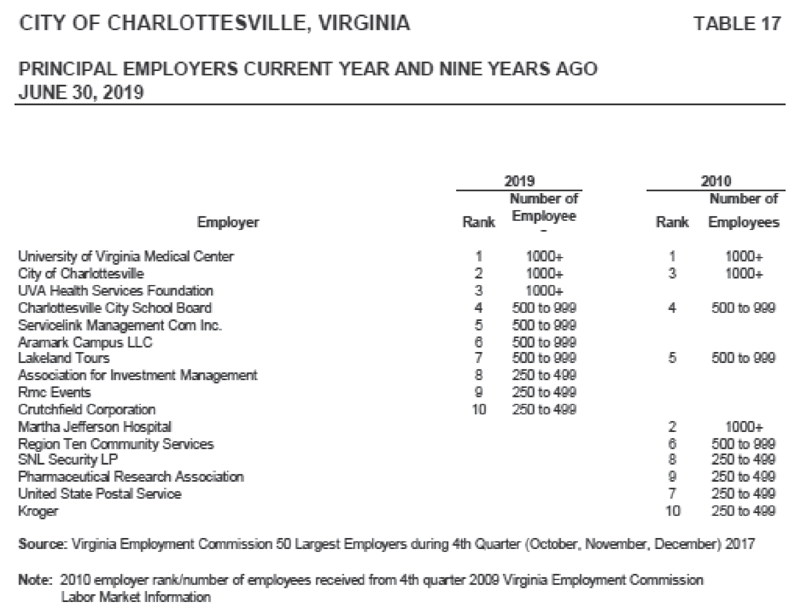
| Economic and Demographic Information | Tables 15 - 17 |
| These schedules show the some of the economic and demographic trends that affect the financial health of the City. | |
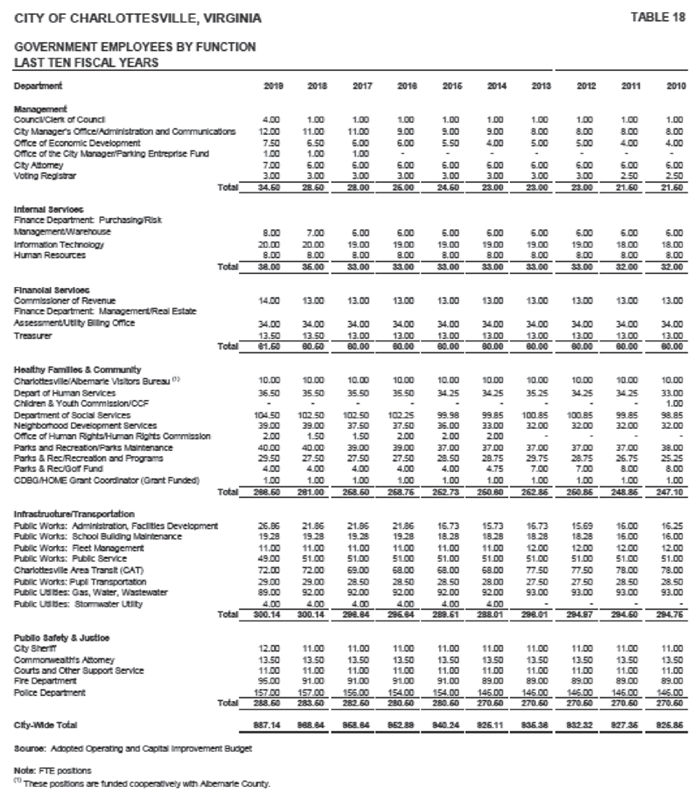
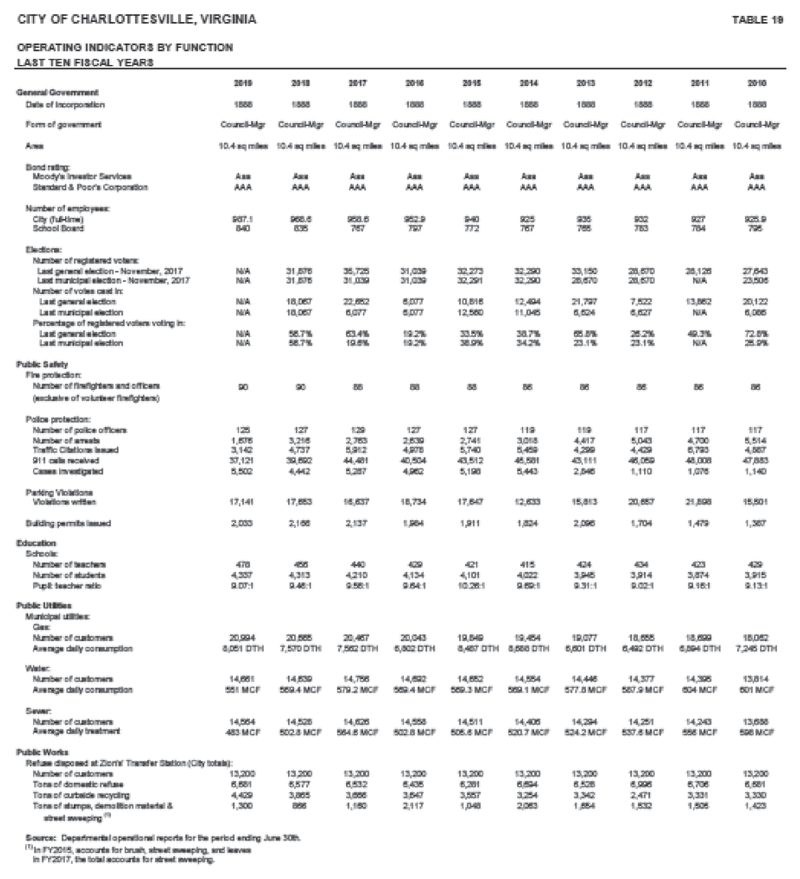
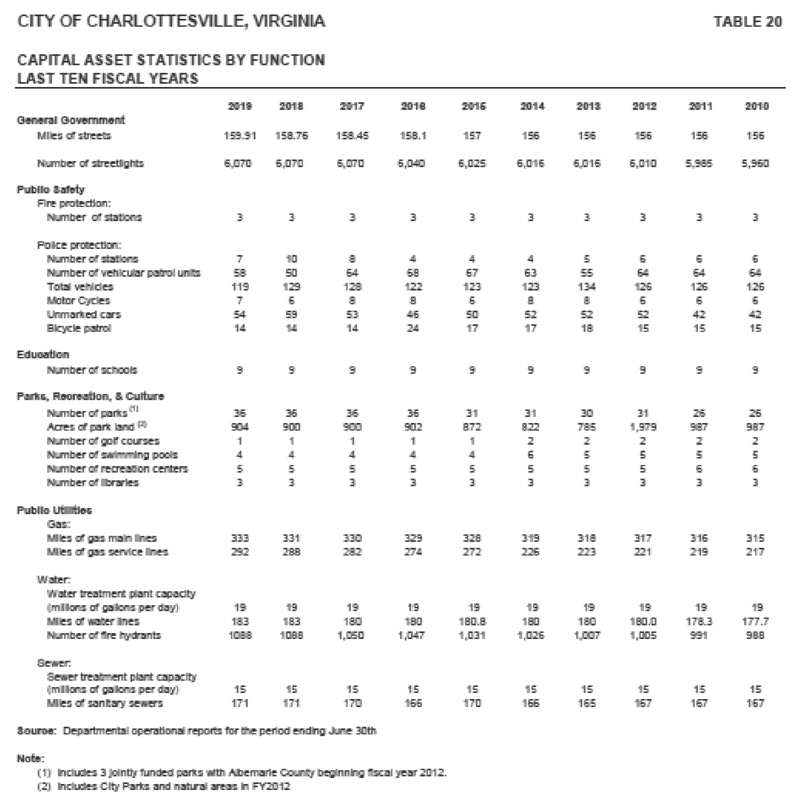
| Operating Information | Tables I8 - 20 |
| These schedules contain service and infrastructure data to show some of the services the City provides and the activities it performs. | |
Sources: Unless otherwise noted, the information in this section is derived from the City’s Comprehensive Annual Financial Reports for the relevant year.