
Chapter 10
Residential Rate Design and Death Spiral for Electric Utilities: Efficiency and Equity Considerations
Rasika Athawale
Frank Felder Center for Energy, Economic, & Environmental Policy, Edward J. Bloustein School of Planning and Public Policy, Rutgers University, New Brunswick, NJ, United States of America
Abstract
Nearly flat growth in US electricity demand, combined with policies to increase distributed generation, have resulted in concerns of revenue “death spiral” for electric utilities. Redesigning rate structures in response to high penetration of distributed generation creates both efficiency and equity considerations. This chapter explores these considerations in the context of New Jersey that has three policy elements: aggressive solar mandates, net-metering, and recovering almost all fixed costs for residential consumers through volumetric rate. Winners and losers are projected under possible scenarios of rate adjustments, along with effects on the collection of Sales and Use Tax on sale of electricity.
Keywords
distributed resources
rate design
electricity tariffs
net-metering
1. Introduction
The electric distribution industry in the United States has witnessed two distinct trends since the last recession: flat or declining demand (Fig. 10.1, Introduction to this volume), and capacity addition of new distributed energy resources (DER). DER can be both on the supply side (those that generate electricity, such as rooftop solar, and combined heat and power plants), and on the demand side (those that reduce electricity consumption, such as energy efficiency and demand response solutions).
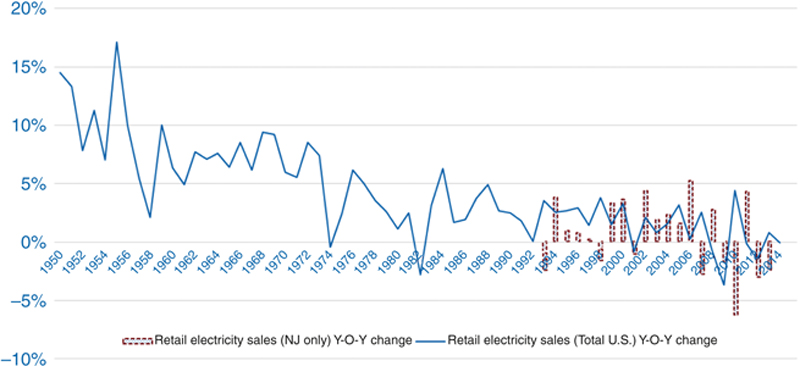
Figure 10.1 Year-on-year change in retail electricity sales in the US and New Jersey. (Source: EIA, 2015, Monthly Energy Review, Mar. 2015; EIA, State Energy Profile.)
Increase in penetration of DER is a result of improved economics due to various federal, state, and local policies and support, even though the capital costs of DER are substantially high, leading to less installed capacity per initial dollar invested, as compared to conventional energy sources (Beck and Martinot, 2004; Doris, 2012). Supporting policies notably include: (1) market preparation policies, such as net-metering and interconnection standards, (2) market creation policies, such as mandates or Renewable Portfolio Standards (RPS), and (3) market expansion policies, such as incentives in the form of tax rebates and grants (Doris, 2012).
Investments in decentralization have, in a way, created a partial substitute for the conventional utility grid and supply services. Between Jan. and Dec. 2014, the net-metering eligible customer-generators supplied cumulatively 723,611 MWh to the electric distribution companies in the state of New Jersey.a That is approximately 1% of the total retail electricity sales in New Jersey for the year 2014.b At the national level, customer-sited photovoltaic (PV) systems generate only 0.2% of the total electricity consumption (Satchwell et al., 2015).
Now faced with some “real competition,” the electric utilities have understandably not remained silent (business models under consideration by utilities to challenge this competition are discussed in chapter by Nillesen and Pollitt in this book). Their contention is that, while the benefits from DER are generally not questionable (although the mechanism for quantification could be), the costs must also be captured (Edison Electric Institute, 2013). Households with rooftop solar PV reduce their total consumption with little or no change in their peak demand, but contribute less toward the actual cost of grid services (Fig. 10.2 depicts the average load for a residential consumer in New Jersey on a summer weekday, and hourly generation from a 1 kW solar system). The overarching issues faced by electric utilities have been succinctly summed up in the chapter by Sioshansi in this book.
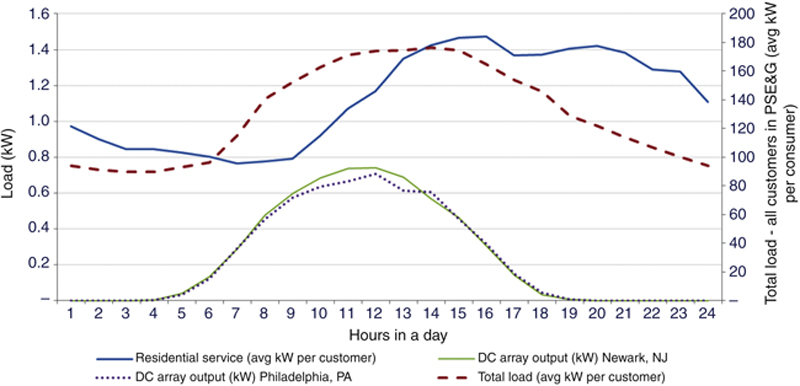
Figure 10.2 Load profile of customers in PSE&G service area and DC output from a solar system installed in Newark and Philadelphia. (Sources: Sample residential and commercial load shape in the PSE&G service area is presented as average kW per customer, https://www.pseg.com/business/energy_choice/third_party/load_profiles.jsp; DC output from a 1 kW solar system installed in Newark and Philadelphia is calculated using NREL PVWatts® Calculator, http://pvwatts.nrel.gov/pvwatts.php. Data for Jul. 15, 2014.)
The current structure of utility tariffs, favoring volumetric rates, coupled with policies such as net-metering, is argued to lead to a revenue death spiral situation (Felder and Athawale, 2014). Needing to promote a mix of resources that can efficiently meet supply requirements, regulators have created a revenue imbalance, which favors the owners of distributed resources, and puts additional burden on the nonparticipants. Redesigning rate structures so that network costs are recovered through fixed charges (eg, customer and demand charges) is one solution, but this must be done with an eye on efficiency and equity considerations.
The chapter is organized as follows. In Section 2, the major past and present themes governing electric tariff design are discussed, exploring how utilities recover costs through a combination of fixed and variable charges. In Section 3, the actual pricing structure followed by distribution utilities (using the state of New Jersey as an example) is discussed to quantify effects of current net-metering policy on various types of residential consumers, including low-income consumers. This is followed by projections of results for 2028, taking into account the effects of other policies, such as aggressive solar mandates. The insights from these analyses are then used to illustrate the magnitude of gain and loss for winners and losers, under possible scenarios of rate adjustments, followed by chapter’s conclusions.
2. Cost recoveries via fixed and variable components
2.1. A Brief History of Electricity Tariffs
Capital intensive industries, such as electricity, natural gas, and communications. have used nonlinear pricing since the early 1900s (Joskow, 2007). Sherman and Visscher (1982) have shown that rate-of-return regulated firms, such as electric utilities, chose to adopt multipart tariff structures so as to augment their profits, and not because such tariff design is considered the best option for ensuring economic efficiency and equity. A widely accepted method of charging consumers for electricity services has been a two-part tariff, in which a “fixed” access fee recovers the utility’s investment cost in setting up the transmission and distribution (T&D) network, and a “variable” usage fee ideally sets marginal price equal to the marginal cost of power generation. Within the two-part structure, however, the industry was initially divided on the methodology for charging fixed costs to consumers. The “Wright System” led to revenue maximization and monopoly-building outcome, and was advocated ferociously by dominating industry trade associations and large central power station owners; in contrast, the “Barstow System” was considered suitable for productive efficiency and short-term profit maximization (Yakubovich et al., 2005). Growth was the primary emphasis under the Wright System, which did not differentiate demand charge based on time of usage. The Barstow System recommended pricing as a measure to flatten the load curve and, in turn, propagated production efficiency. The Wright System later got adopted universally by regulators as the baseline-pricing model, and helped large integrated utilities fight competition for peak load consumers from “isolated generators,” such as those owned by urban electric railways and municipalities.
A shift was observed in the 1970s, in the United States. By that time, two factors were evident: (1) benefits from economies of scale and technological progress had been nearly reached, and (2) change in residential consumer demand from increased usage of centralized air conditioning led to a wide difference in peak and base load requirements. Volume discounts or declining block rate pricingc was a popular tariff design to incentivize increasing use of electricity, so this concept was phased out to introduce rates differentiated by consumption, season, and time of day. Increasing energy efficiency was the key driver for such changes to the overall tariff design.
Another significant regulatory change during that period was the enactment of the Public Utilities Regulatory Policies Act (PURPA)d in 1978, which required utilities to buy power from qualifying facilities—some set up as distributed sources of generation. The Act allowed qualifying facilities to be compensated at full “avoided costs” that the utility would have otherwise incurred in generation or procurement from another source.
2.2. Rate Design: Fixed Versus Variable
As illustrated in Fig. 10.3, the fundamental principles of system sustainability, economic efficiency, and consumer protection guide the tariff for distribution services. Together, these ensure capital attraction, consumer rationing, and fairness to ratepayers, while taking into account the revenue-related attributes, cost-related attributes, and practical-related attributes for a sound rate structure (Bonbright et al., 1988).
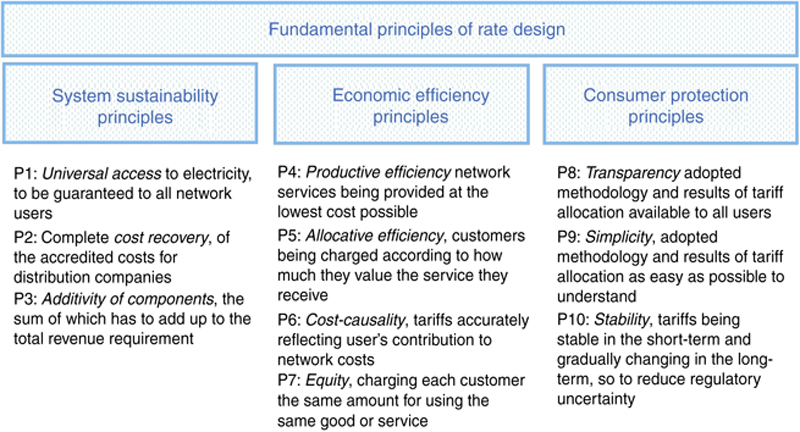
Figure 10.3 Fundamental principles of rate design. (Source: Picciariello, A., Reneses, J., Frias, P., Soder, L., 2015. Distributed generation and distribution pricing: why do we need new tariff design methodologies? Electr. Power Syst. Res. 119, 370−376.)
Some of these principles, which sound perfectly well in theory are often hard to establish and quantify in practice. For instance, the cost-causality principle proposes that network users be charged for their share of contribution to costs. Does that mean that a newly connected load (and consumer) should pay for entire system upgrade costs, which in effect, have been necessitated due to its addition on that part of the network? Welfare policies and political intervention often lead to compromise on other principles, such as equity, by demanding lower cost allocation to economically challenged consumers.
To maintain simplicity and to reflect the real costs as closely as possible, some utilities rely on a three-part tariff structure, which differentiates usage based on consumers’ contribution to system peak demand, aggregate consumption, and time of consumption. The three building blocks of the tariff, as shown in Fig. 10.4, are required at a minimum to approximately depict the total costs incurred in meeting power supply, quality, and reliability. In the absence of time-of-day pricing, consumers do not necessarily care about their contribution to peak demand, and only care about the total aggregate usage in a month, irrespective of the hour when electricity is consumed. Such tariff design also introduces a type of cross-subsidy, from consumers who do not contribute toward peak load, to consumers who significantly contribute to the distribution power system’s peak demand (Borenstein, 2005). Providing real-time time-of-day pricing signals to achieve operational efficiencies and encourage energy efficiency is one of the basic premises of smart grid investments.
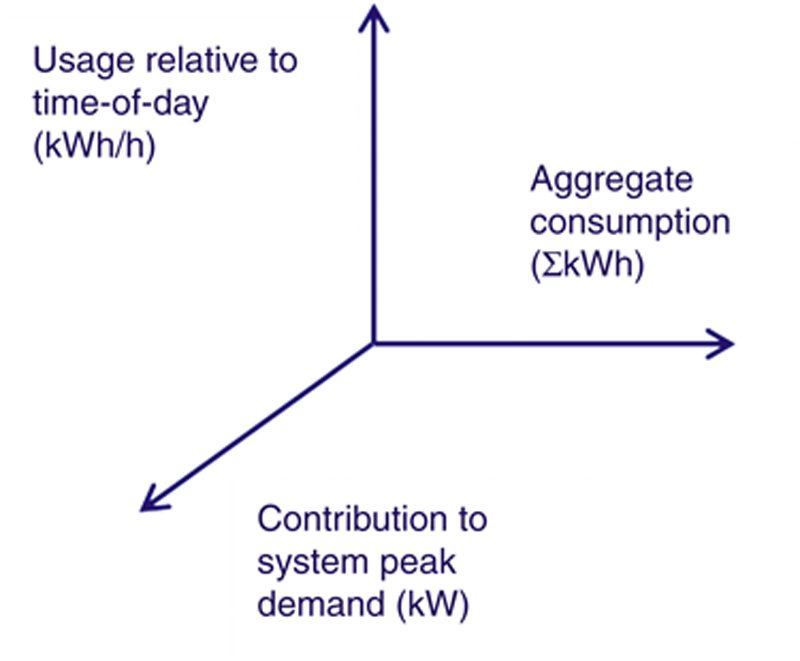
Figure 10.4 Building blocks of tariff.
There could be a fourth dimension that captures consumer characteristics and, hence, contribution toward utilities’ fixed and variable costs. For instance, network investment required in providing electric supply to a consumer in rural area can be different than those incurred in meeting the demand of a similar consumer, but in a dense urban setting.e (See the chapter by Grozev et al. in this book for a discussion of residential network tariffs, and its impact on energy consumption patterns.)
In reality, however, the traditional tariff structure is designed in a way where the utilities’ fixed costs are recovered primarily over a volume of usage. No doubt, a one-unit replacement of supply from a utility by a one-unit generation by a DER affects the overall revenue recovery of the utility. This type of a structure, which ties utilities’ financial health directly to the volume of electricity sales, has long been recognized as one of the key barriers for growth of distributed resources and efficient network planning (Carter, 2001; Anthony, 2002).
Using New Jersey as an example, all four electric distribution utilitiesf charge almost all costs on a per unit consumption basis, to residential consumers. As seen in Fig. 10.5, all four utilities levy a small fixed portion as a monthly service charge ($/month), while the supply, as well as delivery charges, are volumetric ($/kWh). Out of a total average illustrative bill of one hundred dollars paid by a residential consumer, about 60% goes toward recovery of supply charges, while approximately 35% goes toward recovering delivery charges. The fixed monthly charge for a residential consumer of PSE&G is $2.43 per month, irrespective of total consumption; similarly, for JCP&L it is $2.20 per month. Rockland Electric charges the maximum fixed service charge ($4.44 per month) to a residential consumer in New Jersey.
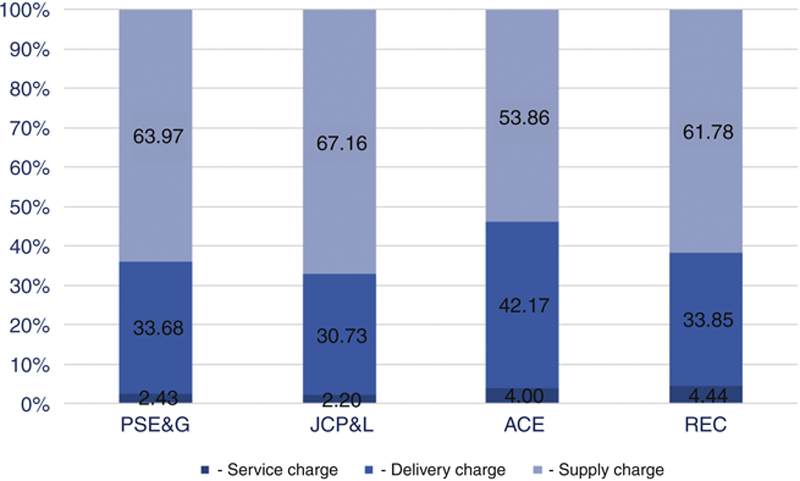
Figure 10.5 Network and supply costs comparison of NJ utilities. (Source: Respective utility tariff for electric service.)
Not all utilities, though, charge such low fixed rates (Fig. 10.6). For a residential consumer in Hartford, the Connecticut Light and Power charges as high as $19.25 per month as consumer charge, and a residential consumer availing supply from ConEdison in New York City pays $15.76 per month, as fixed charge. Regulators in some states have recently approved moderate to significant increases in the fixed charges of utilities. In late 2014, the Public Service Commission of Wisconsin approved fixed charges for residential consumers of Madison Gas & Electric to go up from $10.50 per month to $19 per month—an increase of 81%. The Public Service Commission of Wisconsin in its Orderg dated Dec. 23, 2014, noted that the rates should provide a correct signal to a consumer about the costs (fixed and variable) incurred by the utility in providing access to the grid, and quality and reliable power supply. Other utilities, such as the Arizona Public Service, have asked for a 320% jump in fixed charge for DG consumers—that is from the current $5 per month to $21 per month.
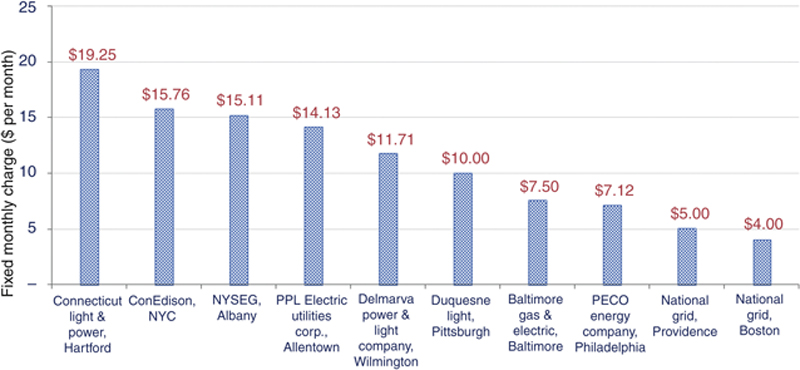
Figure 10.6 Comparison of fixed monthly charges for utilities in the Northeast Region. (Source: Respective utility tariff for electric service.)
Elsewhere,h in Canada, the Ontario Energy Board suggested revenue decoupling for low volume customer classes, through fixed rate design. The Board believes this is the most effective rate design for ensuring that rates reflect the cost drivers for the distribution system, and one that best responds to the current environment of increased penetration of distributed generation (Ontario Energy Board, 2014). The Board’s draft report suggests that a fixed charge in effect is beneficial to a low volume consumer, as it makes the bill more predictable and stable. It lays out three options for revenue recovery:
• a single monthly charge, which is same for all consumers within a rate class;
• a fixed monthly charge with the size of the charge based on the size of the electrical connection; and
• a fixed monthly charge with the size of the charge based on the usage during peak hours.
Several public policy program expenditures and historical true-up costs are embedded into the delivery charge, and are thus recovered on a volumetric basis, using the underlying principle that one who consumes more should pay more. Delivery charge in a PSE&G residential bill contains various program expenses, such as Societal Benefits Charge (SBC), Nonutility Generation Charge, Solar Pilot Recovery Charge, Green Programs Recovery Charge, Transition Bond Charge, and Market Transition Charge Tax. The share of these “nondelivery fixed charges,” totaling $33.68 out of a $100 electricity bill, is shown in Fig. 10.7.
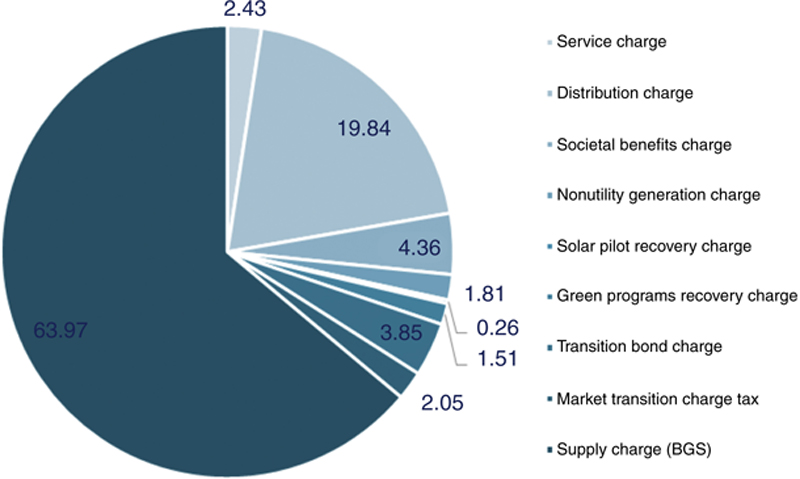
Figure 10.7 Components of an electric bill (Utility: PSE&G). (Source: PSE&G tariff for electric service, as of Mar. 1, 2015.)
There may or may not be more economically efficient methods of recovering these other costs. However, considering the principle of simplicity of rate, and the time and effort consumers, especially residential consumers, devote to understand their electricity bills, it is easy to bundle all costs unrelated to supply into the delivery volumetric charge. Some of these charges (such as the SBC, in this case) are merely collected by the utility, and then passed on to the state government’s Office of Clean Energy (OCE) that funds various renewable energy and energy efficiency programs. According to the OCE, from 2001 to 2006, about $787 million of SBC funds were collected from electric and natural gas consumers in the state. About 30% of the money the SBC collected supports the Universal Service Fund (USF) that provides assistance to low-income consumers.i
3. Winners and losers: a case of new jersey
3.1. Supporting Policies and Incentives for DER
Costs of, and benefits to, a DER should theoretically be based on the actual value provided by a particular DER project. State and federal policies and subsidies vary, depending upon several factors, and are preset for different characteristics of a DER, as shown in Fig. 10.8.
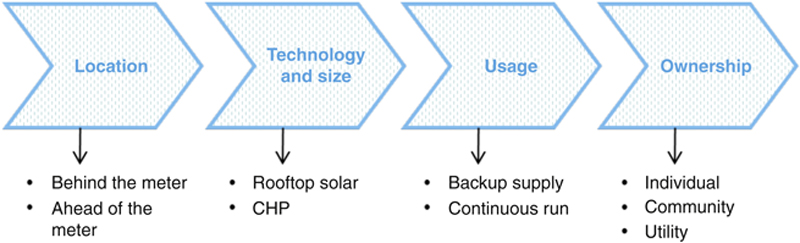
Figure 10.8 Characteristics of a DER.
New Jersey has been a frontrunner in clean and renewable energy capacity addition. The Solar Energy Industry Association’s 2013 report ranks New Jersey first in distributed, nonutility solar installations, and third in cumulative installed capacity nationwide.j The state has adopted a renewable portfolio standard (RPS), setting a target of 22.5% of electricity procurement from renewable energy resources, by the year 2021 (State of New Jersey, 2011). An Energy Resilience Bank has been launched to support investments in microgrids and distributed generation projects that can increase reliability and resiliency. New Jersey has successfully transitioned away from solar rebates (offered under the Clean Energy Program) to a market-based incentive mechanism that compensates owners of PV with tradable Solar Renewable Energy Certificates (SRECs).k
In response to the oversupply of SRECs in 2011–2012 compliance periods, the state passed the Solar Act of 2012l that accelerated the RPS compliance schedule, and changed the SREC requirement from a fixed volume target to a target based on percentage of load served. The Solar Act of 2012 also lowered the solar alternative compliance payment (SACP) schedule, under which the load-serving entities pay to buy retiring SRECs, so as to meet their annual solar RPS compliance obligations. The electric utilities offer solar financing programs that provide long-term SREC price support for participating system owners.
Net metering for residential and small commercial consumers has been prevalent in New Jersey since the introduction of the Electric Discount and Energy Competition Act (EDECA) in 1999.m The New Jersey Board of Public Utilities further relaxed the net metering rules in Sep. 2004, by (1) increasing the maximum customer-generator eligible capacity to 2 MW from 100 kW, and (2) by including solar thermal, fuel cells, geothermal, wave or tidal, biomass, and methane gas landfills into the spectrum of eligible technologies, in addition to the existing solar PV and wind. Currently, there is a cap of eligible capacity addition up to 2.5% of the state’s peak demand, proposed to be raised up to 7.5% under the New Jersey Bill A-2420.n At the end of 2011, there were 12,907 customers in New Jersey who had net-energy meter solar PV systems, with an installed capacity of 507.36 MW.o
3.2. Quantifying Change in Tariff for Residential Consumers
On average, a residential consumer in New Jersey uses 750 kWh of electricity per month.p This compares to a consumption of around 600 units per month by a low-income consumer,q and approximately 1875 kWh per month by a high usage consumer, typically one with a large single-family house.r Total retail sales in New Jersey, in 2012, were 75,052,914 MWh, out of which 38% was consumed by the residential sector alone.s Roughly one third of the total number of households in New Jersey is eligible for the Low-Income Home Energy Assistance Programt (LIHEAP), using the federal maximum LIHEAP income standard for eligibility (greater of 150% of HHS poverty guidelines, or 60% of State median income). As compared to the whole of the United States, New Jersey is home to 3% of LIHEAP eligible households. Low-income consumers are provided several types of incentives, as shown in Table 10.1 Median household income in New Jersey is $71,637,u meaning that a monthly income of less than $3,581 for a household makes it eligible for LIHEAP benefits.
Table 10.1
New Jersey: Number of Households Eligible and Served Under Various Low-Income Assistance Programs
| For New Jersey | No. of HHs |
| HHs served under Universal Service Fund (2013)a | 212,898 |
| HHs served under Fresh Start (2013)a | 14,564 |
| HHs served under Lifeline (2013)a | 304,534 |
| HHs served under Comfort Partners (2013)a | 11,760 |
| Total number of LIHEAP eligible HHs (2011)b Federal Income Standards | 1,044,279 |
| Total number of HHs in New Jersey (2013)c | 3,578,141 |
a LIHEAP Clearing House, http://www.liheapch.acf.hhs.gov/dereg/states/njsnapshot.htm
b LIHEAP Home Energy Notebook, for Fiscal Year 2011, published Jun. 2014, https://www.acf.hhs.gov/sites/default/files/ocs/fy2011_hen_final.pdf
c US Census Bureau, http://quickfacts.census.gov/qfd/states/34000.html
The average monthly electric bill for different types of residential consumers is calculated as a first step to quantify the net effects of volumetric rate recovery, and increased penetration of DER within a utility service territory. Residential consumers are categorized based on their usage pattern. For simplicity, it is assumed that (1) a high usage consumer is a potential candidate to install a DER (such as a rooftop solar panel), and (2) by doing so, her monthly draw from the utility, post net metering, is half of the original. Fig. 10.9 shows the monthly bill for all types of consumers as of today, who all pay similar service charges, though their share of delivery and supply charges vary, based on their consumption. These calculations are done using the tariff rates for PSE&G, the largest utility in New Jersey. A low-income consumer pays a total electric bill of $113 per month, an average consumer pays $141 per month, and a high-usage consumer pays $348 per month. Note that the service charge (fixed dollars per month) remains the same for all types of residential consumers, irrespective of their usage. That would mean that a low-income consumer spends 3.15% of income toward electricity bills, while an average income consumer would spend around 2.36% of his income on electricity per month.

Figure 10.9 Current consumer bills (2014) for different residential usage.
In the above example, the high-usage consumer with DER and net-metering benefits pays only 50% of the delivery charges. This means that under a full revenue recovery scenario, delivery charges for the rest of the consumers will have to increase correspondingly, so that the utility has the opportunity to recover 100% of its delivery costs (including embedded “nondelivery fixed charges,” such as SBC). This effect of increase in delivery costs for other consumers can be estimated by calculating the total deficiency of delivery charge recovery from all DER-owned consumers in the state.
Reporting and tracking of SRECs generated within New Jersey is managed through the Generation Attribute Tracking System (GATS), administered by PJM Environmental Information Services. Of the 31,337 solar installations, totaling 1418 MW in New Jersey, around 31,233 systems are behind-the-meter installations with a cumulative capacity of 1163 MW. Electricity generated by these solar systems is eligible for net metering, and they can produce together approximately 125,604 MWh per month.v For these many units now sold less by the utilities, the respective lower recovery of delivery charge is equivalent to $8.15 million per month. That translates into a 2% increase in delivery charge for all consumers, arrived at by allocating the shortfall over the total retail sales in New Jersey.w That means the new delivery charge for all residential consumers would be 0.0648 $/kWh, instead of the previous 0.0635 $/kWh. Fig. 10.10 depicts the change in customers’ bills as of today, for the four types of residential consumers, with an increase in delivery charges. All residential consumers would see a 0.7% increase in their monthly electricity bills.

Figure 10.10 Changes in consumers bills (2014) for a possible scenario of increase in delivery charges for all consumers.
Similar results for the year 2028 yield a 4.3% increase in delivery charge to recover the delivery charges shortfall of 262,994 MWh of solar energy generated per month, as mandated by the New Jersey Solar Act of 2012. Total retail sales per month in the year 2028, based on the average growth rate between 1991 and 2012, is projected to be 76,973,773 MWh.x For all residential consumers, in 2028, this translates to around 1.45% increase in their monthly electricity bills, when compared to their bills in 2014. Under a hypothetical aggressive solar mandate of, say, 10% of retail sales in 2028, the increase in monthly bills for all consumers would be around 3.80%, with delivery charge going up from 0.0635 per unit today to 0.0706 per unit.
3.3. Quantifying Tax Effects for New Jersey State Government
Government revenues, in the form of tax collection, also get affected due to higher penetration of DER, especially solar distributed generation systems. At county level, this could be as a result of lower property tax collection, where home owners are allowed to exempt 100% of the value of home solar power systems from property taxes.y For the state government, there could be a reduced collection of the absolute amount of tax collected on the sale of electricity (with volumetric utility rates, the state’s taxes are based on the total amount of the electric bill; any reduction in sales leads to lower billing and collection and, therefore, lower tax dollars).z In addition, the state government could in fact need to increase its subsidy to low-income consumers (assuming (1) low-income consumers are nonparticipants, that is, they do not invest in installing a DER; and (2) the subsidy provided to low-income customers is adjusted so that their expenditure on electricity does not exceed 6% of their income.)aa Finally, for the federal government, there could be an impact on the total income tax collection, as residential sized projects are eligible for a 30% Investment Tax Credit under Section 25D, allowing homeowners to apply the credit on their annual income.bb
In Section 3.2, it is assumed that the utility delivery charge shortfall is recovered by adjusting the delivery charges to account for reduced sales to consumers. Thus, for the state government, there is no absolute tax collection loss. However, the same is not true for supply charges, meant to recover the Basic Generation Service (BGS) charges. The utility does not recover BGS for every single unit less sold; this, in turn, also reduces the government tax collection. For New Jersey in 2014, that meant a tax loss of $1.06 million per month, or $12.74 million per year for 1,507,248 MWh of production by customer-generators. Results for 2028 yield that the NJ State Government would lose $26.67 million, assuming no change in supply charges.
The burden of low-income assistance would also go up, as the electric bill for low-income consumers increases with an increase in delivery charge. For instance, a low-income consumer whose monthly bill is $100 receives an assistance of $60, after paying $40; and where $40 does not exceed 6% of the consumer’s monthly income. If the electric bill of such a consumer goes up by 1.5% (Section 3.1 for year 2028), and the consumer still pays equivalent to 6% of income, then the government’s share actually goes up by 2%. As detailed in Table 10.2, DER capacity addition, along with various prevalent supporting policies and incentives, leads to certain winners and losers, and the extent of gain and or loss depends upon the mechanism followed for utility revenue recovery and rate adjustments. For simplification purposes, it has been assumed that sales remain constant (as projected), even with an increase in tariff for all or certain category of consumers. Note that these calculations do not factor in any change in the SREC prices, which may increase with any increase in tariff for the participating consumers (who may like to increase their revenue by REC sales to provide for higher costs) and which, in turn, shall increase the tariff for all other consumers (as SREC prices are allocated to all electricity sales).
Table 10.2
Winners and Losers Under Possible Scenarios of Rate Adjustments
| Possible scenarios for rate adjustments | ||||||
| Effect on stakeholders | No full revenue recovery for the utility | Revenue recovery through increase in variable charge (all customers pay) | Revenue recovery through increase in fixed charge (only participants paya) | |||
| 2014 | 2028 | 2014 | 2028 | 2014 | 2028 | |
| Consumer | ||||||
| Bill for high usage consumer with solar and net-metering | No change | No change | + 0.70% | + 1.45% | + 60.80 $ per month | + 62.12 $ per month |
| Bill for high usage consumer | No change | No change | + 0.70% | + 1.46% | No change | No change |
| Bill for average usage consumer | No change | No change | + 0.69% | + 1.45% | No change | No change |
| Bill for low-income consumer | No change | No change | + 0.69% | + 1.44% | No change | No change |
| Government | ||||||
| Loss of SBC | $12.39 million per year | $25.94 million per year | Nil | Nil | Nil | Nil |
| Loss of SUT | $19.44 million per year | $40.70 million per year | $12.74 million per year | $26.67 million per year | $12.74 million per year | $26.67 million per year |
| Utility | ||||||
| Loss of revenue (network related; not generation) | $95.78 million per year | $200.55 million per year | Nil | Nil | Nil | Nil |

a Assuming 0.6% consumers as participants in 2014 (PSE&G has a consumer base of 2.2 million and 12,504 solar systems installed in its service area). Total number of consumers in NJ is estimated at 4 million, out of which 2.2 million served by PSE&G, 1.1 million served by JCP&L, 545,000 consumers of Atlantic City Electric, and 200,000 consumers of Rockland Electric. Participant share for 2028 is assumed to be 1.2%.
4. Conclusions
Pricing for electricity has always been nonlinear, unlike many other goods that have a single price. Various alternatives or tariff design options exist within this nonlinear methodology for pricing of electricity supply services. The main concern of this chapter is not to opine on desirable tariff design. Instead, this chapter provides a quantitative comparison of tariff increase for participating and nonparticipating residential consumers, under the assumption that the utility is allowed to recover its revenue by allocating costs in the same fashion as today. Further effects of such rate increases on low-income consumers, and on government’s tax collection, are also analyzed, and results for a future period are projected.
There is a possibility that the utility of the future shall advocate for radical changes to rate design, with an intent to adopt and adapt to the growing influence of DER. It may be worthwhile to conduct further research on the quantification of effects of an alternate rate design on various categories of consumers, as well as government tax collection. It is essential to project results for a future year, assuming DER penetration goals are met, since the scale and size of DER capacity would have a strong impact on the utility revenues and rates. Various nuances are encountered in actual calculations, such as the methodology adopted for determination of total dollars for the Universal Service Fund and fallback mechanism, in case of under recovery; effect of reduction in sales due to utility-sponsored and ratepayer sponsored energy efficiency programs, along with estimation of increase in delivery charge due to such program expenditure; changes in customer behavior and elasticity of demand, with increase in prices, and increase in certain components of prices, and so on. As a further investigation, the effect of changes in net metering policy (cap on generation, calculation of avoided costs, credit period, etc.) on the gains and losses to stakeholders can be studied.
..................Content has been hidden....................
You can't read the all page of ebook, please click here login for view all page.