
“I hear there’s rumors on the Internets that we’re going to have a draft.” | ||
| --George W. Bush, second presidential debate, St. Louis, MO, October 8, 2004 | ||
In the previous chapter, we introduced the concept of in-memory fuzzing. Although we have previously attempted to keep a balance between Windows and UNIX platform coverage, due to the complexity of the topic at hand we decided to focus solely on the Windows platform for this fuzzing approach. More specifically, we cover the 32-bit x86 Windows platform. In this chapter we discuss, in detail, the step by step instruction for creating a proof of concept in-memory fuzzer. We enumerate our desired feature set, cover our approach, and justify our language selection. Finally, after reviewing a case study, we conclude with an overview of the benefits we have introduced and areas of improvement. All of the code we discuss in this chapter will be open source and publicly available at http://www.fuzzing.org. We welcome both feature contributions and bug reports from readers.
As a preliminary warning, please note that although we touch on and explain various low-level aspects of x86 architecture and the Windows platform, we do not cover them in depth. Doing so goes well beyond the scope of this writing. On a positive note, the various concepts we describe in this chapter and the code we develop comes into play in future chapters, such as Chapter 24, “Intelligent Fault Detection.”
Recall from Chapter 19, “In-Memory Fuzzing,” that we introduced two approaches to in-memory fuzzing, both of which we wish to include in our proof of concept implementation: MLI and SRM. For MLI, we need the ability to modify an instruction for the purpose of creating our loop, “hook” into the target at the start of the loop, and mutate the target buffer at that hook. For SRM we’ll need the ability to hook our target process at two specific points, make a copy of the memory space of the target at one hook point, and then restore the memory space of the target at the other hook point. For future reference, Figures 20.1 and 20.2 depict our requirements visually, where the bold text outlines the modifications we need to make to our target process and the dark boxes outline the functionality our in-memory fuzzer must add.
To implement the listed process instrumentation requirements, we are going to write a custom Windows debugger. Creating our in-memory fuzzer as a debugger will thankfully meet all of our requirements. We define the term instrument loosely, to cover a number of capabilities. We need to be able to arbitrarily read from and write to the memory space of the target process. We also need to be able to modify the context of any thread within the target process. A thread context[1] contains various processor-specific register data such as the current instruction pointer (EIP), stack pointer (ESP), and frame pointer (EBP) among the rest of the general-purpose registers (EAX, EBX, ECX, EDX, ESI, and EDI). Control over the thread context will allow us to change execution state, something we’ll need to do during the restore process of SRM. Thankfully, as we’ll see later, the Windows operating system exposes a powerful API that will accommodate all of our needs.
Before jumping into the background information on the specific Windows debugging API functions and structures that we will be using, let’s determine the language in which we will be developing so that we can represent referential code snippets in that same language. Although the most natural choice of language given our requirements might immediately pop out as C or C++, we decided it would be ideal if we could write the tool in an interpreted language. There are a number of benefits to developing in an interpreted language such as Perl, Python, or Ruby. For our purposes, the greatest advantage is development speed, and for you the reader, it will enhance code readability. We ended up choosing Python for the task after discovering the Python ctypes[2] module, developed by Thomas Heller. The ctypes module provides us with an interface to the Windows API as well as the ability to easily create and manipulate complicated C data types directly within Python. The following snippet, for example, demonstrates how easy it is to call the GetCurrentProcessId() function exported by kernel32.dll:
from ctypes import *

# create a convenience shortcut to kernel32.
kernel32 = windll.kernel32

# determine the current process ID.
current_pid = kernel32.GetCurrentProcessId()

print "The current process ID is %d" % current_pid
Creating and passing C data types is equally as easy. The ctypes module exposes all the basic primitives you will need as native Python classes, as shown in Table 20.1.
Table 20.1. ctypes C-Compatible Data Types
ctypes Type | C Type | Python Type |
|---|---|---|
c_char | Char | character |
c_int | Int | Integer |
c_long | Long | Integer |
c_ulong | unsigned long | Long |
c_char_p | Char [*] | string or None |
c_void_p | Void [*] | integer or None |
[*] The full list of available primitives can be found at http://starship.python.net/crew/theller/ctypes/tutorial.html | ||
All of the available types can be passed an optional initial value on instantiation. Alternatively, the value can be set by assigning the value attribute. Passing a value by reference is accomplished with ease through the use of the byref() helper function. A key point to remember is that the pointer types such as c_char_p and c_void_p are immutable. To create a block of mutable memory, use the create_string_buffer() helper function. To access or modify the mutable block, use the raw attribute. The following snippet demonstrates these points in a call to ReadProcessMemory():
read_buf = create_string_buffer(512)
count    = c_ulong(0)

kernel32.ReadProcessMemory(h_process,
    0xDEADBEEF,
    read_buf,
    512,
    byref(count))

print "Successfully read %d bytes: " % count.value
print read_buf.raw
The ReadProcessMemory() API takes a handle to the process whose memory space we want to read from, the address to read from, a pointer to a buffer where the read data is stored, the number of bytes we want to read, and finally a pointer to an integer to store the number of actual bytes we were able to read. While we are on the subject of process memory reading, we should also discuss process memory writing, as demonstrated in the following code excerpt:
c_data = c_char_p(data)
length = len(data)
count  = c_ulong(0)

kernel32. WriteProcessMemory(h_process,
    0xC0CAC01A,
    c_data,
    length,
    by_ref(count))

print "Sucessfully wrote %d bytes: " % count.value
The WriteProcessMemory() function has a similar format to its sister function ReadProcessMemory(). It requires a handle to the process whose memory space we want to write to, the address to write to, a pointer to a buffer containing the data we want to write, the number of bytes we want to write, and finally a pointer to an integer to store the number of actual bytes we were able to write. As we need the ability to read and write process memory to fulfill a number of our requirements, you will see these routines come into play later in the chapter.
We now have the building blocks necessary for diving into development, so let’s briefly cover what we need to know on the API front to create a debugger.
In Chapter 19, we briefly discussed the memory layout and components of the typical Windows process. Before we continue any further, let’s go over some background information on the Windows debugging API that we will be using or abusing, depending on your point of view.
Since Windows NT, the operating system has exposed a powerful set of API functions and structures allowing developers to build an event-driven debugger with relative ease. The basic components of the debugging API can be broken down into the following three categories: functions,[3] events,[4] and structures.[5] As we cover the implementation specifics of our various requirements, we touch on all three of these elements. The first task we have to accomplish is getting our target to run under the control of our debugger. There are two ways of going about this. We can either load the target process under the control of our debugger or alternatively, let the target process start on its own and then attach our debugger to it. To load the process under debugger control, the following code snippet can be used:
pi = PROCESS_INFORMATION()
si = STARTUPINFO()

si.cb = sizeof(si);

kernel32.CreateProcessA(path_to_file,
    command_line,
    0,
    0,
    0,
    DEBUG_PROCESS,
    0,
    0,
    byref(si),
    byref(pi))

print "Started process with pid %d" pi.dwProcessId
Notice the appended A to CreateProcess, Windows APIs are often exported in both Unicode and ANSI versions. The nonappended version of the API serves as a simple wrapper in these cases. For our purposes through ctypes, however, we must call the appended version. Determining if a certain API is exported as both ANSI and Unicode is a simple matter of checking the MSDN page. The MSDN page on CreateProcess,[6] for example, states the following near the bottom: “Implemented as CreateProcessW (Unicode) and CreateProcessA (ANSI).” The PROCESS_INFORMATION and STARTUP_INFO structures are passed by reference to the CreateProcess API and in turn are filled with information we will need later, such as the created process identifier (pi.dwProcessId) and a handle to the created process (pi.hProcess). Alternatively, if we wanted to attach to an already running process, we would call DebugActiveProcess():
# attach to the specified process ID.
kernel32. DebugActiveProcess(pid)

# allow detaching on systems that support it.
try:
    kernel32.DebugSetProcessKillOnExit(True)
except:
    pass
Notice that neither of the API calls we make in this snippet requires an appended A or W. The DebugActiveProcess() routine attaches our debugger to the specified process identifier. Prior to calling DebugActiveProcess(), we might have to increase our privilege level, but let’s worry about that later. The DebugSetProcessKillOnExit()[7] routine has been available since Windows XP and allows us to exit the debugger without killing the debuggee (the process to which we are attached). We wrap the call with a try/except clause to prevent our debugger from exiting with an error if we are running it on a platform that does not support the requested API, such as Windows 2000. Once we have the target process under the control of our debugger, we need to implement the debug event-handling loop. The debug event loop can be thought of as the stereotypical nosy (and old) neighbor in town, Agnes. Agnes sits in front of her window and watches everything that goes on in the neighborhood. Although Agnes sees everything, most of what happens is not interesting enough to motivate her to phone her friends. Occasionally, however, something interesting will happen. The neighbors’ kid will chase a cat into a tree, fall out, and break his arm. Immediately, Agnes will be on the phone with the police. Much like Agnes, our debug event loop will see a lot of events. It is our job to specify which events we are interested in and wish to do something more about. Here is the skeleton of a typical debug event loop:
debugger_active = True
dbg             = DEBUG_EVENT()
continue_status = DBG_CONTINUE

while debugger_active:
    ret = kernel32. WaitForDebugEvent(byref(dbg), 100)

   # if no debug event occurred, continue.
    if not ret:
        continue

    event_code = dbg.dwDebugEventCode

    if event_code == CREATE_PROCESS_DEBUG_EVENT:
        # new process created

    if event_code == CREATE_THREAD_DEBUG_EVENT:
        # new thread created

    if event_code == EXIT_PROCESS_DEBUG_EVENT:
        # process exited

    if event_code == EXIT_THREAD_DEBUG_EVENT:
        # thread exited

    if event_code == LOAD_DLL_DEBUG_EVENT:
        # new DLL loaded

    if event_code == UNLOAD_DLL_DEBUG_EVENT:
        # DLL unloaded

    if event_code == EXCEPTION_DEBUG_EVENT:
        # an exception was caught

    # continue processing
    kernel32.ContinueDebugEvent(dbg.dwProcessId,
        dbg.dwThreadId,
        continue_status)
The debug event handling loop is based primarily on the call to WaitForDebugEvent(),[8] which takes a pointer to a DEBUG_EVENT structure as the first argument and the number of milliseconds to wait for a debug event to occur in the debuggee as the second argument. If a debug event occurs, the DEBUG_EVENT structure will contain the debug event type in the attribute dwDebugEventCode. We examine that variable to determine if the debug event was triggered due to the creation or exit of a process, creation or exit of a thread, load or unload of a DLL, or a debug exception event. In the case that a debug exception event occurs we can determine specifically what the cause of the exception was by examining the u.Exception.ExceptionRecord.ExceptionCode DEBUG_EVENT structure attribute. There are a number of possible exception codes listed on MSDN,[9] but for our purposes we are interested primarily in:
EXCEPTION_ACCESS_VIOLATION. An access violation occurred due to a read or write attempt from an invalid memory address.
EXCEPTION_BREAKPOINT. An exception was triggered due to a breakpoint encounter.
EXCEPTION_SINGLE_STEP. The single step trap is enabled and a single instruction has executed.
EXCEPTION_STACK_OVERFLOW. The offending thread exhausted its stack space. This is typically an indicator of runaway recursion and is usually limited to purely a DoS.
We can interlace whatever logic we wish for handling the various debug events and exceptions. Once we are done processing the reported event, we allow the offending thread to continue with a call to ContinueDebugEvent().
At this stage we have discussed the basics of Windows memory layout, made our list of requirements, chosen our development language, covered the basics of the ctypes module, and dabbled with the fundamentals of the Windows debugging API. A couple of outstanding issues remain:
As we previously touched on in this chapter, process hooking can be achieved in our chosen approach through the use of debugger breakpoints. There are two types of supported breakpoints on our given platform, hardware and software breakpoints. The 80x86 compatible processors support up to four hardware breakpoints. These breakpoints can each be set to trigger on the read, write, or execution of any one-, two-, or four-byte range. To set hardware breakpoints we have to modify the target process context, tinkering with the debug registers DR0 through DR3 and DR7. The first four registers contain the address of the hardware breakpoint. The DR7 register contains the flags specifying which breakpoints are active, over what range, and over what type of access (read, write, or execute). Hardware breakpoints are nonintrusive and do not alter your code. Software breakpoints, on the other hand, must modify the target process and are implemented with the single byte instruction INT3, represented in hexadecimal as 0xCC.
We could use either hardware or software breakpoints to accomplish our given task. In the event that we might at some point require more then four hook points, we decide to utilize software breakpoints. To get a good feel for the process, let’s walk through the required steps of setting a software breakpoint in a fictitious program at address 0xDEADBEEF. First, our debugger must read and save the original byte stored at the target address using the ReadProcessMemory API call as mentioned previously and as shown in Figure 20.3.
Notice that the first instruction at the target address is actually two bytes. The next step is to write the INT3 instruction at the target address using the WriteProcessMemory API, also mentioned previously and as shown in Figure 20.4.
But what happened to our previous instructions? Well, the inserted 0xCC is disassembled as the single byte INT3 instruction. The second byte from the mov edi, edi instruction (0xFF), combined with the byte previously representing push ebp (0x55) and the first byte of the mov ebp, esp (0x8B) instruction are disassembled as the call [ebp-75] instruction. The remaining byte 0xEC, is disassembled as the single byte instruction in al, dx. Now when execution reaches the address 0xDEADBEEF, the INT3 instruction will trigger an EXCEPTION_DEBUG_EVENT debug event with an EXCEPTION_BREAKPOINT exception code, which our debugger will catch during the debug event loop (remember Agnes?). The process state at this point is shown in Figure 20.5.
So now we have successfully inserted and caught a software breakpoint, but that’s only half the battle. Notice that our original instructions are still missing in action. Furthermore, the instruction pointer (EIP, which lets the CPU know where to fetch, decode, and execute the next instruction from) is at 0xDEADBEF0 as opposed to 0xDEADBEEF. This is because the single INT 3 instruction we inserted at 0xDEADBEEF was successfully executed, causing EIP to update to 0xDEADBEEF+1. Before we can continue, we are going to have to correct the value of EIP and restore the original byte at 0xDEADBEEF, as shown in Figure 20.6.
Restoring the byte at 0xDEADBEEF is a task we are already familiar with. However, changing the value of the instruction pointer, the register EIP, is a different story. We mentioned earlier in the chapter that the thread context contains the various processor-specific register data, such as the instruction pointer (EIP) in which we are currently interested. We can retrieve the context for any given thread by calling the GetThreadContext()[10] API, passing it the handle for the current thread and a pointer to a CONTEXT structure. We can then modify the contents of the CONTEXT structure and then call the SetThreadContext()[11] API, again passing in the current thread handle to modify the context:
context = CONTEXT()
context.ContextFlags = CONTEXT_FULL

kernel32.GetThreadContext(h_thread, byref(context))

context.Eip -= 1

kernel32.SetThreadContext(h_thread, byref(context))
At this point, the original execution context is restored and we are ready to let the process continue.
To answer this question we must first consider another question: What changes as a process is running? Well, lots of things. New threads are created and killed. Handles to files, sockets, windows, and other elements are opened and closed. Memory is allocated and released, read from, and written to. The various registers within individual thread contexts are highly volatile and constantly changing. We could accomplish our task using a virtual machine technology, such as VMWare,[12] that allows us to take and restore complete system snapshots. However, the process is painstakingly slow and requires communication between the virtual machine guest and some form of arbiter on the virtual machine host. Instead, we borrow from a previously discussed technique[13] and “cheat” by concerning ourselves with only the thread contexts and changes to memory. Our snapshot process will entail two steps.
In the first step, we save the context of each thread within our target process. We have already seen how easy it is to get and set individual thread contexts. Now we need to wrap that code with the logic responsible for enumerating the system threads that belong to our target process. To do so, we rely on the Tool Help Functions.[14] First, we obtain a listing of all system threads by specifying the TH32CS_SNAPTHREAD flag:
thread_entry = THREADENTRY32()
contexts     = []

snapshot = kernel32.CreateToolhelp32Snapshot(
    TH32CS_SNAPTHREAD,
    0)
Next, we retrieve the first thread entry from the list. Before doing so, however, it is a mandatory requirement of the Thread32First() API that we initialize the dwSize variable within the thread entry structure. We pass the Thread32First() API, our previously taken snapshot, and a pointer to our thread entry structure:
thread_entry.dwSize = sizeof(thread_entry)

success = kernel32.Thread32First(
    snapshot,
    byref(thread_entry))
Finally, we loop through the threads looking for ones that belong to the process ID (pid) of our target process. If there are some, we retrieve a thread handle using the OpenThread() API, retrieve the context as before, and append it to a list:
while success:
    if thread_entry.th32OwnerProcessID == pid:
        context = CONTEXT()
        context.ContextFlags = CONTEXT_FULL

        h_thread = kernel32.OpenThread(
            THREAD_ALL_ACCESS,
            None,
            thread_id)

        kernel32.GetThreadContext(
            h_thread,
            byref(context))

    contexts.append(context)

    kernel32.CloseHandle(h_thread)

success = kernel32.Thread32Next(
    snapshot,
    byref(thread_entry))
Having saved the context of each of the threads belonging to our process, we can later restore our process snapshot by again looping through all system threads and restoring the saved context for any threads previously seen.
In the second step, we save the contents of each volatile block of memory. Recall from the previous chapter that each process on the 32-bit x86 Windows platform “sees” its own 4GB memory space. Of these 4GB, typically the bottom half is reserved for use by our process (0x0000000–0x7FFFFFFF). This memory space is further segmented into individual pages, typically 4,096 bytes in size. Finally, memory permissions are applied at the finest granularity to each of these individual pages. Instead of storing the contents of each individually used page of memory, we save both time and resources by limiting our snapshot to pages of memory that we deem as volatile. We ignore all pages that have restrictive permissions preventing writing. This includes pages marked as:
PAGE_READONLY
PAGE_EXECUTE_READ
PAGE_GUARD
PAGE_NOACCESS
We also want to ignore pages that belong to executable images, as they are unlikely to change. Stepping through all available pages of memory requires a simple loop around the VirtualQueryEx()[15] API routine, which provides information about the pages within the specified virtual address range:
cursor        = 0
memory_blocks = []
read_buf      = create_string_buffer(length)
count         = c_ulong(0)
mbi           = MEMORY_BASIC_INFORMATION()

while cursor < 0xFFFFFFFF:
    save_block = True

    bytes_read = kernel32.VirtualQueryEx(
        h_process,
        cursor,
        byref(mbi),
        sizeof(mbi))

    if bytes_read < sizeof(mbi):
        break
If our call to VirtualQueryEx() fails, we assume that we have exhausted the available user space and break out of the read loop. For each discovered block of memory in our loop, we check for favorable page permissions:
if mbi.State != MEM_COMMIT or
   mbi.Type  == MEM_IMAGE:
    save_block = False

if mbi.Protect & PAGE_READONLY:
    save_block = False

if mbi.Protect & PAGE_EXECUTE_READ:
    save_block = False

if mbi.Protect & PAGE_GUARD:
    save_block = False

if mbi.Protect & PAGE_NOACCESS:
    save_block = False
If we come across a memory block that we wish to include in our snapshot, we read the contents of the block using the ReadProcessMemory()[16] API and store the raw data as well as the memory information in our snapshot list. Finally, we increment the memory-scanning cursor and continue:
if save_block:
    kernel32.ReadProcessMemory(
        h_process,

        mbi.BaseAddress,
        read_buf,
        mbi.RegionSize,
        byref(count))

    memory_blocks.append((mbi, read_buf.raw))

cursor += mbi.RegionSize
You might immediately notice that our methodology is flawed. What if a given page at the time of our snapshot is marked as PAGE_READONLY but later updated to be writeable and modified? Good point; the answer is that we miss those cases. We never promised that the approach would be perfect! In fact, let’s take this opportunity to again stress the experimental nature of this subject. For the curious readers out there, one potential solution to this shortcoming is to “hook” the various functions that adjust memory permissions and modify our monitoring based on observed modifications.
Our two steps combined provide the necessary elements for taking and restoring process-specific snapshots.
This is the point where we switch gears from science to art, as there is no definitive approach to choosing our hook points. The decision will require the experience of a seasoned reverse engineer. In essence, we are looking for the start and end of code responsible for parsing user-controlled data. Provided that you have no prior knowledge of the target software, tracing with a debugger is a good start for narrowing down the decision range. Debugger tracing is covered in greater detail in Chapter 23, “Fuzzer Tracking.”
To get a good feel for this, we will later walk through an example.
The final step on our long checklist of prerequisites is choosing the memory locations to mutate. Again, this process can be more of an art than a science and tracing with a debugger can assist in our search. In general, however, we should have chosen an initial hook point such that a pointer to our target data or memory space exists in the near vicinity.
As you no doubt have gathered by now, writing a debugger takes a good amount of work. Luckily, everything we have covered up to this point (and more) has already been written for you by the authors in a convenient Python class called PyDbg.[17] Why didn’t we mention this earlier, you might be asking yourself in annoyance? Well, we lied to you. The fundamentals are important to understand and chances are you would not have paid attention if we had informed you of the shortcut from the start.
Process instrumentation via the Windows debugging API is a breeze with PyDbg. With PyDbg you can easily do the following:
Read, write, and query memory.
Enumerate, attach, detach, and terminate processes.
Enumerate, pause, and resume threads.
Set, remove, and handle breakpoints.
Snapshot and restore process state (the SR in SRM).
Resolve function addresses.
More...
Consider the following simple example, where we instantiate a PyDbg object, attach to the target process on PID 123, and enter the debug loop:
from pydbg import *
from pydbg.defines import *

dbg = new pydbg()
dbg.attach(123)
dbg.debug_event_loop()
That’s not all that exciting, so let’s add some more functionality. Building on the previous example, in the next snippet we set a breakpoint on the Winsock recv() API call and register a callback handler to be called whenever a breakpoint is hit:
from pydbg import *
from pydbg.defines import *

ws2_recv = None

def handler_bp (pydbg, dbg, context):
    global ws2_recv

    exception_address =
      dbg.u.Exception.ExceptionRecord.ExceptionAddress

    if exception_address == ws2_recv:
        print "ws2.recv() called!"

    return DBG_CONTINUE

dbg = new pydbg()
dbg.set_callback(EXCEPTION_BREAKPOINT, handler_bp)
dbg.attach(123)

ws2_recv = dbg.func_resolve("ws2_32", "recv")
dbg.bp_set(ws2_recv)

dbg.debug_event_loop()
The bold text in the preceding snippet highlights our additions. The first addition you see is our defining of a function, handler_bp(), which takes three arguments. The first argument receives our instance of PyDbg. The second argument receives the DEBUG_EVENT[18] structure from the debug event loop and contains a variety of information about the debugging event that just occurred. The third argument receives the context of the thread within which the debugging event occurred. Our breakpoint handler simply checks if the address at which the exception occurred is the same address of the Winsock recv() API. If so, a message is printed. The breakpoint handler returns DBG_CONTINUE to signal to PyDbg that we are done processing the exception and PyDbg should let the target process continue execution. Looking back at the main body of our debugger script, you will see the addition of a call to the PyDbg routine set_callback(). This routine is used for registering a callback function for PyDbg to handle a specified debug event or exception. In this case we were interested in calling handler_bp() whenever a breakpoint is hit. Finally, we see the addition of calls to func_resolve() and bp_set(). The former call is made to resolve the address of the recv() API within the Windows module ws2_32.dll and store it in a global variable. The latter call is made to set a breakpoint at the resolved address. When attached to a target process, any calls to the Winsock recv() API will result in the debugger displaying the message “ws2.recv() called” and continue execution as normal. Again, this is not terribly exciting, but now we can take another leap forward and create our first proof of concept in-memory fuzzer.
Having covered a lot of background and prerequisite information, it’s about time we produced an initial proof of concept to show you that all of this theoretical nonsense might actually be doable. On the fuzzing.org Web site, you will find fuzz_client.exe and fuzz_server.exe, including the source code for both. Don’t study the source code just yet. To reproduce a more real-world scenario, let’s assume that reverse engineering is required. This client–server pair is a very simple target. The server, when launched, binds to TCP port 11427 and waits for a client connection. The client connects and sends data to the server, which is later parsed. How is it parsed? We don’t really know, and we don’t really care at this point, as our goal is to fuzz the target, not review source or binary code. Let’s begin by first launching the server:
$ ./fuzz_server.exe
Listening and waiting for client to connect...
Next, we launch the client, which takes two arguments. The first argument is the IP address of the server. The second argument is the data to transmit to the server for parsing:
$ ./fuzz_client.exe 192.168.197.1 'sending some data'
connecting....
sending...
sent...
The client successfully connected to the server on 192.168.197.1 and transmitted the string “sending some data.” On the server side we see the following additional messages:
client connected.
received 17 bytes.
parsing: sending some data
exiting...
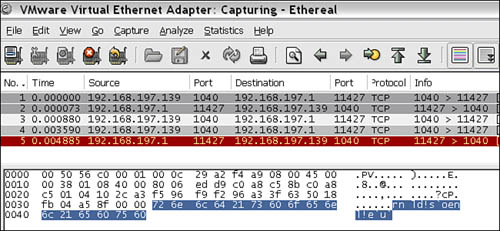
The server successfully received our transmitted 17 bytes, parsed it, and then exited. When examining the packets that traverse across the network, however, we are unable to locate our data. The packet that should contain our data appears right after the TCP three-way handshake, but instead contains the following bytes as highlighted in the screen shot from Ethereal[19] in Figure 20.7.
The Ethereal network sniffer project has moved to Wireshark and is available for download from http://www.wireshark.org
Figure 20.7. Ethereal client–server data capture
The client must have mangled, encrypted, compressed, or otherwise obfuscated the packet data prior to writing it onto the wire. On the server side, it must have deobfuscated the packet data prior to parsing it because we can see the correct string in the output message log. Fuzzing our example server in the traditional manner requires that we reverse engineer the obfuscation routine. Once the secrets of the obfuscation method are revealed we can generate and send arbitrary data. When you see the solution later, you will realize that doing so would have been quite trivial in this case. However, for the sake of sticking with our example, we assume that the obfuscation method will take considerable resources to reverse engineer. This is a perfect example of when in-memory fuzzing can be valuable (surprise, surprise; this was, after all, a contrived example). We will avoid the need for deciphering the obfuscation routine by instead “hooking” into fuzz_server.exe after it has already deobfuscated our transmitted data.
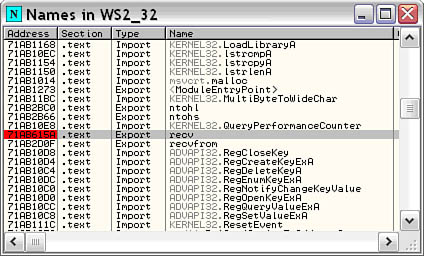
We need to pinpoint two locations within fuzz_server.exe to accomplish our task. The first is the snapshot point. At what point of execution do we want to save the state of the target process? The second is the restore point. At what point of execution do we want to rewind the state of the process, mutate our input, and continue our instrumented execution loop? The answer to both questions requires a little input tracking with a debugger. We’ll use OllyDbg,[20] a freely available powerful Windows user-mode debugger. Describing the usage and functionality of OllyDbg almost warrants a book of its own, so we’ll assume you are already familiar with it. The first thing we need to do is determine where fuzz_server.exe receives data. We know it does so over TCP so let’s load fuzz_server.exe into OllyDbg and set a breakpoint on the WS2_32.dll recv() API. We do so by bringing up the module list, selecting WS2_32.dll, and pressing Ctrl + N to bring up the list of names within this module as shown in Figure 20.8. We then scroll down to recv() and press F2 to enable the breakpoint.
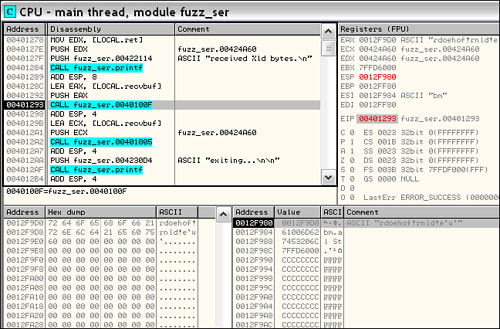
With our breakpoint set, we press F9 to continue execution and then run our fuzz_client, just as we did before. As soon as the data is sent, OllyDbg pauses fuzz_server because the breakpoint we set gets hit. We then press Alt + F9 to “Execute til user code.” Now the call from fuzz_server into WS2_32 is visible. We press F8 a few times and step over the call to printf(), which displays the server message stating how many bytes were received. Next, as shown in Figure 20.9, we see a call to an unnamed subroutine within fuzz_server at 0x0040100F. Examining the first argument to this function within the OllyDbg dump window reveals that it is a pointer to the obfuscated form of our data that we saw in Ethereal. Could the routine at 0x0040100F be responsible for deobfuscating the packet data?
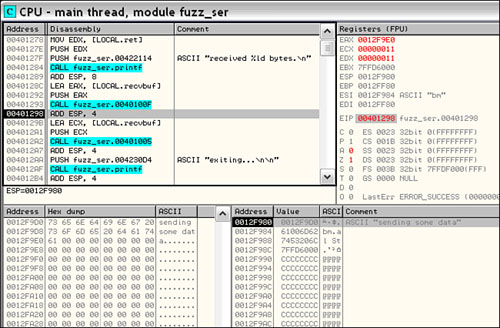
There is one easy way to find out: Let it execute and see what happens. We press F8 again to step over the call. We can immediately see, as in Figure 20.10, that our obfuscated data in the dump window has been transformed.
Great! So we know that our snapshot point has to occur at some point after this routine. Looking further down we see a call to an unnamed routine at 0x00401005 and then a call to printf(). We can see that the string “exiting...” is passed as an argument to printf() and recalling from the previously observed behavior of fuzz_server we know that it will soon exit. The routine at 0x00401005 must be our parse routine. Stepping into it with the F7 key reveals an unconditional jump to 0x00401450, the true top of our suspected parse routine shown in Figure 20.11.
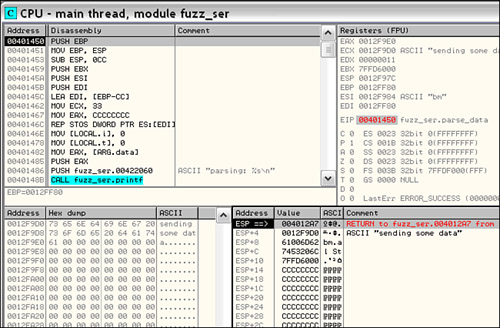
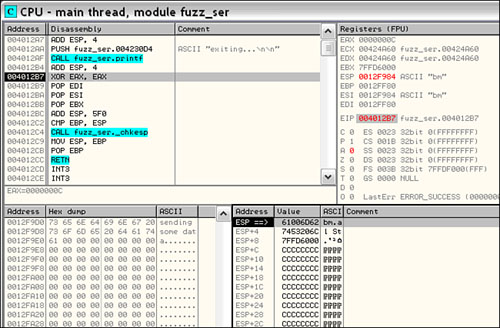
Notice that our deobfuscated string “sending some data” appears as the first argument to the parse routine at ESP+4. This looks like a good point for our snapshot hook. We can save the entire state of the process at the top of the parse routine and then at some point after the parse routine is complete restore the process state back. Once we have restored the process, we can modify the contents of the data to be parsed, continue execution, and repeat the process indefinitely. But first, we’ll need to locate the restore point. We press Ctrl + F9 to “Execute til return” then press F7 or F8 to get to our return address where, just as in Figure 20.12, we see the call to printf() with the string “exiting[el]” again. Let’s choose a restore point after the call to printf(), at 0x004012b7, so we can see fuzz_server print “exiting[el]” prior to the restore. We do this because it makes us feel good that fuzz_server wants to exit but we don’t let it.
We know that the routine at 0x0040100F is responsible for decoding. We know that the routine at 0x00401450 is responsible for parsing the decoded data. We’ve chosen the start of the parser as our snapshot and mutation point. We somewhat arbitrarily chose 0x004012b7 as the restore point, after the call to printf(“exiting[el]”). We have all the necessary pieces to start coding now and Figure 20.13 presents a conceptual diagram of what we’re going to be doing.
Implementing the in-memory fuzzer with PyDbg does not require much more work than what we have already seen. We begin with our required imports and by defining global variables to store information such as our chosen snapshot and restore points. We then get into the standard PyDbg skeleton code, instantiating a PyDbg object, registering callbacks (the meat and potatoes of this, which we define later), locating our target process, attaching to the target process, setting breakpoints on the snapshot and restore points, and finally entering the debug event loop:
from pydbg import *
from pydbg.defines import *

import time
import random

snapshot_hook  = 0x00401450
restore_hook   = 0x004012B7
snapshot_taken = False
hit_count      = 0
address        = 0

dbg = pydbg()
dbg.set_callback(EXCEPTION_BREAKPOINT,handle_bp)
dbg.set_callback(EXCEPTION_ACCESS_VIOLATION,handle_av)

found_target = False
for (pid, proc_name) in dbg.enumerate_processes():
    if proc_name.lower() == "fuzz_server.exe":
        found_target = True
        break

if found_target:
    dbg.attach(pid)
    dbg.bp_set(snapshot_hook)
    dbg.bp_set(restore_hook)
    print "entering debug event loop"
    dbg.debug_event_loop()
else:
    print "target not found."
Of the two defined callbacks, the access violation handler is easier to digest, so let’s cover that first. We registered this callback in the first place, to detect when a potentially exploitable situation has occurred. It’s a fairly simple block of code to understand and it can be easily repurposed in other PyDbg applications. The routine begins by grabbing some useful information from the exception record, such as the address of the instruction that triggered the exception, a flag letting us know whether the violation was due to a read or write, and the memory address that caused the exception. An attempt is made to retrieve the disassembly of the offending instruction and print a message instructing you of the nature of the exception. Finally, prior to terminating the debuggee, an attempt is made to print the current execution context of the target at the time of the exception. The execution context contains the various register values, the contents of the data to which they point (if it is a pointer), and a variable number of stack dereferences (in this case we specified five). For more details regarding the specifics of the PyDbg API, refer to the in-depth documentation at http://pedram.redhive.com/PaiMei/docs/PyDbg/.
def handle_av (pydbg, dbg, context):
    exception_record  = dbg.u.Exception.ExceptionRecord
    exception_address = exception_record.ExceptionAddress
    write_violation   = exception_record.ExceptionInformation[0]
    violation_address = exception_record.ExceptionInformation[1]

    try:
        disasm = pydbg.disasm(exception_address)
    except:
        disasm = "[UNRESOLVED]"
        pass

    print "*** ACCESS VIOLATION @%08x %s ***" %
      (exception_address, disasm)

    if write_violation:
        print "write violation on",
    else:
        print "read violation on",

    print "%08x" % violation_address

    try:
        print pydbg.dump_context(context, 5, False)
    except:
        pass

    print "terminating debuggee"
    pydbg.terminate_process()
Alternatively, we can catch access violations in another debugger such as OllyDbg. To do so, your debugger of choice must be configured with the operating systems as the just-in-time (JIT)[21] debugger. Then the body of the access violation handler can be replaced with:
def handle_av (pydbg, dbg, context):
    pydbg.detach()
    return DBG_CONTINUE
When an access violation does occur, the familiar dialog box shown in Figure 20.14 will appear.
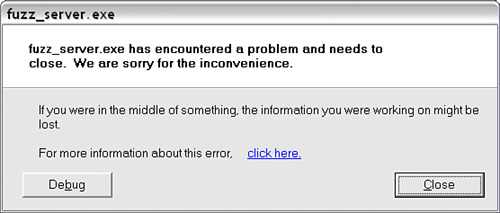
Selecting the Debug button will pop up your registered JIT debugger for a closer view of what exactly went wrong within the target. The last component to our in-memory fuzzer is the heart of the application, the breakpoint handler. The breakpoint handler will be called whenever execution of fuzz_server reaches the snapshot and restore points on which we previously set breakpoints. This will be the hairiest block of PyDbg code we have seen, so let’s dissect it piece by piece. At the top of the function we define the global variables that we will be accessing and grab the address where the breakpoint occurred as the exception_address.
def handle_bp (pydbg, dbg, context):
    global snapshot_hook, restore_hook
    global snapshot_taken, hit_count, address

    exception_address =
      dbg.u.Exception.ExceptionRecord.ExceptionAddress
We then check to see if we are at the snapshot hook point. If so, we increment the hit_count variable and print a message regarding our current location.
if exception_address == snapshot_hook:
    hit_count += 1
    print "snapshot hook hit #%d
" % hit_count
Next, we check the boolean flag snapshot_taken. If a snapshot of fuzz_server has not previously been taken, we do so now by calling the PyDbg process_snapshot() routine. We wrap the operation with a timer for informational purposes and update the flag to True.
# if a process snapshot has not yet been
# taken, take one now.
if not snapshot_taken:
    start = time.time()
    print "taking process snapshot...",
    pydbg.process_snapshot()
    end = time.time() - start
    print "done. took %.03f seconds
" % end
    snapshot_taken = True
Keep in mind that we are still within the if-block where the exception address is equivalent to the hook point. The next block of code takes care of data mutation. The conditional check on hit_count ensures that we do not mutate the argument until after the first iteration through the parse routine with the original data. This is not a necessary requirement. If a previously allocated address was found (it will become clear where this address comes from in a moment), we free it using the PyDbg convenience wrapper virtual_free().
if hit_count >= 1:
    if address:
        print "freeing last chunk at",
        print "%08x" % address
        pydbg.virtual_free(
            address,
            1000,
            MEM_DECOMMIT)
While we are still in the hit_count >= 1 if-block, we allocate a chunk of memory in the process space of fuzz_server using the PyDbg convenience wrapper virtual_alloc(). This is the allocation that we just saw a free for. Why do we allocate memory in the first place? Because instead of modifying the original data passed to the parse routine in place, it is easier for us to place our mutated data elsewhere in the process space of fuzz_server and then simply modify the pointer from the original data to our mutant block. One caveat to note here is that potential stack corruptions might appear as heap corruptions as the vulnerable buffer is being potentially moved off of the stack.
print "allocating memory for mutation"
address = pydbg.virtual_alloc(
    None,
    1000,
    MEM_COMMIT,
    PAGE_READWRITE)
print "allocation at %08x
" % address
We assume that the server might only be able to parse ASCII data and use a simple data generation “algorithm” to fill the allocated mutant block with fuzz data. Starting with a long string of A characters, we choose a random index into the string and insert a random ASCII character. This is simple enough:
print "generating mutant...",
fuzz = "A" * 750
random_index = random.randint(0, 750)
mutant  = fuzz[0:random_index]
mutant += chr(random.randint(32,126))
mutant += fuzz[random_index:]
mutant += "x00"
print "done.
"
Next, we write the fuzz data into the previously allocated memory chunk using the PyDbg convenience routine write_process_memory():
print "writing mutant to target memory"
pydbg.write_process_memory(address, mutant)
print
Finally, we modify the function argument pointer to point to our newly allocated memory block. Recall from Figure 20.11 that the pointer to the buffer containing our original deobfuscated data lies at positive offset four from our current stack pointer. We then continue execution.
print "modifying function argument"
pydbg.write_process_memory(
    context.Esp + 4,
    pydbg.flip_endian(address))
print

print "continuing execution...
"
Looking back at the remainder of the breakpoint callback handler definition we have a final if-block that handles snapshot restores when the restore hook point is reached. This is done by simply calling the PyDbg process_restore() API routine. Again, we wrap the block with a timer for informational purposes:
if exception_address == restore_hook:
    start = time.time()
    print "restoring process snapshot...",
    pydbg.process_restore()
    end = time.time() - start
    print "done. took %.03f seconds
" % end
    pydbg.bp_set(restore_hook)

return DBG_CONTINUE
That’s it ... we’re ready to put this bad boy to the test, so we launch the server:
$ ./fuzz_server.exe
Listening and waiting for client to connect...
We launch the in-memory fuzzer:
$ ./chapter_20_srm_poc.py
entering debug event loop
$ ./fuzz_client.exe 192.168.197.1 'sending some data'
connecting....
sending...
sent...
As soon as the client transmits its payload, the snapshot hook point is reached and our in-memory fuzzer kicks into action:
snapshot / mutate hook point hit #1
taking process snapshot... done. took 0.015 seconds
A snapshot is taken and execution continues. Parsing is completed, and fuzz_server prints its output messages and then wants to exit:
received 17 bytes.
parsing: sending some data
exiting...
Before it has a chance to exit, however, the restore hook point is reached and our in-memory fuzzer kicks into action again:
restoring process snapshot... done. took 0.000 seconds
The process state of fuzz_server has been successfully rewound to our snapshot point and execution continues. This time, because hit_count is now greater than 1, the mutation block within the breakpoint handler is executed:
snapshot / mutate hook point hit #2

allocating chunk of memory to hold mutation
memory allocated at 003c0000

generating mutant... done.
writing mutant into target memory space

modifying function argument to point to mutant

continuing execution...
Memory was allocated, a fuzz mutant was generated and written into fuzz_server, and the argument pointer was modified. When execution continues, fuzz_server’s output messaging confirms the success of our first snapshot restore mutation:
parsing:
AAAAAAAAAAAAAAAAAAAAAAAAAAAAAAAAAAAAAAAAAAAAAAAAAAAAAAAAAAAAAAAAAAAAAAAAAAAAAAAAAAAAAA
AAAAAAAAAAAAAAAAAAAAAAAAAAAAAAAAAAAAAAAAAAAAAAAAAAAAAAAAAAAAAAAAAAAAAAAAAAAAAAAA)AAAAA
AAAAAAAAAAAAAAAAAAAAAAAAAAAAAAAAAAAAAAAAAAAAAAAAAAAAAAAAAAAAAAAAAAAAAAAAAAAAAAAAAAAAAA
AAAAAAAAAAAAAAAAAAAAAAAAAAAAAAAAAAAAAAAAAAAAAAAAAAAAAAAAAAAAAAAAAAAAAAAAAAAAAAAAAAAAAA
AAAAAAAAAAAAAAAAAAAAAAAAAAAAAAAAAAAAAAAAAAAAAAAAAAAAAAAAAAAAAAAAAAAAAAAAAAAAAAAAAAAAAA
AAAAAAAAAAAAAAAAAAAAAAAAAAAAAAAAAAAAAAAAAAAAAAAAAAAAAAAAAAAAAAAAAAAAAAAAAAAAAAAAAAAAAA
AAAAAAAAAAAAAAAAAAAAAAAAAAAAAAAAAAAAAAAAAAAAAAAAAAAAAAAAAAAAAAAAAAAAAAAAAAAAAAAAAAAAAA
AAAAAAAAAAAAAAAAAAAAAAAAAAAAAAAAAAAAAAAAAAAAAAAAAAAAAAAAAAAAAAAAAAAAAAAAAAAAAAAAAAAAAA
AAAAAAAAAAAAAAAAAAAAAAAAAAAAAAAAAAAAAAAAAAAAAAAAAAAAAAAAAAAAAAA
exiting...
Notice the spliced in ) character, highlighted in bold. Again, fuzz_server wants to exit but never gets the chance because the process state is rewound at our restore point. At the next iteration the previously allocated memory chunk is freed, a new one is created and assigned, and the process continues. Although running this example on your own will yield differing results, when we ran it for the purposes of including the output in the book we received the following:
continuing execution...

restoring process snapshot... done. took 0.016 seconds

snapshot / mutate hook point hit #265

freeing last chunk at 01930000
allocating chunk of memory to hold mutation
memory allocated at 01940000

generating mutant... done.

writing mutant into target memory space

modifying function argument to point to mutant

continuing execution...

*** ACCESS VIOLATION @41414141 [UNRESOLVED] ***
read violation on 41414141
terminating debuggee
On the 265th iteration of our SRM proof of concept fuzzer a clearly exploitable vulnerability was found in our example target. The access violation @41414141 means that the process was attempting to read and execute an instruction from virtual address 0x41414141 and failed to do so, as that memory location is unreadable. 0x41, if you haven’t guessed by now, is the hexadecimal representation for the ASCII character A. Data from our fuzzer caused an overflow and overwrote a return address on the stack. When the function where the overflow occurred returned execution to the caller, the access violation occurred and was picked up by our fuzzer. Attackers can easily exploit this vulnerability, but don’t forget, the obfuscation routine will have to be deciphered to attack the server (in the real world you likely can’t easily instruct the client to send arbitrary data). Analyzing the source code or binary to reveal the exact nature and cause of this vulnerability is left as an exercise for the reader.
We have gone a long way in discussing a mostly theoretical and novel approach to fuzzing. The theory is interesting and reading through the breakdown of the application of the theory is worthwhile. However, we encourage readers to download the example files and run the example test for themselves. The noninteractive medium provided by a book does not do the example justice.
Hopefully the contents of the last two chapters were thought provoking and perhaps even applicable at some point for a specific problem that you might face. The PyDbg platform and example applications are all open source and free to tinker with. Simply download them from http://www.fuzzing.org and enjoy. As with all of our projects, it is our hope that improvements, bug reports, patches, and example uses are communicated back to us in an effort to keep the tools fresh and dynamic.
Although we strayed from the main focus of the book a bit in this chapter, the debugging knowledge gained within this chapter will assist you in general when attempting to automate exception detection. We revisit this topic in more detail in Chapter 24, where we discuss advanced exception detection.
[3] http://msdn.microsoft.com/library/default.asp?url=/library/en-us/debug/base/debugging_functions.asp
[4] http://msdn.microsoft.com/library/default.asp?url=/library/en-us/debug/base/debugging_events.asp
[5] http://msdn.microsoft.com/library/default.asp?url=/library/en-us/debug/base/debugging_structures.asp
[7] http://msdn.microsoft.com/library/default.asp?url=/library/en-us/debug/base/debugsetprocesskillonexit.asp
[8] http://msdn.microsoft.com/library/default.asp?url=/library/en-us/debug/base/waitfordebugevent.asp
[9] http://msdn.microsoft.com/library/default.asp?url=/library/en-us/debug/base/exception_record_str.asp
[10] http://msdn.microsoft.com/library/default.asp?url=/library/en-us/debug/base/getthreadcontext.asp
[11] http://msdn.microsoft.com/library/default.asp?url=/library/en-us/debug/base/setthreadcontext.asp
[13] Greg Hoglund, Runtime Decompilation, BlackHat Proceedings
[19] http://www.ethereal.com/, Ethereal: A Network Protocol Analyzer.