Chapter 10
The Art of Trading
Checklists
This chapter is a combination of trading checklists and what we've learned in this book. The checklists are helpful tips from my market experience. The second are the bullet items highlighted in the chapters and listed here for reference.
Before Buying
In the checklists that follow you'll see duplicate entries. The rules for not buying a stock are sometimes the same as for selling.
Here's what I look for before buying a stock:
- Check the averages. I review several each day: the S&P 500, the Dow Industrials, transports, utilities, and the NASDAQ composite. I use the S&P 500 as the proxy for the general market. If the stock I'm interested in is a tech firm, I'll look at the NASDAQ.
If the averages are climbing, that's a good sign. If the averages are trending lower, then wait for them to bottom before buying. A simple moving average may help call the turn. Many use a 200-day moving average. Before it turns up, have a shopping list ready so that when the turn comes, you can buy immediately. Be aware that when you add an indicator (such as a moving average) to the mix, you'll be buying late. Buying late is better than buying too soon.
- Check the market trend. Trade in the direction of the market trend. For me, that means buying when the market is rising and sitting in cash or collecting dividends from utility stocks in a down market.
When reviewing the general market, I look for support and resistance zones, then project price movement into the future. If I think the market will rise, then I'm more likely to buy. If I expect the market to drop, I'll avoid buying. However, I usually won't sell a well-performing stock just because I think that the general market or industry will go down.
- Flip to the weekly scale (or the next-highest period) and pay the most attention to the market trend. This removes the day- to-day noise that clutters the screen and shows you tradable trends.
I look for chart patterns on the daily scale, so I switch to the next-higher period to look for any threatening chart patterns in the stock I want to trade. Occasionally I'll use the monthly scale. If you trade intraday, then go to the next-higher period.
- Is the stock trending in the same direction as on the shorter time scale? If yes, then that supports a buying decision.
- Do you see any existing chart patterns? Price can find support at old chart patterns (like the apex of an ascending, descending, or symmetrical triangle).
- Do you see underlying support or overhead resistance? Those may cause pullbacks and throwbacks, respectively, which hurt performance.
- Draw trendlines to see where price may bounce off the trendline in the future. This is especially important in a declining price trend when you're trying to catch the bounce. That downsloping overhead trendline could stop price cold when price reaches it.
- Check the industry. Check other stocks in the same industry to get an idea of whether your trade will be successful. It's more important that the industry be trending upward than the general market, so give the industry more weight.
- Switch to the weekly scale and count the number of stocks trending up and trending down in the same industry. Most should be trending up over the last several months. I check the trend over one, two, and six months.
- Are the other stocks showing signs of topping out? If so, then consider skipping the trade.
- Are the other stocks bottoming? That may suggest a time to buy if price reverses.
- If you can show several stocks on the same screen, find which one leads the pack and study it for clues to future price direction.
- Score the chart pattern. I use my book, Trading Classic Chart Patterns, to score the chart pattern and gauge how likely the stock will reach the price target. If the score is negative, then I usually skip the trade. A surprising number of times a negative score has saved me from making a losing trade.
- Review the current chart pattern history. For the chart pattern you are about to trade, find others in the same stock and see how they performed in the past.
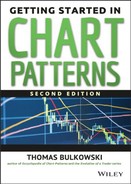
- Check the indicators. I used to check three indicators (commodity channel index, relative strength index, and Bollinger bands). They didn't add value to my trading, so I stopped using them. However, indicators are like garden tools. Sometimes you need a special tool to do the job. Two of those are divergence and failure swings.
If the indicator shows lower peaks but the stock has higher ones, then the stock will likely turn down. It might not happen immediately, but that is the way to bet. The reverse is true for bullish divergence. If the indicator has higher valleys but the stock has lower ones, the stock will likely turn upward—eventually. I like to see peaks or valleys about a month to six weeks apart. Divergence using peaks or valleys farther apart tends to be less reliable. I use the following:
- Is the stock price diverging from the indicator?
- Check for failure swings. These are little M- or W-shaped indicator patterns that may signal a short-term trend change.
- Figure 10.1 shows what I mean by divergence and failure swings between price and the relative strength index (RSI). The trendlines show price diverging with the indicator in July (bullish divergence) and November (bearish divergence). Failure swings appear in the circles, and they show short-term turning points in the price trend. I've read that failure swings should span the horizontal indicator signal lines (30 or 70 for the RSI) and point in the direction price should take, but I don't know how important that is. Only the November failure swing obeys those constraints, and price changes from trending up to going horizontal. The W-failure swings show timely price trend changes.
- Review the industry relative strength. This differs from the RSI. I measure the relative strength of the 55 industries that I check daily, ranked for the price change over time. (I mostly use the difference between the current closing price and that of six months ago.) I concentrate my trades on the top-10-performing industries and industries that are moving up the rankings at a good clip. You'll find that industries performing well will continue to do well, usually for months.
- Get a quote before trading. If the quote is lower than the last time you checked, delay buying. Why buy now when it will be cheaper later?
- Is the stock trending up? Wait for price to turn up before buying. Better yet, trade stocks moving up and don't wait for a reversal of the downtrend. View the stock on the weekly scale (or higher time scale) to help decide the trend.
- If the stock is up a lot, skip the trade. Don't chase a stock higher, intraday. If you buy after the stock gaps higher, the stock will come tumbling down. How high is high? I usually skip trades in which a stock is 75 cents higher than the prior close, but it depends on the stock. The stock has to be up over the prior day, but not by much, and trending higher to be a buy.
- Is the stock trading near the yearly high? For momentum traders, buying high and selling higher can be profitable. For a momentum trade, I buy stocks showing chart patterns near the yearly high, preferably breaking out to a new high. If they are making a new high, I don't have to worry about prior resistance zones (except for round numbers). When the breakout occurs, price coasts higher on momentum, allowing me to raise my stop and cut my potential loss.
However, if a chart pattern appears after a long-term uptrend, the trend may be near the end.
- Look for overhead resistance. How high is the price likely to climb before hitting resistance? If the answer is not much, then skip the trade or expect a throwback. Perhaps wait for the throwback and then buy when the stock resumes moving up.
- Look for underlying support. If the stock drops, you will want to know how far down it's likely to go. Nearby support helps with selecting a stop-loss point. Place a stop below nearby underlying support.
- Avoid mental stops. Don't use a mental stop (one kept in your head) unless you are a seasoned professional. Mental stops work best for day traders that are used to making split-second decisions. Regular stops work best for swing trade and some position trades, especially when you wish to lock in a profit. Avoid using stops for buy-and-hold investments; otherwise you risk being stopped out.
- How likely is a throwback or pull back? After a breakout, the stock returns to the breakout price, usually in just a few days. Consider initiating or adding to your position once price resumes the original breakout direction. However, the statistics show that chart patterns with throwbacks or pullbacks have worse performance than do those without throws or pulls.
- Check for dead-cat bounces. I won't trade any stock showing a dead-cat bounce within the last six months. Those companies with earnings problems often have one large decline following another.
- Price doesn't trend forever. If you are about to buy a stock that has been trending upward for several days in a row, the chances increase that you will be buying near a price peak. The same goes for consecutively declining prices. The trend may reverse soon after you sell. This, however, is not a license to hold onto a declining stock forever.
- Price versus market divergence. Intraday, if the stock is down when the market is up a lot, avoid the stock. Find out the reason why the stock is suffering when the market is climbing.
When to Sell
Each trading situation is different, but as your experience grows, you'll develop an inner voice that tells you when it is time to sell. Listen to that voice. Many of the trades that I've made within days of a high (and recounted in this book) are the result of listening to that voice coupled with supporting evidence. Since I can't lend you my voice of experience, here is a checklist of the supporting evidence that may suggest a sale:
![]() trading styles
trading styles
day trade: completing a trade in one day. Swing trade: buying at the swing low and selling at the swing high. Another way to say this is buying near a minor low and selling near a minor high. Position trade: A longer-term trade designed to catch the trend changes, when price is expected to make a major move (often in excess of 20%). Buy and hold: holding a stock, often for years, until fundamental or other factors change and a sale is called for.
- The stock is about to hit your stop. Sell it immediately. Why wait for price to hit your stop if you know it will?
- A bearish chart pattern has broken out downward. This is the classic sell signal. Exit the stock immediately. Hoping price will rise won't turn it around, but if it does, it is a pullback, and stock will soon head back down anyway. Sell it now!
- The chart pattern busts. If you own a stock and a bullish pattern appears, then good for you! But if the upward breakout busts (price drops to close below the bottom of the chart pattern), then expect a powerful move down. A busted chart pattern is a key sell signal.
- The stock has closed below an upsloping trendline. This is the first indication of a trend change, but I usually sell instead of waiting for additional evidence. Remember, the longer the trendline, the more reliable it is. Switch to the weekly (or higher time) scale and check the trendline again. Sell if the stock closes below the weekly trendline.
- Stock falls more than 62% retrace. Measure the retrace after an up move. Most will fall in the 38%, 50%, or 62% retrace amounts of the prior move. Anything more than that and expect price to continue down. A stop placed at the 67% (yes, 67%) retrace mark is far enough away to allow two-thirds of the trades to pass. In other words, you'll only be stopped out in one of every three trades, but the potential loss (or profit giveback) can be huge.
- The 1-2-3 trend change method signals a trend change. Review the discussion in the section “1-2-3 Trend Change Method” in Chapter 3. If the trend changes, get out.
- Price has hit the target. In many of my trades, I accurately pick how far price is going to rise before it stalls or reverses. For swing trades, place an order to sell at the target (or slightly below the nearest resistance zone). That will often get you out near the peak. For other trades, use a trailing stop. Raise the stop as price rises.
- The averages are dropping. The market is taking other stocks down along with yours, so it is time to get out. Flip to the weekly scale. If the trend is still down, then sell.
- Stocks in the industry are topping out. Any bearish chart patterns that appear in stocks in the same industry are warning bells. If other stocks are turning down, then consider selling. Rare is the stock that can swim against the industry current for long.
- Look at the weekly scale. New chart patterns, trendlines, and support and resistance zones all appear on the weekly chart, so use them as sell signals.
- The market is up, but the stock is down. When I get a stock quote, I also check the Dow industrials, NASDAQ composite, or S&P 500. If the Dow is up 100 points, but my stock is down, I will want to know why. This intraday price divergence I use as a warning, not as an automatic sell signal. Sometimes there's a good reason for the divergence.
- Historical price review. What happened the last time the stock made a new high, shot upward in a straight-line run, consolidated in a tight knot of price movement, dropped a few points in just days, or stalled at an old high? Past behavior can give you an indication of how well the stock will behave in the future. However, the more you rely on past behavior, the more likely the stock will surprise you.
- Check the indicators. Are your favorite indicators saying sell? Recognize that the more indicators you check, the more contradictions you'll have. Check a dozen indicators, and some will say buy, some sell, and some hold. What does the best indicator—price—say? Is price rising or falling? Is price trending up or down? Don't know? Then switch to the weekly scale and ask if price is rising or falling. If it's falling, then sell.
- Indicators are diverging from price. This is usually a reliable sell signal, but not an automatic one. Price can diverge from indicators for months before the stock turns down, if it turns down at all.
- Indicator failure swings. These M- and W-shapes in the indicator can call short-term turning points accurately.
- Overhead resistance. Has the stock hit overhead resistance and is now heading down? Sell.
- Is a throwback or pullback happening? Review the section on those. Throws and pulls happen often after a breakout. Initiate or add to your position after a throwback once price resumes moving up. For a pullback, it's often your last chance to exit a stock before the decline resumes. Take the sell signal and get out.
General Trading Tips
Consider the following trading tips as well:
- Tighten stops. If other stocks in the same industry begin trending down, then tighten the stop in the stock you own in that industry. If your stock shoots up several points in a few days, then tighten the stop because price may reverse and retrace much of the gain. See the inverted dead-cat bounce in Chapter 7.
- Trade tall patterns. Tall chart patterns outperform short ones. This is the single best predictor of chart pattern performance. What is short and tall? It varies from pattern to pattern, so refer to my book, Encyclopedia of Chart Patterns, second edition, for complete details.
- Narrowing prices. If the daily high-low range narrows over time, then expect a trend change. For example, a symmetrical triangle, with its narrowing price trend, shows this behavior. The breakout comes after the price range contracts and volume diminishes.
- Don't forget busted patterns. Chart patterns that break out downward then quickly reverse often soar higher than you expect. Jump aboard and ride the wave.
- Trade with the trend. If the market and industry are moving up, select stocks with upward breakouts. Avoid countertrend trades—the market or the industry is going down, and your stock is moving up. The rise will be less than you expect unless the market or industry reverses. If you buy a stock even though the market is trending lower, that's fine providing you expect the market to reverse shortly. Just hope that you don't get stopped out while waiting.
- Reversal chart patterns must have something to reverse. For example, if a diamond top appears several points above a price plateau and the breakout is downward, expect price to return to the plateau (often stopping just above it).
- Don't average down. If you buy and hold, then ignore this advice; you can likely ride out the downturn unless your stock is named Enron, WorldCom, Penn Central, United Airlines, or….
If a stock is declining, consider selling it. Don't add to your position hoping that it will eventually turn around. It may not, but, more likely, you'll get fed up and sell just days before it bottoms. Never try to prop up the price by buying more.
- Trade on the intraday scale. Switch to the intraday scale or the next-shorter period to place the trade. The shorter time scale will zoom into the price action and highlight support and resistance zones. I use the one- and five-minute scales to time my entry.
- Raise that stop as price rises. Check the volatility and place the stop no closer than 1.5 times the current price volatility. (See “Volatility Stops” in Chapter 7 for details.)
- Never lower a stop. If you feel a desire to lower a stop, sell the stock. Fall in love, but not with a stock.
- Follow the same stocks each day. Become familiar with them. Don't invest in unfamiliar stocks. Over time, you'll know when the stock is expensive and when it's cheap. The voice of experience will tell you when to buy and sell.
- Choose chart patterns that work for you. Some chart patterns perform better than others. Be selective and become an expert in the patterns you trade.
- Keep a trading diary and review it periodically. I log each trade and review recent trades periodically. I look for untimely entry and exits, bad habits that I've picked up—that sort of thing. It helps.
- Explore. Trading takes work. You have to believe the system you trade, or you'll ignore the signals. Explore new techniques that add value to your system and prune the deadwood as it becomes less effective.
- Diversify. If you see a symmetrical triangle in an oil services company, chances are other stocks in the same industry show the same pattern. Don't buy them all. I choose the most promising to trade and then look at other industries to help with diversification.
- Don't overdiversify. I overheard this at the library. “I had over 40 stocks in my portfolio. I couldn't keep track of them all.” I used to hold only about a dozen stocks. Since the last bear market, I have diversified my holdings so each position represents a small slice of the portfolio pie. I limit holdings to about three stocks per industry. I currently own 24 stocks in 16 industries (I consider cash an industry). The key is to hold at least 8 but no more than you are comfortable handling. Hold more stocks in a bull market, fewer to none in a bear market.
- Check commodities. I follow oil, copper, and natural gas because so many of the industries I track rely on them. If the price of oil is shooting up, the airlines, truckers, and chemicals may suffer, but oil service companies, refiners, and drillers should prosper.
- Tune your system. The markets change over time and so should your system and your trading style. When the markets are choppy, directionless, I make short-term trades. When the market is trending, I relax and my hold time increases.
- Ignore chat room chatter. Some of the worst trades I've made come from scenario trading. I'd read that the price of oil was predicted to rise because of a production shortage. Then I'd buy a refiner and get cleaned out when the price of oil dropped instead. Don't restrict this advice to the Internet chat room. Apply it to newspaper articles and television news as well. Don't trade scenarios. Buy-and-hold investors may do well with scenarios, but they can wait years.
- If you have to ask, you're making a mistake. If you have doubts about a trade, such that you feel compelled to ask someone's opinion about it, then skip the trade. Don't let others spend your money.
- Set price targets. With experience, you'll be able to tell when price is about to turn. Use the measure rule for the chart pattern (usually the pattern's height added to the breakout price) to predict a price target. For more conservative targets, use half the formation height projected upward. If the target and overhead resistance are nearly the same, then you've struck gold. Place a sell order to dump the stock just below overhead resistance. You may be early, but you never go broke taking a profit.
- Late entry. If you find that you are consistently late getting into a trade, then place an order to buy the stock a penny above the breakout price. I use that strategy, and it works. Premature breakouts happen infrequently (between 3% and 22% of the time for triangles, for example), so don't worry about them.
- Watch for a throwback or pullback. Price turns postbreakout in an average of 6 days and returns to the breakout usually in 10 or 11 days, so watch for that. Have faith that price will resume the original upward breakout direction—they do—65% of the time. Downward breakouts are more risky with 47% resuming the downward trend after a pullback.
- Don't short a stock. If you can't make money on the long side, you won't make it on the short side either. Try it on paper first.
- Price drops faster than it rises. I found this out when I reviewed the statistics measuring the time from the breakout to the ultimate high or low. Price trends after downward breakouts were quicker and steeper than their upward counterparts. This emphasizes the need to use stops to get out. If you can't sell, your losses will grow quickly.
 days to ultimate high or low
the average time from the date of the breakout to the date of the ultimate high or low.
- Price reverses one month after the breakout in a bear market. This is also true in a bull market, but less often. The one-month benchmark also varies from pattern to pattern. It's rarely shorter, but often longer—five to seven weeks after the breakout. I found a slight rise in the number of patterns reaching the ultimate low a month after the breakout, so don't expect price to turn on a dime every time.
- Price moves most in the first week after a breakout. I discovered this when looking at failure rates. This emphasizes the need to get in early after a breakout. The best way is to have a buy order positioned a penny above the breakout price. That will get you in early, and you won't have to worry as much about throwbacks taking you out.
Table 10.1 shows where in the yearly price range the chart pattern performs best. High means the pattern performs best when the breakout is within a third of the yearly high, low means within a third of the yearly low, and middle is the final third.
TABLE 10.1 Breakout Position in Yearly Price Range for Chart Patterns
Totals for upward breakouts: high, 13; middle, 7; low, 9.
Totals for downward breakouts: high, 5; middle, 6; low, 14.
The numbers show that upward breakouts perform best within a third of the yearly high. Downward breakouts perform best within a third of the yearly low. What does this mean? Buy stocks making new highs and sell them short when they make new lows.
Trading Psychology
In this checklist, I help you analyze your own trading psychology.
- Are you trading because you want to trade? Sometimes I find myself hunting for chart patterns because the market is moving higher and I'm not in the market. At other times, I'll trade then make another trade a few days later with disastrous results.
- Are you not trading? This is the opposite of trading too often. You may be so scared of taking a loss that you avoid trading altogether. Do enough research that you are confident your trading system works. Then get back into the game.
- If you get stopped out of several stocks, walk away. At the start of 2005, I was stopped out of every one of my stocks. That told me the market was tumbling so I let it drop while I remained in cash. When I started seeing a plethora of bottoming patterns appear, then I started getting interested again. That's the beauty of chart patterns. Bullish ones appear when the market is poised to move up or is rallying. They disappear in falling markets so you get stopped out and remain on the sidelines as the market corrects.
- Follow the system. Would you be making more money if you followed your trading system? Understand why you're ignoring the trading signals you receive.
- Don't overtrade. When I first started trading, I discovered that the more often I traded, the worse I did. With experience, the more I trade, the more I make (but a bull market helps). This happens to inexperienced day traders. They think that if they can just pull $100 or $500 out of the market each day, they'll be set. “If I only make a buck on each of a million trades, I'd be a millionaire.” If you cannot make money position trading or buying and holding, then it's unlikely you'll do well day trading or swing trading. Start with longer holding periods and move to the shorter ones as your trading experience grows. If you can't make it as a day trader, try swing trading.
- Learn from your mistakes. Are you making mistakes? If you don't review your trades periodically, you'll form bad habits that will lead to larger losses.
- Focus on the positive. The disaster you had today pales to the killing you made last week.
- Push the comfort zone. Make every trade seem rote. Don't let your losses bother you, and don't get too excited about your winners, either. An e-mail acquaintance wrote me that he was cutting his profits short. “Can you help?” I suggested that he might be holding on too tight. He was getting quotes too often instead of paying attention to his job, obsessing over every penny gained or lost. I suggested he check the stock once, at the end of the day, or flip to the weekly scale for his trades. He's trading much better now, and his stress level has gone down.
- Ignore profits. If you find yourself getting nervous about a winning trade or making too much money (believe me, it happens), then don't look at the bottom line. Concentrate not on the money but on improving your trading skills. Get used to making too much money. It's more important to trade properly. If you trade properly, the money will follow.
- Obey your trading signals. Otherwise, what are you trading for? Plan your trade and trade your plan.
- Don't trade when you're upset. This also goes for being too excited. I find this happens to me in a bull market. All of my stocks are exploding upward; everything I pick is a winner. That's when I know a huge loss is coming. And it does when I place a stop too far away just as the market turns, sucking my stock down with it.
- Abandoning a winning system. In a bull market when everything you trade seems to hit gold, you become bored. You chuck a winning system for something more exciting. An acquaintance told me that he made money in 9 out of 10 chart pattern trades. He decided to abandon his system and invested the proceeds in a company called Bre-X. He lost most of it when the authorities discovered the stock was a scam.
What We Learned
Here is a collection of tips and the location of where you can find them in this book.
Chapter 1: Introduction to Chart Patterns
- Chart patterns are recurring formations that appear on price charts. See “What Are Chart Patterns?”
- Use prior price action to help determine future price movement. See “Enter the Retail Investor.”
- Chart patterns issue clear buy signals. See “Advantages of Chart Patterns.”
- Chart patterns issue clear sell signals. See “Advantages of Chart Patterns.”
- Chart patterns do not lag price. See “Advantages of Chart Patterns.”
- The height of the chart patterns helps set a price target. See “Advantages of Chart Patterns.”
- You have to find chart patterns to use them. See “Disadvantages of Chart Patterns.”
- If you are late finding a chart pattern, its usefulness declines. See “Disadvantages of Chart Patterns.”
- Patience is required to wait for a buy signal. See “Disadvantages of Chart Patterns.”
- As with all trading techniques, stop placement can be tricky. See “Disadvantages of Chart Patterns.”
- Tall chart patterns may mean you are closer to the end of the trend than the beginning. See “Disadvantages of Chart Patterns.”
- Chart patterns can fail. See “Disadvantages of Chart Patterns.”
- Don't expect to become rich overnight in the markets. See “What Does It Mean?”
Chapter 2: Identifying Chart Patterns
- The blank chart shows price movement, uptrends, downtrends, and areas where price moves horizontally. See “The Blank Chart.”
- Begin constructing chart patterns by visually finding peaks that share similar prices. See “Connecting Peaks.”
- Two peaks that top out near the same price could form a double top. See “Connecting Peaks.”
- Search for chart patterns by looking for valleys that bottom near the same price. See “Connecting Valleys.”
- If multiple peaks stop near the same price, look at the valleys between the peaks for a better clue to their type. They could be triple tops, an ascending triangle, or a broadening pattern. See “Connecting Valleys.”
- Multiple valleys at a similar price could be a triple bottom, descending triangle, or a broadening pattern. See “Connecting Valleys.”
- Look for curves on the price chart and connect those curves with imaginary lines to form chart patterns. See “Patterns with Curves.”
- Curves appear in scallops, cup with handles, and rounding tops and bottoms. See “Patterns with Curves.”
- Several types of chart patterns use diagonal lines. Look for trendlines that slope upward or downward when searching for chart patterns. See “Patterns with Diagonals.”
- Use prior price action to help determine future behavior. See “Patterns with Diagonals.”
- Diagonal trends occur in many broadening patterns, diamonds, and wedges. See “Patterns with Diagonals.”
- Review the Index of Chart Patterns at the back of the book for a visual reference. See “That's a Wrap.”
Chapter 3: The Truth about Trendlines
- When price trends, a line connecting them is called a trendline. See “The Truth about Trendlines.”
- Beware buying a stock when a trendline marks nearby overhead resistance. See “A Trendline Example.”
- Trendlines come in three varieties: external, internal, and curved. External trendlines do not cut through price along its length. Internal trendlines slice through price frequently. Curved trendlines describe the shape of the trendline, but they can be external or internal. See “Trendlines: External, Internal, and Curved.”
- Upsloping trendlines connect the valleys of a rising price trend. See “External Trendlines.”
- Draw downsloping trendlines along the price peaks to indicate a possible trend change from down to up. See “External Trendlines.”
- Draw trendlines so that they highlight price movement best. See “Internal Trendlines.”
- Curved trendlines frequently cut though price. What's important is that the curve outlines price movement the best. See “Curved Trendlines.”
- Trendlines with touches spaced widely apart (about a month apart) perform better than do those with narrowly spaced touches. See “Touch Spacing.”
- The more times price touches a trendline, the more significant becomes a breakout from that trendline. See “Trendline Touches.”
- Long trendlines outperform short ones. See “Trendline Length.”
- The steeper the trendline, the worse the performance. See “Trendline Angles.”
- The aspect ratio describes the relationship of the width to the height of a chart. See “Trendline Angles.”
- Expect a larger price decline after a breakout from an upsloping trendline if volume is trending up. See “Trendline and Breakout Volume.”
- Expect a larger price rise after a breakout from a downsloping trendline if volume is trending down. See “Trendline and Breakout Volume.”
- Upsloping trendlines with heavy (above average) breakout volume mean a larger decline. See “Trendline and Breakout Volume.”
- Downsloping trendlines with light (average or below average) breakout volume mean a larger rise. See “Trendline and Breakout Volume.”
- The measure rule is a tool used to help predict how far price will move (up or down) after a breakout from a chart pattern. See “Measure Rule for Trendlines.”
- Convert the measure rule height for a trendline into a percentage price change to see if the target represents a realistic move. See “Measure Rule for Trendlines.”
- Use trendlines to highlight price (and volume) trends. See “Drawing Trendlines.”
- Sometimes, price forms channels, bouncing from side to side. Buy at the low end of the channel and sell at the high end for a swing trade. See “Drawing Trendlines.”
- Use the 1-2-3 trend change method to determine a significant change in trend. See “1-2-3 Trend Change Method.”
- The weekly scale gives reliable sell signals. If the stock punches through a trendline on the weeklies, then the chances improve that price will continue moving down. See “Sample Trade Using Trendlines”
- The logarithmic scale signals a trendline pierce earlier than the arithmetic scale. See “Sample Trade Using Trendlines”
- When price moves away from a trendline, momentum is increasing. When price moves toward the trendline, momentum is decreasing. When price rides along the trendline, the rate of change is constant. See “Advanced Trendline Tactics.”
- Trendline mirrors: Sometimes, a price bump on one side of the trendline reflects across the other side of the line as a dip, and vice versa. The measure rule is based on this. See “Advanced Trendline Tactics.”
- When price pierces a steep trendline, it often moves up at a slower rate, following a new trendline. See “Advanced Trendline Tactics.”
- When price pierces a downsloping trendline and makes a higher peak, connect the two peaks with an upsloping trendline. Then, draw a new line parallel to the original trendline starting at the low between the two peaks. The lower trendline will show where price is likely to reverse. See “Advanced Trendline Tactics.”
- Expect a pullback (downward breakout) or throwback (upward breakout) after price pierces a trendline. See “Advanced Trendline Tactics.”
- During strong uptrends, price may pierce a trendline and head down for about a month before resuming the uptrend at nearly the same angle. This stair-step rise is a chart pattern called a measured move up. The reverse also applies and forms a measured move down. See “Advanced Trendline Tactics.”
- When price pierces a trendline, look at the prior day's close. For upsloping trendlines, if the prior close was at or near the intraday high, the chances increase that the downward breakout is false. If the close was near the intraday low, then chances increase that the breakout is valid. See “Advanced Trendline Tactics.”
Chapter 4: Support and Resistance
- Support and resistance are areas of demand for and supply of stock, respectively, put in place by trader's fear and greed. See “What Is Support and Resistance?”
- Underlying support changes into overhead resistance as one trader's floor becomes another trader's ceiling. Support becomes resistance becomes support depending on which side price approaches. See “Chart Pattern SAR.”
- Price often retraces 38%, 50%, or 62% of the prior move, either up or down. See “Fibonacci Retracements.”
- A stop placed at a retracement of 67% of the prior up move will protect trades 66% of the time. See “Using Retracement Percentages.”
- Flags often appear midway through a steep rise or decline. See “Using Retracement Percentages.”
- The apex of a triangle is a known support or resistance zone. Extend the triangle's lines into the future for additional support or resistance areas. See “Using Retracement Percentages.”
- Peaks and valleys set up future underlying support and overhead resistance. See “Peaks and Valleys.”
- Table 4.1 shows how often price stops near peaks or valleys.
- Horizontal consolidation regions are knots of price congestion where a stock flattens. See “Horizontal Consolidation Regions.”
- Horizontal consolidation regions appear as prices with flat tops, flat bottoms, or both. See “Horizontal Consolidation Regions.”
- Price shows support and resistance at round numbers, numbers that end in zero. See “Round Number SAR.”
- To avoid stop running, place stops at odd numbers, those not ending in a zero. See “Round Number SAR.”
- Numbers that end in double zero ($1.00, $20.00 and so on) are useful as price targets for day traders. See “Round Number SAR.”
- Use price channels to determine where price is likely to turn in the future. See “Trendlines and Channels.”
- Trade tall channels by buying near the bottom of an upsloping channel and selling near the top or the reverse, sell short near the top and buy near the bottom of a downsloping channel. See “Trendlines and Channels.”
- Peaks formed with high volume stop price more often than do peaks formed with below-average volume. See “SAR and Volume.”
- Valleys formed with high volume stop price more often than do valleys formed with below-average volume. See “SAR and Volume.”
Chapter 5: Ten Buy Signals
Introduction
- If your mutual fund owns the stock, there is no need for you to buy it—you already own it. See the introduction.
- Don't fall in love with a stock just because it has a way-cool name. See the introduction.
High and Tight Flag
- High and tight flags are the best-performing chart pattern.
- See high and tight flag “Identification” for tips on finding these patterns.
- Look for overhead resistance that occurred in the past. If a horizontal congestion region appears at a price level above where the stock is trading, then that could act as a ceiling. See “Trading and Trading Tips.”
- Avoid loose-looking flags. See “Trading and Trading Tips.”
- For the best performance, flags should retrace between 10% and 25% of the height of the flagpole. See “Trading and Trading Tips.”
- Generally, the longer the flag, the worse the performance. See “Trading and Trading Tips.”
- A receding volume trend in the flag portion of the high and tight flag sees better postbreakout performance. See “Trading and Trading Tips.”
- High and tight flags with light breakout day volume tend to outperform. See “Trading and Trading Tips.”
- High and tight flags that do not throw back climb further after the breakout than those that do. See “Trading and Trading Tips.”
- For high and tight flags, use half the pattern's height added to the top of the pattern to get a target. See “Measuring Success.”
- A tighter stop could have limited the loss. See “Case Study.”
Pipe Bottoms
- See “Identification” for details on finding the pattern.
- Wait for price to close above the highest price spike before trading a pipe bottom. See “Trading and Trading Tips.”
- Pipes with short-term (zero to three months) downtrends leading to the pipe perform substantially better than intermediate- or long-term downtrends. See “Trading and Trading Tips.”
- Avoid overhead resistance on both the daily and weekly scales. See “Trading and Trading Tips.”
- Tall pipes perform better than short ones. See “Trading and Trading Tips.”
- Select pipes with a large price difference between the spike lows. See “Trading and Trading Tips.”
- Volume heavier on the left spike compared to the right suggests better performance. See “Trading and Trading Tips.”
- Pipes with a lower left spike tend to perform better than do those with a lower right spike. See “Trading and Trading Tips.”
- If price closes below the lower of the pipe bottoms, then exit your position. See “Trading and Trading Tips.”
- For swing traders, consider selling if price stalls near a prior peak. See “Measuring Success.”
Inverted and Ascending Scallops
- For scallop identification, see “Identification.”
- A series of inverted and ascending scallops that get narrower or shorter may signal the end of an uptrend. See “Identification.”
- For swing traders, buy when price makes a higher valley after completing the inverted and backward J with a price target of the scallop high. See “Trading and Trading Tips.”
- For other traders, buy when price closes above the highest peak in the pattern. See “Trading and Trading Tips.”
- If the pattern end points follow an existing upsloping trendline, buy when price rises above the trendline after the second inverted and ascending scallop touch. See “Trading and Trading Tips.”
- If price drops below the start of the pattern, then avoid trading the pattern. That means point 2 drops below point 1 in Figure 5.7. See “Trading and Trading Tips.”
- Place a stop just below the right valley of the inverted and ascending scallop. See “Trading and Trading Tips.”
- Patterns with a rising volume trend do better postbreakout. See “Trading and Trading Tips.”
- Breakout volume above the 30-day average means a larger average gain. See “Trading and Trading Tips.”
- Place a stop below the right side of the scallop. See “Trading and Trading Tips.”
- Avoid ascending and inverted scallops if the end is at or below the start. See “Trading and Trading Tips.”
- Use the height of the scallop to predict a target price. See Inverted and Ascending Scallops, “Measuring Success.”
Three Rising Valleys
- See “Identification,” for tips on how to find these patterns.
- When the peak between the first two valleys is higher than the peak between the last two valleys, draw a downsloping trendline connecting those peaks for an early buy signal. See “Identification.”
- Patterns with below-average breakout volume tend to perform better. See “Trading and Trading Tips.”
- When volume trends upward throughout the pattern, postbreakout performance improves. See “Trading and Trading Tips.”
- Sixty-seven percent act as reversals, and reversals perform better than continuations. See “Trading and Trading Tips.”
- Two out of three patterns break out within a third of the yearly high, and they perform best. See “Trading and Trading Tips.”
- Tall patterns perform better than short ones. See “Trading and Trading Tips.”
- Narrow patterns perform better than wide ones. See “Trading and Trading Tips.”
- Patterns both tall and narrow show postbreakout gains of 53%. See “Trading and Trading Tips.”
- Throwbacks occur 60% of the time, and when they occur, performance suffers. See “Trading and Trading Tips.”
- The farther up the price trend a three rising valleys pattern appears, the smaller the potential gain. See “Trading and Trading Tips.”
- Use the full height of the three rising valleys pattern applied to the highest peak to get a price target. For a closer target, use half the height in the computation. See “Measuring Success.”
Rounding Bottoms
- See “Identification” for a list of guidelines when searching for the pattern.
- Rounding bottoms in a rising price trend tend to outperform. See “Identification.”
- Use the weekly scale to find a rounding turn that is at the midway part of its development. Buy if you expect the industry and general market to trend upward. See “Trading and Trading Tips.”
- Swing traders can sell if price bumps up after the midway point— retracing a portion of the downward move that forms the left side of the cup. For all others, don't get too disappointed when price returns to just above the launch point. After price bottoms again and then resumes the uptrend, consider adding to your position. See “Trading and Trading Tips.”
- Count on price pausing near the level of the left cup lip. If the general market or industry is weak, then sell. See “Trading and Trading Tips.”
- If the rounding bottom has a handle, try drawing a downsloping trendline connecting the two cup lips and extending the line down beyond the handle. When price closes above the trendline in the handle, buy the stock or add to your position. See “Trading and Trading Tips.”
- The standard buy location is when price closes above the right cup lip— if it has a right lip. If not, buy when price closes above the price of the left cup lip. See “Trading and Trading Tips.”
- If price is predominantly flat leading to the rounding bottom—a flat base of several months duration—that often leads to a powerful rise after the breakout. See “Trading and Trading Tips.”
- Throwbacks only occur 40% of the time, but when they do occur, performance suffers. See “Trading and Trading Tips.”
- Patterns taller than the median height perform better than short ones. See “Trading and Trading Tips.”
- Wide patterns perform better. See “Trading and Trading Tips.”
- Patterns with breakouts near the yearly high perform best. See “Trading and Trading Tips.”
- The median time from the right cup lip to the breakout is 33 days. See “Trading and Trading Tips.”
- Use half the height of a rounding bottom to get a target price. See “Measuring Success.”
Descending Triangles
- See “Identification” for details on how to find them.
- Always wait for an upward breakout from a descending triangle. If the triangle breaks out downward, then wait to see if the downward breakout busts (and price closes above the top trendline). See “Trading and Trading Tips.”
- The most powerful breakouts from descending triangles happen near the triangle's apex. See “Trading and Trading Tips.”
- Avoid triangles too far along (up) the price trend. See “Trading and Trading Tips.”
- Nimble swing traders can buy near the horizontal trendline and sell when price turns at the top trendline. See “Trading and Trading Tips.”
- Extend the two trendlines into the future for support and resistance zones. See “Trading and Trading Tips.”
- The triangle apex acts as a future region of support and resistance. See “Trading and Trading Tips.”
- A buy signals when price closes outside the top trendline (an upward breakout). See “Trading and Trading Tips.”
- Patterns with breakout day gaps do well. See “Trading and Trading Tips.”
- Above-average breakout day volume tends to push price higher. See “Trading and Trading Tips.”
- Sixty-four percent of descending triangles act as continuations of the prior price trend. See “Trading and Trading Tips.”
- Use the height of a descending triangle to help gauge how far price may rise. See “Measuring Success.”
Ascending Broadening Wedges
- See “Identification” for tips on how to find them.
- A partial rise or decline from an ascending broadening wedge can get you into a trade sooner than waiting for a breakout. See “Trading and Trading Tips.”
- For swing traders, buy when price touches the lower trendline and sell as it approaches the top trendline, and then reverse the trade. See “Trading and Trading Tips.”
- Place an order to buy just above the third peak to capture a potential upward breakout. If price rises and makes a fourth trendline touch then begins heading down, sell immediately to avoid a return to the bottom trendline. See “Trading and Trading Tips.”
- For aggressive traders, place a buy order when price touches the bottom trendline for the third time and begins moving up. Watch for a partial rise to occur, and if one does, sell your position when price closes below the bottom trendline (or earlier to capture more profit), because price is likely to continue falling after a downward breakout. If price bounces off the top trendline instead of pushing through it, sell immediately. See “Trading and Trading Tips.”
- Tall patterns do better than short ones. See “Trading and Trading Tips.”
- Seventy-seven percent acted as continuations of the prior price trend. See “Trading and Trading Tips.”
- Use the height (or half the height) of the wedge added to the breakout price to get an upward target. See “Measuring Success.”
Eve & Eve Double Bottoms
- See “Identification” for guidelines on how to find double bottoms.
- Look for a shelf on the right bottom, a flat top that can act as a support zone. For swing traders, buy when price closes above this threshold and sell at confirmation if price stalls there. Be aware that the double bottom may become a triple bottom. See “Trading and Trading Tips.”
- For position traders and investors, buy when price closes above the confirmation price—the highest peak between the two bottoms. See “Trading and Trading Tips.”
- Sometimes, price will confirm the Eve & Eve double bottom and then waffle up and down, forming a handle. When price breaks out of this congestion region, it often (but not always) moves up in a strong trend. See “Trading and Trading Tips.”
- When the double bottom forms after a long, flat price trend (a flat base), the double bottom usually sports a large gain after the breakout. See “Trading and Trading Tips.”
- If a pipe bottom (or any other bullish chart pattern) forms as part of the right Eve bottom, then buy the stock when the pipe confirms. See “Trading and Trading Tips.”
- Eve & Eve double bottoms both short and narrow tend to outperform. See “Trading and Trading Tips.”
- Eve & Eve double bottoms without throwbacks perform significantly better than do those with throwbacks. See “Trading and Trading Tips.”
- Look for a big W pattern—an Eve & Eve double bottom with an unusually tall left side. The decline leading to the Eve & Eve double bottom should be a straight-line run of several points. Expect (hope, really) the breakout will return price to where it started the decline. See “Trading and Trading Tips.”
- Use the height of the double bottom added to the breakout price to get a target. See “Measuring Success.”
Triple Bottoms
- See “Identification” for tips on how to recognize triple bottoms.
- Triple bottoms that appear after a flat base tend to outperform. See “Trading and Trading Tips.”
- Triple bottoms often appear as the corrective phase of a measured move up. See “Trading and Trading Tips.”
- When a triple bottom appears after a decline, draw a downsloping trendline along the peaks before the triple bottom. Expect price to stall once it climbs to the trendline. See “Trading and Trading Tips.”
- Trade triple bottoms with short- to intermediate-term declines (declines up to six months). See “Trading and Trading Tips.”
- Triple bottoms with a price decline less than the 18% median decline leading to the chart pattern outperform. See “Trading and Trading Tips.”
- If a triple bottom appears after a decline from a peak, assume that prices will stall when they return to the price of the peak. See “Trading and Trading Tips.”
- If the third bottom has a flat area, then swing traders should buy when price closes above the flat threshold and sell at the confirmation price if price stalls there. See “Trading and Trading Tips.”
- For position traders and investors, buy when price closes above the confirmation price. See “Trading and Trading Tips.”
- Throwbacks hurt performance. See “Trading and Trading Tips.”
- If the last valley bottom is above the price of the second valley bottom, then expect better performance. See “Trading and Trading Tips.”
- Use the height of the triple bottom applied to the breakout price to get an estimate of how high price might climb. See “Measuring Success.”
Head-and-Shoulders Bottoms
- See “Identification” for guidelines on how to spot these chart patterns.
- For downsloping necklines, a close above the trendline signals a buy. See “Trading and Trading Tips.”
- For upsloping necklines, use a close above the highest peak in the head-and-shoulders bottom as the buy signal. See “Trading and Trading Tips.”
- Head-and-shoulders bottoms that appear after a flat base tend to outperform. See “Trading and Trading Tips.”
- When price declines in a straight line run leading to the head-and-shoulders bottom, expect price to recover to the top of the pattern. See “Trading and Trading Tips.”
- Head-and-shoulders bottoms with short-term declines (less than 3 months) leading to the pattern outperform. See “Trading and Trading Tips.”
- Throwbacks happen 52% of the time, and when they do occur, performance suffers. See “Trading and Trading Tips.”
- When volume is higher on the right shoulder, the head-and-shoulders bottom tends to outperform. See “Trading and Trading Tips.”
- Postbreakout performance improves for those head-and-shoulders bottoms with downsloping necklines. See “Trading and Trading Tips.”
- Tall patterns outperform, on average. See “Trading and Trading Tips.”
- Eighty-eight percent acted as reversals of the prior price trend. See “Trading and Trading Tips.”
- From the right shoulder valley, it takes an average of 12 days for the stock to climb to the breakout price. See “Trading and Trading Tips.”
- See “Measuring Success” for how to calculate a price target for the head-and-shoulders bottom.
Chapter 6: Ten Sell Signals
Head-and-Shoulders Tops
- See “Identification” for details on how to spot these patterns.
- A stock might not drop far if the industry or market are soaring. See “Identification.”
- When the neckline slopes downward, use a close below the right armpit as the sell signal. See “Trading and Trading Tips.”
- Look for head-and-shoulders tops with a short-term rise leading to the pattern. See “Trading and Trading Tips.”
- Pullbacks occur 54% of the time. See “Trading and Trading Tips.”
- Patterns with pullbacks tend to underperform. See “Trading and Trading Tips.”
- Tall patterns do well. See “Trading and Trading Tips.”
- The neckline slopes upward most often. See “Trading and Trading Tips.”
- Use the head-to-neckline height to help determine how far price is going to tumble. See “Measuring Success.”
- Try converting the height to a percentage of the stock's price to see if the drop is reasonable. See “Measuring Success.”
Diamond Tops and Bottoms
- Diamonds are rare and difficult to find. See “Diamond Tops and Bottoms.”
- Sometimes a quick decline follows a quick rise after a downward breakout from a diamond top (or a quick rise follows a quick drop after an upward breakout from a diamond bottom). See “Diamond Tops and Bottoms.”
- Expect your diamond to look lopsided. See “Identification.”
- See “Identification” for details on how to spot these patterns.
- Price must have something to reverse. See “Trading and Trading Tips.”
- Expect a high-velocity exit from a chart pattern if the velocity is high leading to it. See “Trading and Trading Tips.”
- Throwback and pullbacks hurt performance, so avoid diamonds with overhead resistance or underlying support. See “Trading and Trading Tips.”
- Select tall patterns for the best performance. See “Trading and Trading Tips.”
- Sometimes, a chart pattern appears midway in a price trend. See “Half Staff Patterns.”
- The measure rule for diamonds uses the height of the diamond (from highest peak to lowest valley) applied to the breakout direction. See “Measuring Success.”
Double Tops
- See “Identification” for tips on how to spot double tops.
- Wait for confirmation before selling. See “Trading and Trading Tips.”
- If the drop from the current price to the confirmation price is large, consider selling immediately, but recognize that price could reverse before confirming the double top. See “Trading and Trading Tips.”
- Double tops that appear well into a long-term (over 6 months) decline could mean the trend end is near. See “Trading and Trading Tips.”
- Expect a stock to return to the launch price—the start of the trend. See “Trading and Trading Tips.”
- Short-term trends (up to three months long) leading to the pattern suggest better postbreakout performance than intermediate- or long-term trends. See “Trading and Trading Tips.”
- Avoid underlying support because it can cause a pullback. Pullbacks hurt performance. See “Trading and Trading Tips.”
- Compute the height of the double top from highest peak to the lowest valley between the two tops and then divide by two. Subtract that height from the lowest valley to get a target price. See “Measuring Success.”
- I use double tops as sell signals for long holdings when the industry and market are also weak. See “Case Study.”
Ascending and Symmetrical Triangles
- See “Identification” for tips on how to recognize triangles.
- For the best performance, look for symmetrical triangles to form at the start of a trend. See “Trading and Trading Tips.”
- Patterns with pullbacks have postbreakout performance that suffers. If you see underlying support or overhead resistance, the stock may reverse there, and you may end with a loss. See “Trading and Trading Tips.”
- Tall patterns perform better than short ones. See “Trading and Trading Tips.”
- Ascending triangles with a short-term rise leading to the chart pattern climb an average of 39% after an upward breakout. Those with a short-term decline leading to the pattern show a 37% rise after an upward breakout. See “Trading and Trading Tips.”
- Symmetrical triangles with a rise leading to the chart pattern and a downward breakout tumble more. See “Trading and Trading Tips.”
- Use the measure rule to determine a target price. Calculate the height of the pattern and add it to an upward breakout price or subtract it from the downward breakout price. See “Measuring Success.”
- I used a trailing stop to protect profits. See “Case Study.”
- Avoid round numbers when placing stops. See “Case Study.”
- If a stock does not act as expected then consider selling it. See “Case Study.”
Flags and Pennants
- See “Identification” for tips on how to identify flags and pennants.
- Flags and pennants usually tilt against the prevailing price trend. See “Identification.”
- To reduce risk, wait for price to close above the top of the flag/flagpole or pennant/flagpole for an upward breakout. See “Trading and Trading Tips.”
- For the best performance, trade flags or pennants that retrace a portion of the prevailing price trend. See “Trading and Trading Tips.”
- Trade flags and pennants only after price has made a sharp, quick move. See “Trading and Trading Tips.”
- Pennants are more reliable than flags. See “Trading and Trading Tips.”
- Tight flags and pennants perform better than loose ones. See “Trading and Trading Tips.”
- Avoid overhead resistance or underlying support that may cause a throwback or pullback. See “Trading and Trading Tips.”
- Price moves down almost twice as far after tall flags than short ones. See “Trading and Trading Tips.”
- Flags with heavy breakout volume perform substantially better. See “Trading and Trading Tips.”
- Flags and pennants act as half-staff patterns. See “Trading and Trading Tips.”
- Pennants pull back 31% of the time. See “Trading and Trading Tips.”
- Flags pull back 52% of the time. See “Trading and Trading Tips.”
- See “Measuring Success,” for instructions on how to apply the measure rule.
- If you “know” (anticipate) a stop loss order will be hit, then consider selling immediately. See “Case Study.”
Pipe Tops
- Pipe tops on the weekly scale perform better than do those on the daily charts. See “Pipe Tops.”
- See “Identification” for tips on how to find pipes.
- Look for underlying support to help gauge how far price is likely to drop. See “Trading and Trading Tips.”
- Select tall pipes. See “Trading and Trading Tips.”
- Pipes within a third of the yearly low decline most. See “Trading and Trading Tips.”
- Pipes with tall spikes perform better. See “Trading and Trading Tips.”
- See “Measuring Success” for help with the measure rule for pipes.
Measured Moves and the Simple ABC Correction
- In an ideal measured move, the lengths of the two legs are equal. See “Identification.”
- See “Identification” for guidelines on recognizing measured moves.
- See “The Simple ABC Correction” for identification guidelines.
- For the simple ABC correction, buy only if the market and industry are both trending upward, so the stock can make the most of upward momentum. See “Simple ABC Correction Trading Tips.”
- See “Simple ABC Correction Trading Tips” for additional trading tips.
- Trade a measured move once the corrective phase completes. See “MMD and MMU Trading Tips.”
- Try using measured move to estimate the price move. See “MMD and MMU Trading Tips.”
- Watch for overhead resistance setup by a trendline where price might reverse. See “MMD and MMU Trading Tips.”
- In a measured move up, price returns to the corrective phase 81% of the time. See “MMD and MMU Trading Tips.”
- In a measured move down, price returns to the corrective phase 84% of the time. See “MMD and MMU Trading Tips.”
- The larger the corrective phase retrace, the better the chance of meeting the price target. See “MMD and MMU Trading Tips.”
- A longer corrective phase means a more powerful move. See “MMD and MMU Trading Tips.”
- See “MMU and MMD Performance Profiles” to details on the legs and corrective phase lengths.
- See “Measuring Success” for details on applying the measure rule.
Broadening Tops and Bottoms
- See “Identification” for tips on what to look for.
- For skilled swing traders, buy when price bounces off the lower trendline and sell when it reverses at the top one. See “Trading and Trading Tips.”
- For all traders, buy after price touches the lower trendline for the third time. Watch for a partial rise to occur, but hope for an upward breakout. See “Trading and Trading Tips.”
- Trade in the direction of the breakout. That means buying after an upward breakout, or selling after a downward one. See “Trading and Trading Tips.”
- See “Trading and Trading Tips” for additional tips specific to broadening tops and bottoms.
- Use half the height of the pattern applied to the breakout price to get a target. See “Measuring Success.”
Triple Tops
- See “Identification” for tips on finding triple tops.
- If you can connect the two valleys of a triple top with an upsloping trendline, then sell when price closes below the line. See “Trading and Trading Tips.”
- If price fails to reach the level of the middle peak in a triple top, expect a more powerful decline. See “Trading and Trading Tips.”
- Price doesn't decline far after many triple tops. See “Trading and Trading Tips.”
- Triple tops with a high-velocity move going into the chart pattern often result in a high-velocity move after the breakout. See “Trading and Trading Tips.”
- Pullbacks occur 61% of the time. See “Trading and Trading Tips.”
- Patterns with pullbacks underperform, on average. See “Trading and Trading Tips.”
- Tall patterns (both narrow or wide) perform better than the other combinations of height and width. See “Trading and Trading Tips.”
- Twenty-eight percent of the triple tops reach the ultimate low in the first week after a breakout; 38% bottom in less than two weeks. See “Trading and Trading Tips.”
- See “Measuring Success” for tips on how to apply the measure rule.
- Change the anticipated decline into a percentage of the breakout price as a reality check. Is the percentage drop too large to be believable? See “Measuring Success.”
Chapter 7: Special Situations
Bull and Bear Markets and Traps
- Trade with the market and industry trends.
- Avoid countertrend trades, those that go against the industry or market trend.
- Look at other stocks in the same industry and determine if they are trending higher or lower.
- Bull and bear traps need quick action to save a trade.
The Dead-Cat Bounce
- A dead-cat bounce sees the stock plunge during the event decline, bounces and then trends lower.
- Another dead-cat bounce can occur within three to six months.
- Sixty-seven percent of the time price will bottom 18% below the event low. See “Dead-Cat Bounce by the Numbers.”
- A second dead-cat bounce will occur 38% of the time within six months. See “Dead-Cat Bounce by the Numbers.”
- Avoid trading stocks with a dead-cat bounce for at least six months. See “Trading and Trading Tips.”
- Trying to determine when the stock has bounced is difficult. See “Case Study.”
The Inverted Dead-Cat Bounce
- An inverted dead-cat bounce sees a stock rise by 5% to 20% (sometimes more) in one session.
- Swing traders should sell the day after an inverted dead-cat bounce. See “Trading and Trading Tips.”
- For position traders and investors, consider holding if the announcement that sends price higher is earnings related. The stock may continue to climb. See “Trading and Trading Tips.”
- You never go broke taking a profit. See “Trading and Trading Tips.”
- I avoid taking a position in a stock three weeks or closer to an earnings announcement. See “Case Study 2.”
Flat Base
- Use a weekly chart, linear scale, to find the flat base pattern.
- A chart pattern forming at the end of a flat base can predict a strong up move.
Gaps
- Price closes the gap quickly in area or common gaps.
- A breakout day gap occurs when price breaks out of a chart pattern (on the breakout day) by gapping higher or lower.
- Bullish gaps occur in an uptrend and bearish ones occur in a downtrend.
Lower Highs and Higher Lows
- A rising price trend has higher peaks and higher valleys. A falling price trend has lower valleys and lower peaks.
- If price stalls near the price level of a prior peak, expect a reversal. However, the reversal may only be temporary before the upward move resumes.
Partial Rises and Declines
- Partial rise: In an established chart pattern (meaning the pattern has met all of the identification guidelines, including trendline touches), price will rise off the bottom trendline, but not touch or come that close to the top trendline before heading down and staging an immediate downward breakout.
- Partial decline: In an established chart pattern, price will drop below the top trendline, but not touch or come that close to the bottom trendline before moving up and staging an immediate upward breakout.
- Use a 62% Fibonacci retracement to help differentiate a partial rise or decline from a normal pause as price moves across a chart pattern.
- Bollinger bands: Periods of low volatility follow periods of high volatility (and the reverse). That means narrow Bollinger bands widen and wide ones narrow. See “Case Study.”
Quick Rises and Declines
- Sometimes a quick decline follows a quick rise. Diamond tops can show this behavior with the stock returning to just above the launch price.
- Flags and pennants show a quick rise following a quick rise when the breakout is upward. Know your chart pattern, especially half-staff patterns.
Spikes and Tails
- Tails (or spikes) are unusually long price spikes that can signal a reversal.
- A bullish tail pokes downward with a close near the day's high. A bearish tail spikes upward with a close near the day's low. In both cases, remember that price needs something to reverse, so look for them at the end of a strong trend.
- Often price will pause at the base of a tail, so you can take time to evaluate before acting on a tail.
Stops
- Stops come in a variety of configurations: trailing stop, volatility stop, minor high and minor low stop, and so on.
- A volatility stop helps prevent being stopped out by normal price movement. See “Volatility Stops.”
- A trailing stop trails price upward. See “Trailing Stops.”
Throwbacks and Pullbacks
- A throwback occurs when price curls back down within a month after an upward breakout from a chart pattern. A pullback is similar; only the breakout is downward. The stock climbs back to the breakout before resuming the downward trend.
- A breakout on high volume is more likely to throw back or pull back than one on low volume.
- Performance suffers after a throwback or pullback.
- Look for nearby overhead resistance or underlying support to help determine if a throwback or pullback will happen.
Chapter 8: Busted Patterns
- A busted pattern occurs when price breaks out in one direction, fails to move more than 10% before reversing and breaking out in the opposite direction. See the introduction.
- Chart patterns can single, double, or triple bust. A triple bust includes patterns that bust three or more times. See “Single, Double, and Triple Busts.”
- Broadening tops bust an upward breakout 28% of the time and downward breakouts 36% of the time. See “Broadening Top.”
- Ascending broadening wedges with upward breakouts can be difficult to trade. See “Broadening Wedge, Ascending.”
- A buy signals when price closes above the highest peak in the chart pattern. See “Broadening Formation, Right-Angled and Ascending.”
- The difference between a broadening bottom and top is the direction price enters the pattern. Bottoms have price entering from the top. See “Broadening Bottom.”
- Price breaks out when it closes outside of the wedge trendlines. See “Broadening Wedge, Descending.”
- Trade in the direction of the industry and market trends for a more successful trade. See “Broadening Formation, Right-Angled and Descending.”
- Wait for the diamond to bust before taking a position. Otherwise, you may be caught in a throwback or pullback. See “Diamond Top.”
- For an early entry to a busted double top, draw a line connecting the two peaks. If it slopes downward, then buy when price closes above the line. See “Double Top.”
- Unconfirmed double tops also bust and can make strong moves upward. Trade a busted unconfirmed double top as if it confirmed. See “Double Top.”
- Aggressive traders may want to buy when price closes above the right shoulder peak, or use a downsloping trendline connecting the head and right shoulder peaks and buy when the stock closes above the line. See “Head-and-Shoulders Top.”
- Wait for price to climb above the top or below the bottom of a diamond before trading. See “Diamond Bottom.”
- Wait for price to close below the lowest bottom in the double bottom or, for aggressive traders, look for a busted double bottom that has the right bottom above the left. A close below the trendline connecting those two bottoms may get you into the trade earlier. See “Double Bottom.”
- Chart patterns are consolidation or congestions areas where price pauses. A busted breakout from this area (and upward breakout followed by an extended reversal or a downward breakout followed by an extended rise) signals a trade. See “Head-and-Shoulders Bottom.”
- If you can't buy a stock within 5% of the optimum entry price, ignore the trade. See “Case Study 2.”
- Trade a busted rectangle when price closes outside the side opposite the breakout. See “Rectangles.”
- Don't forget to look for partial rises and decline in rectangles. See “Rectangles.”
- Triangles can breakout in either direction. If price reverses and closes outside the trendline boundary, it busts the pattern. See “Ascending Triangle.”
- For conservative traders, buy a busted downward breakout only when price closes above the top of the descending triangle. See “Descending Triangle.”
- Symmetrical triangles have multiple busts more than any other chart pattern studied. See “Symmetrical Triangle.”
- If price rises to the top of the wedge and then reverses, the move doesn't leave much profit potential and your timing must be exquisite. See “Falling Wedge.”
- Always look for overhead resistance (upward moves) and underlying support (downward moves) before trading. For wedges, the top or bottom are areas showing support or resistance. See “Rising Wedge.”
- A powerful up move may come after a long-term downtrend and busted downward breakout. See “Downtrend.”
- Be suspicious of short-term downtrends and busted patterns. See “Downtrend.”
- Trade cautiously busted patterns with upward breakouts after a long-term downtrend. See “Downtrend.”
- After a long-term rise, the upward breakout from a chart pattern may bust, leading to a significant reversal of the uptrend. See “Uptrend.”
- If the uptrend is short term and the pattern busts, expect a double busted pattern. See “Uptrend.”
- A busted chart pattern with a downward breakout after a long-term rise may double bust. See “Uptrend.”
- If the rise is short term, then the chart pattern may triple bust when it struggles to find a new trend. See “Uptrend.”
- See “Busted: How Often?”
- Table 8.19 shows how often several chart patterns bust.
- Table 8.20 provides the move after a single bust for popular chart patterns.
Chapter 9: More Trades
- Be cautious if you are trading under pressure, such as needing money for the next mortgage payment. Those trades have a tendency to go bad. See “IMC Global.”
- Don't short stocks making new yearly highs. See “IMC Global.”
- Don't sell a stock that continues to rise. See “IMC Global.”
- Avoid round numbers when placing stops and sell targets. See “IMC Global.”
- Compute a volatility stop to confirm that your stop is not too close so you can avoid being stopped out on normal price action. See “IMC Global.”
- Price resumes trending downward after a pullback 47% of the time. See “IMC Global.”
- Avoid loose-looking flags when trading the high and tight flag pattern. See “Giant Industries.”
- Before placing a trade, look for an appropriate stop location. If you can't find a close one (meaning the potential loss would be too large), skip the trade. See “Giant Industries.”
- Bad trades often go bad quickly. Cut your losses early. See “Giant Industries.”
- Never remove or lower a stop unless it was placed incorrectly. See “Giant Industries.”
- Learn to handle conflicting information. Look back at the historical chart to find similar situations to see how price behaved. See “Lam Research.”
- The completion of a throwback gives an entry signal when price resumes the up move. See “EMC.”
- Trail a stop upward as price rises so you don't give back too much profit. See “EMC.”
- If a chart pattern busts (breaks out in one direction and then reverses), the resulting move can be powerful. If you own the stock, consider selling. See “EMC.”
- A busted double top leads to a powerful move higher. See “Rohm and Haas.”
- Learn not to ignore trading signals. See “Rohm and Haas.”
- Sometimes setting and using a profit target (where you sell) gives better results than a discretionary trade. See “Rohm and Haas.”
- Have a good reason for buying when the stock is predicted to drop. See “JLG Industries.”
- Don't forget to trail the stop upward, making sure the stop is close. Use a volatility stop if a better location is unavailable. See “JLG Industries.”
- In many cases, a pullback gives traders one last opportunity before price resumes moving down. See “Southwest Airlines.”
- Don't get greedy. See “Southwest Airlines.”
- Price trends at 30 to 45 degrees can last for months to years. See “Honeywell.”
- Look at the price trend leading to a chart pattern. Is the chart pattern nearer the end of the trend than the start? If yes, then don't buy. See “Honeywell.”
- If the general market is down more than 50% from a peak in a bear market, start looking for stocks to buy. See “Great Plains Energy.”
- It's better to buy too late than too early in a falling market. Don't be in a hurry to buy. See “Great Plains Energy.”
- When buying a utility stock, look at the payout ratio. See “Great Plains Energy.”