
Chapter 8
Busted Patterns
Making Money by Trading Failure
Traders have known about busted patterns for decades, but I consider them new. You never hear anything about trading a chart pattern that doesn't work as expected, and yet there's money to be made by doing so.
I classify a busted chart pattern as one in which price moves less then 10% after the breakout before changing trend and moving beyond the other side of the chart pattern. This chapter takes a closer look at busted chart patterns.
- A busted pattern occurs when price breaks out in one direction, fails to move more than 10% before reversing and breaking out in the opposite direction.
Busted patterns are a subset of regular patterns, meaning the sample size can be tiny. For example, of the 1,215 broadening tops I used in this study, after sorting them for bull and bear markets, up and down breakouts, I found that just over 173 busted up (upward breakout) and 174 busted down (downward breakouts) in a bull market. In short, expect the performance numbers to change as more samples become available. I noted low sample counts in the tables when necessary. If the sample sizes are not shown, that means I found more than 100.
a chart pattern that reaches the ultimate high or low less than 10% away from the breakout and then reverses direction. The performance measures how far price moves in the new direction (the direction opposite the breakout) before reaching a new ultimate high or low. The new direction must move at least 10% beyond the chart pattern.
The busted pattern performance measures from the top (a busted downward breakout) or bottom (a busted upward breakout) of the chart pattern to the ultimate high or low, respectively. The ultimate high or low is where price reverses and moves at least 20% in the new direction (a trend change).
The performance numbers I list in the following tables are for all busted chart patterns, not just single busts. What does that mean?
Single, Double, and Triple Busts
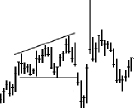
Imagine you shorted the stock in Figure 8.1 at A after the downward breakout from an ascending triangle. Price drops, but not very far, to B and then it reverses. You have a conditional order to protect your backside if price closes above the pattern at C.
The chart pattern busts for the first time when price closes above the top of the chart pattern at C, and stops you out. If the stock continues to climb to D, which is more than 10% above the top of the chart pattern, then the bust counting stops at one.
That is a single bust. Price breaks out (either up or down) and moves less than 10% before reversing. Then it closes outside the top or bottom of the chart pattern in the new direction by moving at least 10%.
For double busts, the same ABC sequence occurs as with single busts, but instead of price moving more than 10% above the top of the chart pattern, it reverses again and closes below the bottom of the pattern, at D. That busts the pattern for the second time. If price continues to E, which is more than 10% below the bottom of the chart pattern, the bust counting stops at two.
A triple bust occurs when the stock double busts the pattern at D, but then fails to drop more than 10% before reversing and closing above the top of the chart pattern, at E. This busts the pattern for the third time. To stop the bust count at three, the stock has to climb at least 10% above the top of the chart pattern, to F.
Additional busts can continue if price does not climb to F and instead makes additional CDE–type moves. Price has to close above the top or below the bottom of the chart pattern and move less than 10% before reversing. The counting ends if price moves more than 10% above or below the chart pattern.

![]() trend change
trend change
when price moves at least 20% in a new direction, a trend change has occurred. I use this to mark the ultimate high and ultimate low, the highest high and lowest low before price changes trend.
All of this applies to any chart pattern shape, and the initial breakout direction can be up or down. The basic idea of busting is to assume a person puts a stop on the opposite side of the chart pattern and then gets stopped out.
- Chart patterns can single, double, or triple bust. A triple bust includes patterns that bust three or more times.
Let's take a brief look at a sample of busted chart patterns, beginning with broadening formations.
Busted Broadening Patterns
Figure 8.2 shows the various busted broadening patterns. I'll be discussing them in clockwise order, starting from the upper left. Few broadening patterns busted in the database I used, so don't rely too heavily on the performance numbers. They are likely to change with additional samples. All of the performance numbers I cite are from many patterns traded perfectly, without commissions, so your results will vary.

Normal or busted broadening patterns are not part of my favorite crowd. While I tolerate them at my parties, I don't go searching them out. I get the feeling they don't work well, but that's not supported by the numbers. Perhaps you feel differently. Play with them and see how well they behave for you.
Broadening Top

Broadening tops with upward breakouts bust when price exits the top but doesn't move far as the adjacent figure shows. Price then curls downward and drops out the bottom of the pattern, confirming the broadening top as a busted one.
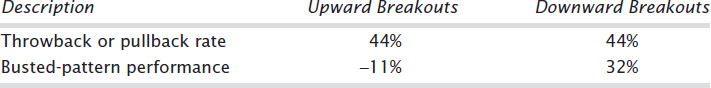
Broadening tops have a throwback and pullback rate of 44% (see Table 8.1). Why should you care about that? If the breakout is upward and price throws back, you might think it's a busted pattern and try to trade it. That could squander several months’ worth of health insurance premiums, and everyone approaching retirement knows what that means.
![]() single, double, and triple busts
single, double, and triple busts
think of busted patterns as triggering conditional orders to stop you out if price closes on the side opposite the breakout. The first time that happens is a single bust. The second and third times, price closes beyond the other side of the chart pattern, trigging the stop again.
Wait for price to close below the lowest valley in the pattern before shorting the stock or selling a long position. If price drops that far, chances are it will continue downward. If the breakout is downward and pulls back, wait for price to soar out the top of the pattern before taking a long position.
I looked at 1,215 broadening tops and found that 626 qualified with upward breakouts in a bull market. Of those, just 173 busted (28%). Downward breakouts had 487 qualifying and 174 busted (36%).
- Broadening tops bust an upward breakout 28% of the time and downward breakouts 36% of the time.
Those that broke out downward and then reversed climbed 32%. Those that broke out upward then plunged dropped an average of 11% as Table 8.1 shows.
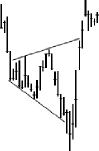
Broadening Wedge, Ascending
The adjacent figure shows a downward breakout from the ascending broadening wedge in which price curls upward and will eventually close above the high in the chart pattern. When that happens, the pattern busts and it's worth taking a long position.
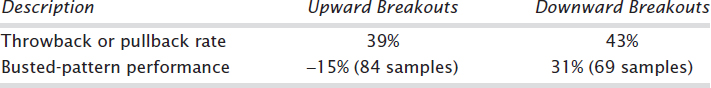
Ascending broadening wedges have a 45% throwback rate and a 59% pullback rate (see Table 8.2). I found only 23 busted patterns with upward breakouts so the 20% drop is likely to change. When a pattern busts, price climbs 31% or sinks 20%, depending on the final trend direction.

Trading an ascending broadening wedge is difficult for upward breakouts because determining when the price has broken out is the tough part.
When the pattern with an upward breakout busts, price tumbles, hitting the upsloping bottom trendline. When price closes below the bottom trendline, that confirms the busted pattern and makes for a clean sell short signal. The bad news is that this pattern has prices that don't decline very far (slightly below average for all chart patterns with downward breakouts).
For downward breakouts from this chart pattern like that shown in Figure 8.2, buy the stock when the price closes above the highest peak in the pattern. Watch for prices to reverse if they approach the top trendline.
- Ascending broadening wedges with upward breakouts can be difficult to trade.
Broadening Formation, Right-Angled and Ascending
Another downward breakout from a broadening pattern confirms the chart pattern as a busted one when price soars out the top. The same applies to upward breakouts when price peaks out the top, reverses, and then tumbles below the horizontal bottom trendline.
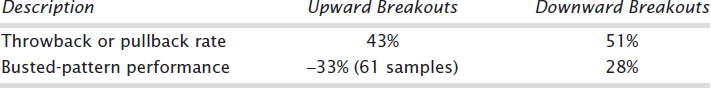
The throwback and pullback rates appear in Table 8.3. Notice that pullbacks hover near 50%, which is about random.
Wait for price to close above the highest peak in the pattern before buying the stock. That way, there is a good chance that price will continue moving up. For upward breakouts, wait for price to close below the bottom trendline before selling a long position or shorting the stock.
- A buy signals when price closes above the highest peak in the chart pattern.
Busted patterns see price climb just 28% after a downward breakout (which busts) followed by an upward move. The 28% gain is small potatoes compared to what other chart patterns do, but I found only 126 samples.
The 33% loss after a busted upward breakout seems unusually large, too. I checked both numbers (28% and 33%), and they appear correct. More data will likely change both numbers.
Broadening Bottom
The adjacent figure shows a broadening bottom, and it's similar to a broadening top, except price enters the pattern from the top, moving down. In this example, price closes below the lower trendline boundary but doesn't move very far before reversing. Price crosses the pattern and pierces the upper trendline then continues higher. The pattern busts because the breakout is downward but fails to continue moving down. The same logic applies to upward breakouts that reverse and continue down, busting the pattern.
- The difference between a broadening bottom and top is the direction price enters the pattern. Bottoms have price entering from the top.
Table 8.4 shows the throwback and pullback rates, which are similar; both occur nearly 40% of the time. Busted patterns, based on few samples despite a database of 615 in the study, show that rises average 31% and declines average 15%. The rises occur after a downward breakout and a trend reversal (busting the pattern). Declines happen after an upward breakout reverses.
As with many of the broadening patterns, take a position in the stock once price crosses the pattern and either closes beyond the prior peak/valley (for aggressive traders), or closes outside the trendline boundary (safest). Price may reverse as it nears the trendline, so expect that.
Broadening Wedge, Descending
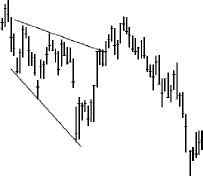
The adjacent figure shows a busted descending broadening wedge. The breakout is upward, but price falters, rounds over, and plunges. When price closes below the pattern's low, it confirms the busted pattern. A similar situation applies when price breaks out downward and reverses, soaring out the top of the wedge, busting it.
- Price breaks out when it closes outside of the wedge trendlines.
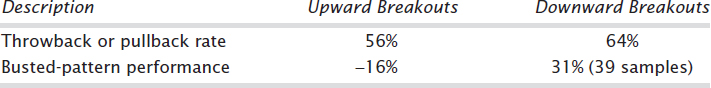
Table 8.5 shows a few performance statistics, but busted patterns with downward breakouts are few. I found just 39 examples. That compares to 120 busted and non-busted descending broadening wedges. Even so, 120 isn't a large sample, so use the numbers with care.
Upward breakouts throwback 56% of the time and downward breakouts retrace 64%. Those patterns that busted soared 31% or dropped 16%, depending on the final trend direction.
For upward breakouts, sell a long holding or short the stock once price drops below the lowest valley. Watch for price to reverse once it nears the lower trendline.
For downward breakouts, buy when price closes above the top trendline. It may stall at the high posted by the start of the pattern, so be prepared, and consider tightening your stops as the target nears.
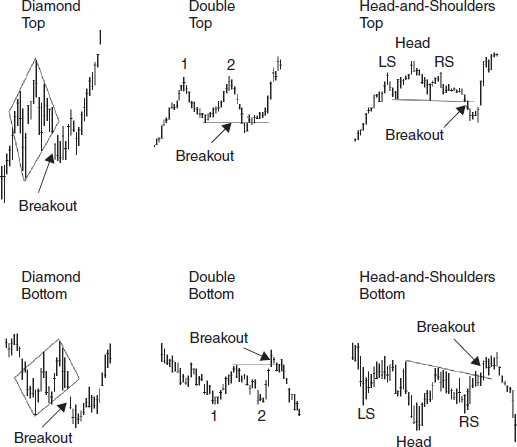
Broadening Formation, Right-Angled and Descending
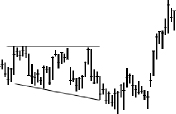
The last pattern of the six is the right-angled and descending broadening formation. In this example, price breaks out downward and then moves up haltingly before soaring in a straight-line attack. When price closes above the top horizontal trendline, it confirms a busted pattern.
For upward breakouts, a short move followed by a downward plunge creates a bust.
After the breakout, prices return to the breakout price just under 50% of the time in a throwback or pullback as Table 8.6 shows. After the retrace, if price happens to continue moving in the same direction, it will bust the pattern and drop 13% or rise 36% on average. Again, the sample size is small despite having 538 patterns in which to choose.
For upward breakouts, price throws back and continues down, eventually dropping below the lowest valley and busting the chart pattern. Price need not pierce the lower trendline before you sell short the stock, but do make sure the industry and general market are also trending lower. If they are not trending downward, then wait for price to close below the lower trendline before shorting the stock.
- Trade in the direction of the industry and market trends for a more successful trade.
With downward breakouts, wait for price to close above the top trendline before buying. The example in Figure 8.2 shows this scenario.
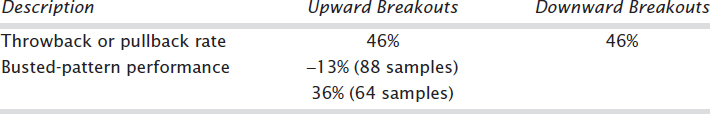
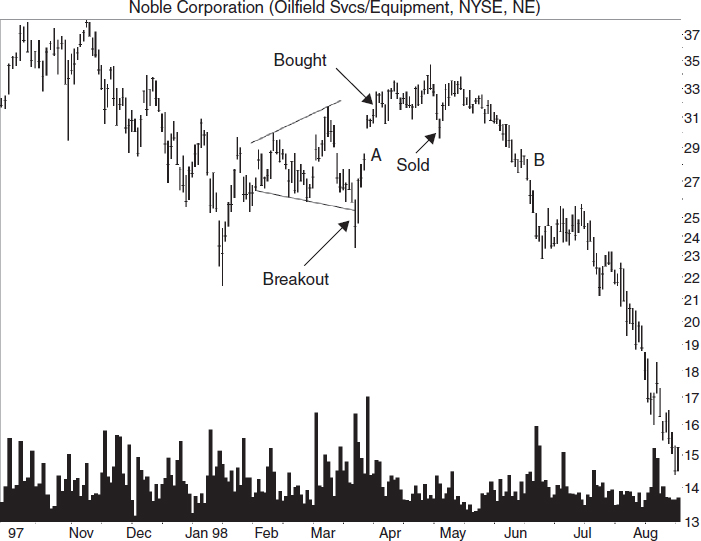
FIGURE 8.3 This busted broadening bottom broke out downward and zoomed higher, only to roll over and die.
Case Study 1
Figure 8.3 shows this case study, a trade in Noble Corporation. When the stock broke out downward, the trader took notice, but wasn't in the mood to short the stock. So he just watched it.
A few days later, the stock vaulted to the top end of the broadening pattern. That's when he bought. He placed a stop using a 38% Fibonacci retrace of the prior up move, which turned out to be near the bottom of the gap (point A). Gaps are common support or resistance areas, and you can see how price paused at B—even with the bottom of the gap.
The stock moved up marginally until late April when it tumbled four points in three days. To the trader, it looked like the start of a quick decline, and he wasn't going to stick around to see what happened. So, he sold the stock before it could hit the stop and saved himself some bucks.
The stock could have dropped to the breakout price at 25 in short order, so selling was the wise choice. If he had held on, look how big the loss would have been.
Diamonds, Doubles, and Head-and-Shoulders
Figure 8.4 shows the next batch of busted patterns, selected alphabetically and arranged with the tops above.
Diamond Top

A diamond top busts when price breaks out in one direction and then returns to make an extended move in the opposite direction. In the diamond top shown in the adjacent figure, the breakout is downward but busts the pattern when price closes above the highest peak.

Throwbacks and pullbacks occur about 55% of the time (see Table 8.7). Wait for price to move above (after a downward breakout) the top of the diamond or below the bottom of the diamond (after an upward breakout) before taking a position. If you trade sooner, you may be buying into a throwback or pullback in which price usually resumes the original breakout direction.
- Wait for the diamond to bust before taking a position. Otherwise, you may be caught in a throwback or pullback.
The busted-pattern performance, based on few samples, is well below what it should be. The numbers are low enough that I would probably look for a different type of busted pattern to trade. (The inset in Figure 6.5 shows a busted diamond top with an upward breakout.)
Double Top
Double tops bust when the breakout is downward, but price doesn't fall far before rising above the top of the chart pattern. I used the Eve & Eve double top as the proxy for all non-busted double tops and lumped all double top types (all combinations of Adam and Eve) together to find enough busted samples.
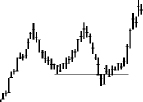
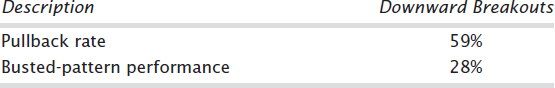
Because a double top has only one breakout direction, I removed the upward breakout column. As Table 8.8 shows, pullbacks occur 59% of the time. The 28% performance is the rise from busted double tops. Those break out downward, quickly reverse, and soar out the top. Remember, the number is based on perfect trades without any fees.
Trading a busted double top is simple. If the pattern confirms as a true double top, meaning that price has closed below the valley between the two tops, then wait for price to rise above the closest peak.
Try drawing a trendline connecting the two peaks in the double top. If the trendline slopes downward, then buy when price closes above it. Ignore upsloping trendlines; just use a close above the closest peak in that situation.
- For an early entry to a busted double top, draw a line connecting the two peaks. If it slopes downward, then buy when price closes above the line.
If a double top does not confirm (the stock rises before closing below the valley floor), then you can also trade that pattern. The double top should qualify in all other respects (peak separation in both time and price, distance from peak to valley, and so on). Buy the stock when price rises above the nearest peak or above a downsloping trendline connecting the two peaks.
- Unconfirmed double tops also bust and can make strong moves upward. Trade a busted unconfirmed double top as if it confirmed.
Head-and-Shoulders Top

A busted head-and-shoulders top looks like a pattern with an aggressive pullback except the pullback has price continuing up. It moves above the top of the chart pattern, confirming the bust.
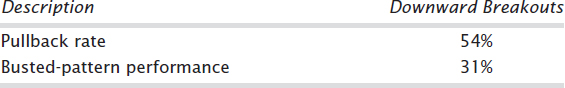
A head and shoulders top breaks out downward and pulls back 54% of the time as Table 8.9 shows. If price continues moving in the same direction (upward), the average rise is 31% before price changes trend. That is a nice return for a busted pattern.
There are two ways to trade a head-and-shoulders top. One is to select patterns that confirm (price closes below the neckline or right valley low) and the other is to choose unconfirmed patterns. I show a confirmed head-and-shoulders top in Figure 8.4.
Place a trade once price closes above the right shoulder peak for aggressive traders. Price may stall as it approaches the price level of the top of the head, so watch for that. You can also draw a downsloping trendline connecting the head and right shoulder peaks. Buy when price closes above the trendline. For investors, wait for price to close above the value of the head and then buy.
- Aggressive traders may want to buy when price closes above the right shoulder peak, or use a down-sloping trendline connecting the head and right shoulder peaks and buy when the stock closes above the line.
Diamond Bottom
I found almost 453 diamond bottoms but only 73 in a bull market that busted. The adjacent figure shows an example. Price breaks out downward but quickly recovers and will eventually rise above the chart pattern's high.
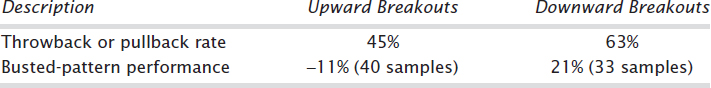
As shown in Table 8.10, throwbacks occur 45% of the time, but pullbacks happen more frequently: 63% of the time. After the pattern busts, price climbs an average of 21% or drops an average of 11%. Samples are few, as I mentioned, so don't rely on the numbers too much.
Trade diamond bottoms as you do the top variety. Wait for price to climb above the highest peak in the pattern or below the lowest valley before taking a position. Entering earlier increases your risk of a failed trade.
- Wait for price to climb above the top or below the bottom of a diamond before trading.
Double Bottom

A busted double bottom reminds me of a right-angled and ascending broadening pattern, one with a flat bottom and upsloping top trendline. Price breaks out upward before tumbling and closing below the twin bottoms, confirming a busted pattern.
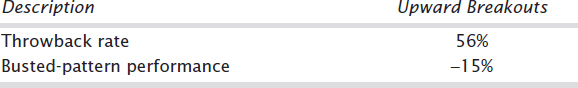
Double bottoms break out in one direction, so Table 8.11 only shows the results for upward breakouts. Throwbacks happen 56% of the time, so don't be fooled into taking a position in a busted pattern until price closes below the lowest valley in the pattern.
Busted patterns sees price drop an average of 15% below the twin bottoms. Like a double top, there are two ways to play a busted double bottom: You can buy an unconfirmed pattern or wait for confirmation. Figure 8.4 shows the confirmed variety.
The safest way to trade this pattern is to wait for price to close below the lowest valley in the double bottom. If you can draw an upsloping trendline below the two valleys, then a close below this line would also signal a trade. If you do short early using the trendline approach, price may stall at the twin bottoms, forming a triple bottom, so be prepared for that.
- Wait for price to close below the lowest bottom in the double bottom or, for aggressive traders, look for a busted double bottom that has the right bottom above the left. A close below the trendline connecting those two bottoms may get you into the trade earlier.
Head-and-Shoulders Bottom
A head-and-shoulders bottom busts when the breakout is upward and price tumbles. That's the situation Figure 8.4 shows.
The throwback rate from a head-and-shoulders bottom is 57% (see Table 8.12). Busted patterns see price decline 16% on average.
Trading a head-and-shoulders bottom is similar to other busted patterns. After the breakout, price will curl downward. When it closes below the right shoulder low, sell a long position or short a new one.
Less aggressive traders will want to wait for price to decline below the head before trading. Otherwise, expect price to pause or reverse either at the price level of the left shoulder valley or the head.
Another early entry is to use a trendline connecting the head and right shoulder valley. When price closes below this trendline, short the stock or sell a long position. Again, watch for the decline to stall or reverse when it drops to the price level of the head.
With a head-and-shoulders bottom, you need not wait for the pattern to confirm (price to close above the neckline) before trading it. If the three valleys conform to a head-and-shoulders bottom but price drops after forming the right shoulder instead of confirming the head-and-shoulders bottom, then trade the stock according to the preceding guidelines.
- Chart patterns are consolidation or congestion areas where price pauses. A busted breakout from this area (and upward breakout followed by an extended reversal or a downward breakout followed by an extended rise) signals a trade.
Case Study 2
Sometimes you don't see a chart pattern soon enough to trade it. My experience suggests you should ignore a trade if you can't get in at a good price or if the price is running away from you.
- If you can't buy a stock within 5% of the optimum entry price, ignore the trade.
When I grab a stock quote, if the stock is down, I won't buy it. Why not? Because price is falling. In a few minutes, it will be cheaper.
I won't buy a stock if it is up too much intraday. Why not? Because I know that as soon as I buy, price will turn down, and I'll be stopped out for a loss. The comfort zone lies somewhere in between those two ranges. Like Goldilocks and the Three Bears, the stock has to be moving up but not too quickly.
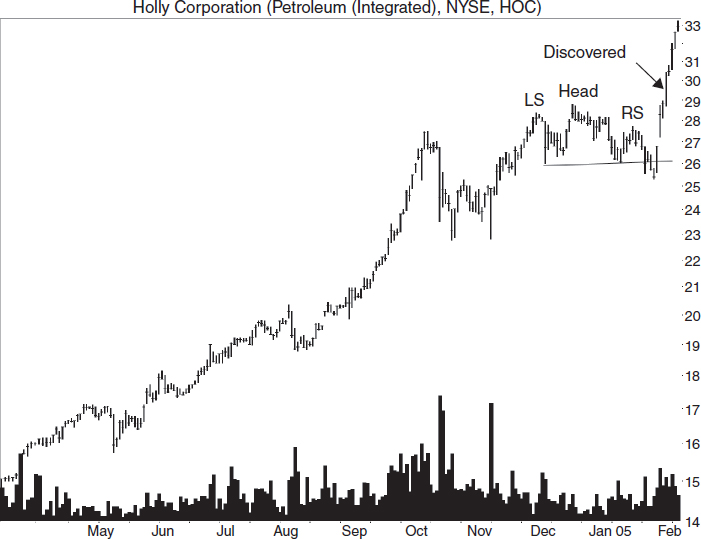
Figure 8.5 is a case in point. The chart shows a head-and-shoulders top that confirmed when the stock closed below the horizontal neckline. Then price climbed, rising above the head and busting the pattern.
Should a trader buy the stock? My advice would be to wait for a throwback—a retrace to the price of the head.
In October 2005, the stock peaked at almost 65 (presplit) before suffering its first significant drop (over 20%).
Did a trader miss a promising opportunity? You bet. Many stocks don't form straight-line runs like this one, so I think it pays to be cautious and pass up a late-entry trade.
If a trader had spotted the pattern sooner, he should have put a buy stop at the head 28.78 (a penny above the peak) or drawn a downsloping trendline along the head and right shoulder peaks. A close above the trendline at 27.28 would have gotten him in sooner, but was more risky.

Pullbacks often rise to meet or slightly exceed the height of the right shoulder peak. If he had bought in at 27.28, he could have pulled $25 per share out of the market (using a close below an upsloping trendline as an exit signal at 52, which is well below the high of 65).
More Busted Patterns
Figure 8.6 shows the last spread of busted patterns.
Rectangles

Rectangles can break out in any direction, but when price reverses and crosses the pattern to exit the opposite side, it confirms a busted pattern. That's the time to trade it. Figure 8.6 shows an example of this scenario.
I used both rectangle tops and bottoms to get enough samples, and Table 8.13 shows the numbers. Rectangles throw back 61% of the time and pull back 55% of the time. If price continues moving in the new direction, the rectangle busts and price rises an average of 34% or drops an average of 10%.
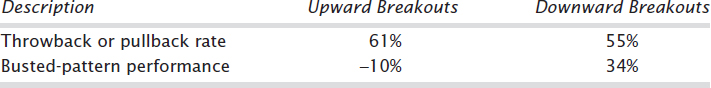
- Trade a busted rectangle when price closes outside the side opposite the breakout.
The above figure shows a downward breakout from a rectangle top. Price pulls back and shoots out the top of the pattern. Only when it crosses to the other side and closes outside the trendline boundary should a trader consider the pattern busted and jump on the new trend.
After a downward breakout like that shown, if price returns to the rectangle pattern, then look for a partial decline. If one occurs inside the rectangle then that would be a buy signal with an assumed upward breakout.
- Don't forget to look for partial rises and decline in rectangles.
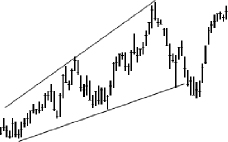
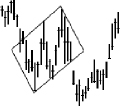
Ascending Triangle
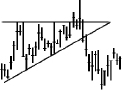
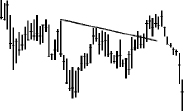
Ascending triangles can break out in either direction. The adjacent figure shows an upward breakout with price throwing back and plunging through the bottom trendline, confirming a busted pattern.
- Triangles can break out in either direction. If price reverses and closes outside the trendline boundary, it busts the pattern.
Upward breakouts throw back 61% of the time as shown in Table 8.14, and if price keeps tumbling, it busts the pattern and declines an average of 11%. Downward breakouts pull back 56% of the time, and busted patterns have price rising 26%. Again, these numbers may be averages, but they are from perfect trades without fees subtracted.
Figure 8.6 shows an ascending triangle with a busted upward breakout. For aggressive traders, short the stock or sell a long holding when price closes below the upsloping trendline. Watch for price to stall as it dips to the lowest valley in the pattern. For conservative traders, enter a new trade when price declines below the lowest valley in the busted pattern.
For downward breakouts that bust the triangle, take a position when price closes above the top trendline.
Chapter 6, Figure 6.14 shows an ascending triangle that qualifies as a busted pattern because price drops 8%, just short of the 10% benchmark. Figure 7.1 in Chapter 7 shows another example of a busted ascending triangle. This one is treacherous because price breaks out upward and then moves down for just four days before gapping back into the triangle.
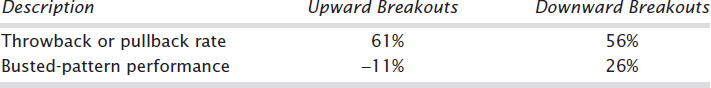
Descending Triangle
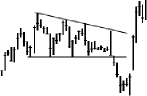
The adjacent figure shows a descending triangle with a downward breakout. When price closes above the downsloping trendline on the top, it busts the pattern.
Throwbacks and pullbacks occur at the rates shown in Table 8.15. The performance of busted patterns is also listed.
For aggressive traders in a busted downward breakout, take a position once price pierces or closes above the downsloping trendline. For conservative traders, wait for price to rise above the highest high in the pattern. That way, price is likely to continue moving up.
- For conservative traders, buy a busted downward breakout only when price closes above the top of the descending triangle.
Be sure to check the market averages and other stocks in the same industry. If they are trending in the same direction, that improves your chances of a profitable trade.
An example of a busted descending triangle appears in Chapter 5, Figure 5.22. Price dips its toe below the bottom of the chart pattern before yanking it out and moving up to bust out the top. Price throws back within a month and then resumes the march upward.
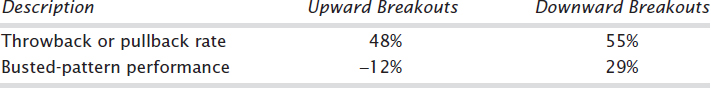
Symmetrical Triangle

Symmetrical triangles are almost as common as aphids on my cucumber plants in summer, and the lower left of Figure 8.6 shows an example of a busted one (triangle, not aphids). If price breaks out in one direction and shoots out the other side, then it's a busted pattern. It's actually more complicated than that, but I'll discuss that later when I discuss multiple busts.
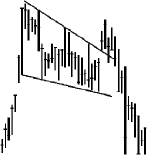
Table 8.16 shows the results for symmetrical triangles. Throwbacks complete 57% of the time and pullbacks 58% of the time. Price that breaks out downward then reverses and punches through upward soars an average of 28%. Upward breakouts that bust show declines of 10%.
Once a symmetrical triangle breaks out and price reverses, crossing both trendlines, trade in the direction of the new trend. Just be cautious. Symmetricals tend to double bust more than any other chart pattern that I've studied. As I mentioned, I'll discuss this later.
- Symmetrical triangles have multiple busts more than any other chart pattern studied.
Figure 6.17 in Chapter 6 shows two busted symmetrical triangles, and Figure 6.14 shows a busted symmetrical in May.
Take a position once price closes outside the trendlines for the second time. If you are concerned about a reversal, especially if the industry or market is trending opposite your stock, then wait for price to move above the highest peak or below the lowest valley before trading. Price often stalls or reverses at prior peaks and valleys.

Falling Wedge
I'm not keen on wedges, regardless of whether they are rising or falling. Other traders seek them out. I think the profit potential is meager compared to other patterns because price will often rise to the top of the pattern and then reverse. That doesn't leave much room for profit unless you are a talented swing trader aiming for those types of moves.
Figure 8.6 shows a busted falling wedge, one with an upward breakout but price soon plunges.
Table 8.17 shows the performance numbers. A throwback happens half the time, and pullbacks occur almost two-thirds of the time. Downward breakouts bust, then price rises a sumptuous 33%. Upward breakouts drop and tumble 13%.
Trade falling wedges the way you would most other chart patterns. When price breaks out in one direction, reverses and pierces the opposite trendline moving in the new direction, then take a position in the stock. If price is moving upward, watch for it to stall near the top of the pattern—a common resistance zone.
For example, Figure 8.6 shows a falling wedge with an upward breakout. Sell a long holding or short the stock when price closes below the lower trendline.
- If price rises to the top of the wedge and then reverses, the move doesn't leave much profit potential and your timing must be exquisite.

Rising Wedge

The rising wedge shown in the lower right of Figure 8.6 has a downward breakout in which price curls around and then moves above the highest peak in the chart pattern, confirming a busted pattern.
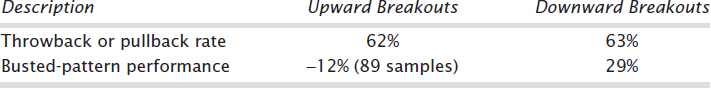
Table 8.18 shows that 62% of the rising wedges throw back, and 63% pull back. Busted patterns show price rising an average of 29% or dropping 12%, depending on the breakout direction.
Figure 8.6 shows a rising wedge with a downward breakout. In such a situation, buy the stock once price closes above the top trendline. For upward breakouts, a close below the lower trendline is the trading signal. Expect support when price nears the lowest valley in the pattern.
- Always look for overhead resistance (upward moves) and underlying support (downward moves) before trading. For wedges, the top or bottom are areas showing support or resistance.
Case Study 3
Figure 8.7 shows a trade I made on the weekly scale, one that got away from me. I bought shares at the market for 65.33. The company projected 20% annual growth through 2005, and I was foolish enough to believe them. The problem was their projections had nothing to do with the stock's price.
I bought the upward breakout from a symmetrical triangle. I expected the price to stall at overhead resistance of 67 and again at 74 with support at 55 and 59–60. The 67 call was a good one, even though price coasted to 69 during the week I bought. Below the symmetrical triangle, the stock dropped to a low of 53.28, with solid support showing in the 55 to 57 range, just as I predicted. The 59–60 support area only slowed the stock a bit.
I wanted to hold the stock for the long term because it was trading near the yearly high. A rise to 74 would only be a gain of 13%, and I wanted more, which would take longer.
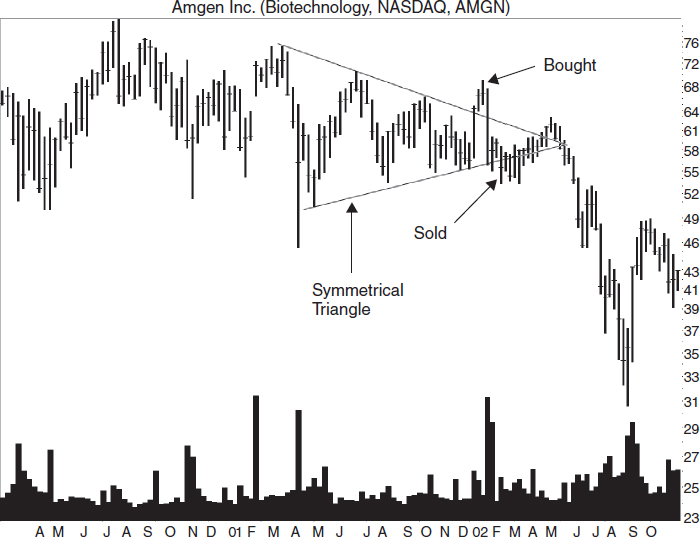
FIGURE 8.7 An upward breakout from a symmetrical triangle busts when price drops to the other side of the triangle and closes outside the lower trendline. Shown on the weekly scale.
Ten days after purchasing the stock, the company announced that it was buying Immunex. That sent shares tumbling, causing a throwback and price to close below the lower trendline a few weeks later. A few days into the New Year, the stock pierced the 55 support zone.
Although I wanted to hold it for the long term, I didn't want a massive loss on my hands. I sold and received a fill at 54.20 for a loss of 17%. That's about double what I like to see.
I expected the stock to pull back to the triangle bottom then continue its decline. Instead, the stock pulled back and continued rising, piercing the top trendline before heading back down again. The stock plunged to 30.57 in July, less than half what I paid for it.
Did I make a mistake selling? No, but I could have timed the entry better (by placing a buy order at the triangle trendline). That would have lowered this loss.
Look at Figure 8.7 again. Regardless of when I bought the stock, the upward breakout or the downward one, I would have likely taken a loss. A double bust like this happens occasionally, so do not be surprised when it happens to you. Keep trading those busted patterns for the big bucks.
Busted Trading Tips
After researching and trading busted chart patterns, I discovered a few tips that might help you extract more profit from them.
Refer to Figure 8.8 for the various scenarios concerning trends and busted patterns. This is common sense, really, but it is worth mentioning anyway.
Downtrend
Scenario A. If the stock is in a long-term downtrend (price trends lower for more than six months), and if a chart pattern busts a downward breakout (downward breakout followed by a quick reversal), the move could be a powerful one because the downtrend may be near the end, powering the stock upward as the new trend unfolds.
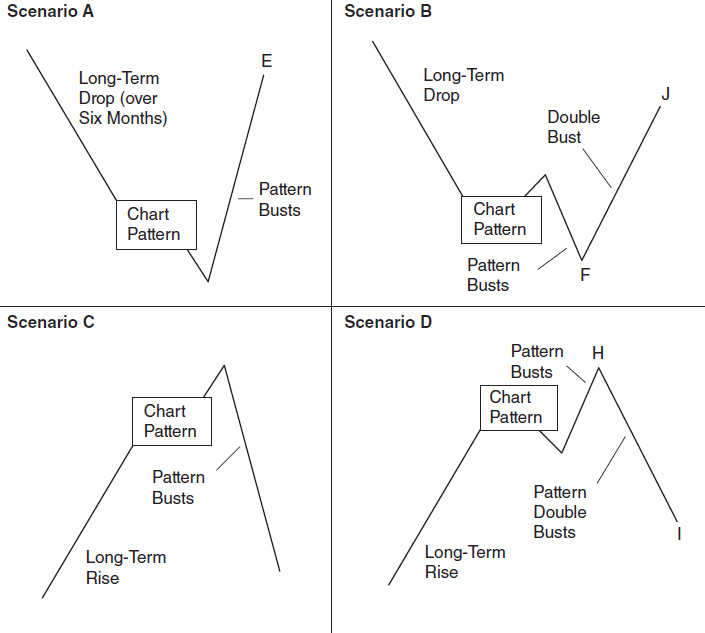
- A powerful up move may come after a long-term downtrend and busted downward breakout.
If the downtrend is short, less than six months, a bust could be fake (too near the start of a powerful down move).
- Be suspicious of short-term downtrends and busted patterns.
Scenario B. The stock trends downward over the long term, but this time it breaks out upward. A bust follows when price reverses. Don't expect a large decline to F because the long downtrend is over. Instead, the stock could double bust with price closing above the top of the chart pattern and soaring to J.
- Trade cautiously busted patterns with upward breakouts after a long-term downtrend.
Uptrend
Scenario C and D are the inverse of the prior two.
In Scenario C, suppose the uptrend is longer than six months. Then a reversal chart pattern appears, which busts. Expect a good move down, retracing a good portion of the up move. I show that decline as a plunge to G.
- After a long-term rise, the upward breakout from a chart pattern may bust, leading to a significant reversal of the uptrend.
- If the uptrend is short term, and the pattern busts, expect a double busted pattern.
Scenario D. The stock rises over the long term and then forms a chart pattern. This breaks out downward, but the drop doesn't last long. Instead, price reverses and soars out the top of the chart pattern, busting it.
However, since the uptrend is tired, the stock reverses again, falls from H, and double busts the chart pattern. An extended decline unfolds, taking price down to I.
- A busted chart pattern with a downward breakout after a long-term rise may double bust.
- If the rise is short term, then the chart pattern may triple bust when it struggles to find a new trend.
Busted: How Often?
How often do chart patterns bust? Table 8.19 shows the answer for the more popular chart patterns.
I consider the numbers alarming. Why? Because they show how often patterns fail to move at least 10% in the direction of the breakout. For example, broadening bottoms with downward breakouts bust 26% of the time. That means they break out downward and drop less than 10% before rising and shooting out the top of the chart pattern (busting it).
The triangles (ascending, descending, and symmetrical) with downward breakouts all bust at least 40% of the time. That's huge.
On the other end of the scale, head-and-shoulders bottoms with upward breakouts bust the least amount of time. One reason for that may be because of their height. Tall patterns will bust less often because of the definition of price having to close above the top or below the bottom of the chart pattern before it busts.
That's a lot trying to jump over a brick wall. Short walls are easier to scale than tall ones.
Chart patterns can single, double, triple bust (and bust more than that). If you trade a chart pattern that only single busts, how far does price move? Table 8.20 provides the answer for popular chart patterns.
| Chart Pattern | Percentage Busting |
| Broadening top, downward breakout | 24% |
| Broadening top, upward breakout | 15% |
| Double bottoms, upward breakout | 16% |
| Double top, downward breakout | 33% |
| Head-and-shoulders bottom, upward breakout | 14% |
| Head-and-shoulders top, downward breakout | 28% |
| Triangle, ascending, downward breakout | 40% |
| Triangle, ascending, upward breakout | 26% |
| Triangle, descending, downward breakout | 40% |
| Triangle, descending, upward breakout | 22% |
| Triangle, symmetrical, downward breakout | 42% |
| Triangle, symmetrical, upward breakout | 27% |
Now that's more like it! The best performance comes from rectangles with downward breakouts. They bust, and price shoots up through the pattern, rising an average of 61% above the top of the rectangle. That's an average of 122 rectangles (both tops and bottoms), but the median rise is still a respectable 30%. That means half of all rectangles with single busts rise more than 30% and half rise less.
This chapter tells the story of busted chart patterns. When chart patterns don't work as expected, there is still money to be made by trading the busted direction. If you are lucky, it will single bust, and price will make an extended run.
How often do chart patterns single bust only? The answer varies from pattern to pattern. Let me give you the numbers for rectangles. Of the busted rectangles with downward breakouts, single busts happen 66% of the time, double busts happen 13%, and more than double busts happen 21% of the time.
What We Learned
Here is a list of the major lessons discussed in this chapter.
- A busted pattern occurs when price breaks out in one direction, fails to move more than 10% before reversing and breaking out in the opposite direction. See the introduction.
- Chart patterns can single, double, or triple bust. A triple bust includes patterns that bust three or more times. See “Single, Double, and Triple Busts.”
- Broadening tops bust an upward breakout 28% of the time and downward breakouts 36% of the time. See “Broadening Top.”
- Ascending broadening wedges with upward breakouts can be difficult to trade. See “Broadening Wedge, Ascending.”
- A buy signals when price closes above the highest peak in the chart pattern. See “Broadening Formation, Right-Angled and Ascending.”
- The difference between a broadening bottom and top is the direction price enters the pattern. Bottoms have price entering from the top. See “Broadening Bottom.”
- Price breaks out when it closes outside of the wedge trendlines. See “Broadening Wedge, Descending.”
- Trade in the direction of the industry and market trends for a more successful trade. See “Broadening Formation, Right-Angled and Descending.”
- Wait for the diamond to bust before taking a position. Otherwise, you may be caught in a throwback or pullback. See “Diamond Top.”
- For an early entry to a busted double top, draw a line connecting the two peaks. If it slopes downward, then buy when price closes above the line. See “Double Top.”
- Unconfirmed double tops also bust and can make strong moves upward. Trade a busted unconfirmed double top as if it confirmed. See “Double Top.”
- Aggressive traders may want to buy when price closes above the right shoulder peak, or use a down-sloping trendline connecting the head and right shoulder peaks and buy when the stock closes above the line. See “Head-and-Shoulders Top.”
- Wait for price to climb above the top or below the bottom of a diamond before trading. See “Diamond Bottom.”
- Wait for price to close below the lowest bottom in the double bottom or, for aggressive traders, look for a busted double bottom that has the right bottom above the left. A close below the trendline connecting those two bottoms may get you into the trade earlier. See “Double Bottom.”
- Chart patterns are consolidation or congestions areas where price pauses. A busted breakout from this area (and upward breakout followed by an extended reversal or a downward breakout followed by an extended rise) signals a trade. See “Head-and-Shoulders Bottom.”
- If you can't buy a stock within 5% of the optimum entry price, ignore the trade. See “Case Study 2.”
- Trade a busted rectangle when price closes outside the side opposite the breakout. See “Rectangles.”
- Don't forget to look for partial rises and decline in rectangles. See “Rectangles.”
- Triangles can break out in either direction. If price reverses and closes outside the trendline boundary, it busts the pattern. See “Ascending Triangle.”
- For conservative traders, buy a busted downward breakout only when price closes above the top of the descending triangle. See “Descending Triangle.”
- Symmetrical triangles have multiple busts more than any other chart pattern studied. See “Symmetrical Triangle.”
- If price rises to the top of the wedge and then reverses, the move doesn't leave much profit potential, and your timing must be exquisite. See “Falling Wedge.”
- Always look for overhead resistance (upward moves) and underlying support (downward moves) before trading. For wedges, the top or bottom are areas showing support or resistance. See “Rising Wedge.”
- A powerful up move may come after a long-term downtrend and busted downward breakout. See “Downtrend.”
- Be suspicious of short-term downtrends and busted patterns. See “Downtrend.”
- Trade cautiously busted patterns with upward breakouts after a long-term downtrend. See “Downtrend.”
- After a long-term rise, the upward breakout from a chart pattern may bust, leading to a significant reversal of the uptrend. See “Uptrend.”
- If the uptrend is short term and the pattern busts, expect a double busted pattern. See “Uptrend.”
- A busted chart pattern with a downward breakout after a long-term rise may double bust. See “Uptrend.”
- If the rise is short term, then the chart pattern may triple bust when it struggles to find a new trend. See “Uptrend.”
- See “Busted: How Often?”
- Table 8.19 shows how often several chart patterns bust.
- Table 8.20 provides the move after a single bust for popular chart patterns.