
Graphitic Nanofibers—The Path to Manufacturing
Abstract
The important factors to consider in the lead up to the manufacture of graphitic nanofibers, starting with a detailed description of the role of catalysts in this process are discussed. The various materials that can be used as a catalyst are mentioned, with the pros and cons of each highlighted. Generally accepted reaction mechanisms with intermediate building blocks and parameters affecting growth rate are outlined within the context of manufacturing nanofibers. The discussion gives a roadmap for process design to produce a consistent product, quality thought to devise ways for control and optimization in an effort to obtain the most reliable products.
Keywords
Nanofiber catalysts; nanofiber reaction mechanisms; nanofiber growth rates; nanofibers; nanofiber manufacturing; nanofiber intermediate products
3.1 Catalysts
The primary method for synthesis of carbonaceous nanomaterials that I will discuss in this book is what is known as Chemical Vapor Deposition (CVD). In the CVD process, (mostly) hydrocarbon gases are cracked to deposit elemental carbon on the catalytic surface. The catalysts can be in the form of immobile surfaces, such as wafers or patterned parts. They can also be in the form of granular particles. The granular particles are either in a packed bed configuration or in a fluidized bed. The fluidized bed configuration is the most practical configuration for a variety of reasons explained a bit later. Catalysts play a relatively important role in the manufacturing process. Many catalysts can deliver graphitic nanofibers (GN) with very high purity. In my personal experience, catalysts formulated and tested on a laboratory scale are typically not commercially viable to synthesize via the procedures outlined by the formulators. Process times, types of solvents, salts, temperatures and most importantly, ingredients with environmental concerns have to be modified to be feasible for large scale manufacturing. For our first licensed catalyst, we shopped around the world with catalyst manufacturers for contract manufacturing, but were told the procedures were unrealistic to replicate on an industrial scale. Industrial scale catalyst manufacturers start formulating with what is real and viable right from the start. Therefore, it is best to work with a manufacturer to formulate a commercial catalyst for the type of nanomaterial you intend to synthesize. Beware of extraordinary claims about the uniqueness of catalyst formulations. Most catalyst formulations are variations of previous work done by other scientists. More often than not, we can overcome the minor disadvantages of one catalyst over another by intelligent design of reactors, as well as being realistic in setting our commercial goals. Things don’t have to be perfect to be useful and profitable. In our quest for mass production of GN, we discovered this fact at great expense.
From this point on, I will discuss the rest of the topics with a specific focus on GN. The intent of the earlier discussions was to bring the key characteristics of other materials into focus. These are factors that show us the similarities between GN and the other nanomaterials, giving us the ability to extend the results and data of the published work (mostly with graphene in their titles) to GN.
Our team never looked at any catalyst that required gases other then methane or syngas (CO+H2) for synthesizing GN. Our primary reasoning, as common sense would dictate, was the cost of production of GN. Methane, a component of natural gas, is available at a reasonable cost, but more importantly, it is a component of biogas sources such as landfill gas (LFG) or anaerobic digester gas (generated from oxygen-deprived digestion of carbohydrates, similar to the way our digestive system works.). The latter are derived from waste and available at a fraction of the cost of natural gas, not to mention they are immune to the energy price fluctuations, and maybe, just maybe, make you feel good about preserving earths resources. Similarly syngas can be produced by gasification of waste. Waste to energy is a rapidly growing industry worldwide. However, biogas, LFG and syngas need processing before use and result in end product being only slightly less expensive than natural gas given today’s natural gas prices. We were fortunate to have had experience in gas purification and water purification to adopt this feed source. NG works nearly as well in terms of costs.
There are many compositions of catalysts that are in the public domain or formulated by scientists that are willing to share their knowledge, and help you guide your catalyst manufacturers at reasonable terms. These formulations can be used as a starting point to evolve into the product you want. Believe me you will have enough on your plate than having to worry about making catalysts with consistent properties. For our second round, we left it to the professionals. As a start, some cross-pollination with other industries that may use similar catalysts help you understand the basic mechanisms. Transition metals are the backbone of the catalysis field. They have been used extensively to produce soot-free products. Surely in that evolutionary process, the formulators must have learnt what “not to do” to avoid growth of carbonaceous fibers. We would simply start by doing the “not to do” and work toward an efficient catalyst.
3.1.1 Catalyst formulations
Carbon deposition on catalysts is very easy to do. Fine-tuning the chemistry and operating conditions for these deposits to take the shape and form is the task. Transition metals can catalyze the cracking reaction. Nickel, iron, copper, and zinc are the more feasible catalysts with good activities. Higher performance can sometimes be achieved by precious and other exotic metals, but by and large, precious metals are used only in reactions that are poorly catalyzed by the commodity materials. A variety of promoters may be added to the formulations. Promoters are surface additives that are not catalysts but help the selectivity or reactivity of reactions. A promoter can stabilize a valence state or a stoichiometry of reactants. A wide range of promoters are used in industry. The selection is based on the electronic structures of the reactants and catalyst. Potassium, titanium, molybdenum, copper, most lanthanide series, and their chloride salts are some that come to mind. There is a vast amount of information out there that can help one understand the functions of the different components, synthesis conditions, and operating conditions in the final process. Nevertheless, large-scale manufacturing remains an art more than science. Many formulations work well when you are making 1 g, but outside the laboratory, it is a whole different story. I list below some of the catalysts described in literature with regards to synthesizing GN. Reading between the lines, one can pretty much arrive at an intelligent starting point.
Ni-Mg catalysts have been widely used in reforming of light hydrocarbons and especially in the reaction of methane reforming with CO2 to produce syngas (CO+H2). Solid solution synthesis of NiO-MgO precursors for Ni-Mg catalysts has been reported [128]. Mainly they are nitrate salts oxidized to metal oxides or a slurry of metal oxides dried to produce the mixed oxides. Variations of these catalysts can be looked at, and have been utilized by many in the nanomaterials field, albeit sometimes reported as inventions.
Cu-Ni-Mg catalysts were used by Echegoyen et al [129] for methane decomposition and GN of 30 nM diameter were produced. The yields are mentioned in terms of hydrogen production (80 vol%). Ni-Cu-Mg catalysts lead to the formation of a high-order deposited carbon structurally close to perfect graphite, while catalysts in the absence of Cu lead to the formation of a low-ordered deposited carbon. A combination of the two above with only slight modifications, was licensed to us as an “invention”.
Hulikova-Jurcakove et al. [130] outline tests for gravimetric capacitance of synthesized GN from methane and acetylene. They discuss the basic ingredients of the catalyst they used. When using methane as a feedstock, they produced GN with much higher graphitic nature, implying less surface defects. However the charge/discharge change in capacitance was higher with GN produced from acetylene that had higher surface defects on the graphene plane. Nevertheless the data from the methane-synthesized GN was far superior to the other carbon the two materials were compared with. To me, this is a perfect example of the “good enough” principle that guides the commercial world.
Ermakova et al. [131] described work done with Nickel including textural promoters such as oxides of Si, Al, Mg, Ti, and Zr. They reported high yields of nanofibers (>350 g/g of nickel) specifically with SiO2 but medium yields with MgO and ZrO2 textural promoters. The effect of various catalyst preparation steps is discussed in detail. Slight extrapolation of operating conditions such as increase in temperature to 650–700°C shows highly graphitic GN can be produced using some of the parameters discussed in their publication.
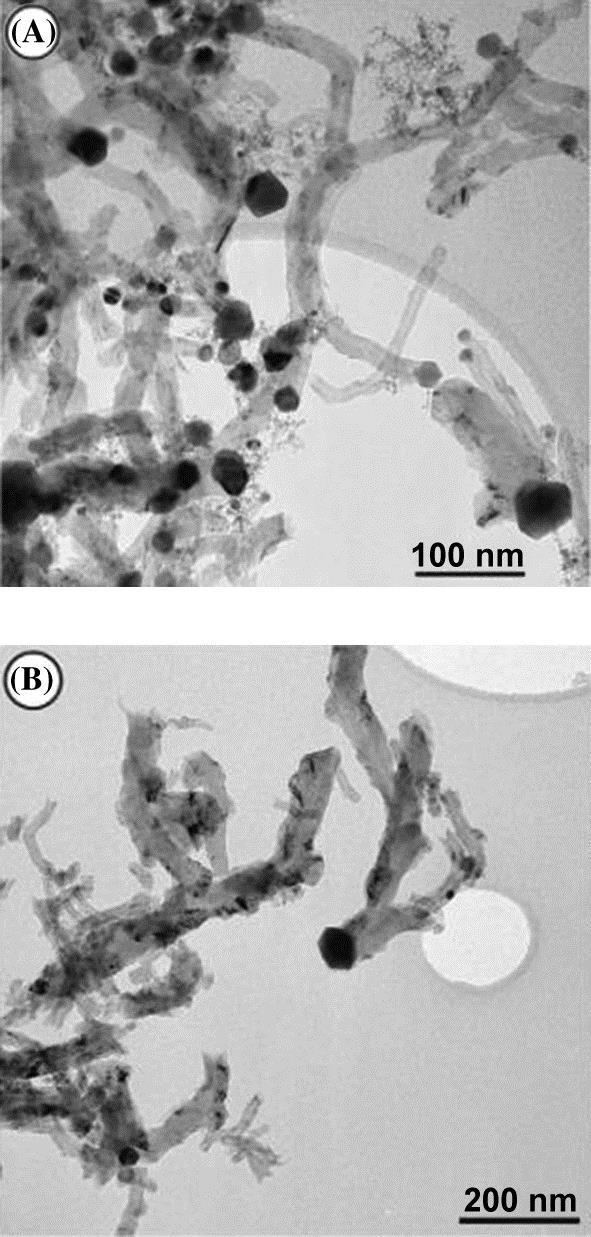
Reshetenko et al. [132] discuss the use of Cu-Ni-Al2O3 catalysts used for GN production. Two types of catalytic particles and correspondingly two types of GN were observed for the formulation 82Ni-8Cu-Al2O3 sample:
1. Pear-shaped particles 40–50 nm in size. These particles are reported by the authors to be typical for nickel–aluminum catalysts. The structure and morphology of GN shows that one carbon filament grows from one catalytic particle, and the graphite planes in filaments are arranged as coaxial cones. However the angle between graphite planes and the filament axis varied from 45° to 75°. This variation is not significant in the applications I will outline. The average diameter of the filament and the catalyst particle were identical (40–50 nm) as shown in Fig. 3.1A. The portion of the given particles is about 65% of the total range of the produced particle sizes.
2. Quasioctahedral particles 70–100 nm in size. In this case several filaments grew from one particle as shown in Fig. 3.1B. The diameter of the GN was less than the size of the “mother” particle. The graphene layers in the filaments are stacked perpendicular to their axis, what we term as platelet-type GN.
The authors report a yield of 525 gGN/gcatalyst under a well-controlled environment with a maximum conversion of 40% and a 90 L/h-gcatalyst. All our economics and certainly our experience have been worked on ~50% of this yield and ~75% of the conversion rate. The replication of this data, even with our discount factors would be good enough for an economic justification, since the feed gas used was methane. The authors have tabulated further details about the catalyst compositions and the corresponding conversion rates and yields as shown in Table 3.1.
Table 3.1
Catalytic properties and yields of GN from coprecipitated Ni-Cu-Al2O3 catalysts
| Sample | 625°C | 650°C | 675°C | ||||||
| x (%) | G (g/gcatalyst) | t (h) | x(%) | G (g/gcatalyst) | t (h) | x (%) | G (g/gcatalyst) | t (h) | |
| 90Ni-Al2O3 | 31 | 22.4 | 2.0 | 34 | 11.2 | 2.5 | 7.0 | 8.0 | 5.0 |
| 82Ni-8Cu-Al2O3 | 22 | 515 | 61.5 | 29 | 169 | 15.5 | 35 | 150 | 9 |
| 75Ni-15Cu-Al2O3 | 18 | 525 | 54 | 23 | 400 | 37 | 27 | 404 | 27.5 |
| 65Ni-25Cu-Al2O3 | 15 | 291 | 35.5 | 20 | 309 | 32 | 26 | 293 | 20 |
| 55Ni-35Cu-Al2O3 | 13 | 205 | 31 | 17 | 207 | 26 | 20 | 222 | 19.5 |
| 45Ni-45Cu-Al2O3 | 10 | 118 | 23 | 15 | 115 | 13.5 | 17 | 126 | 12 |
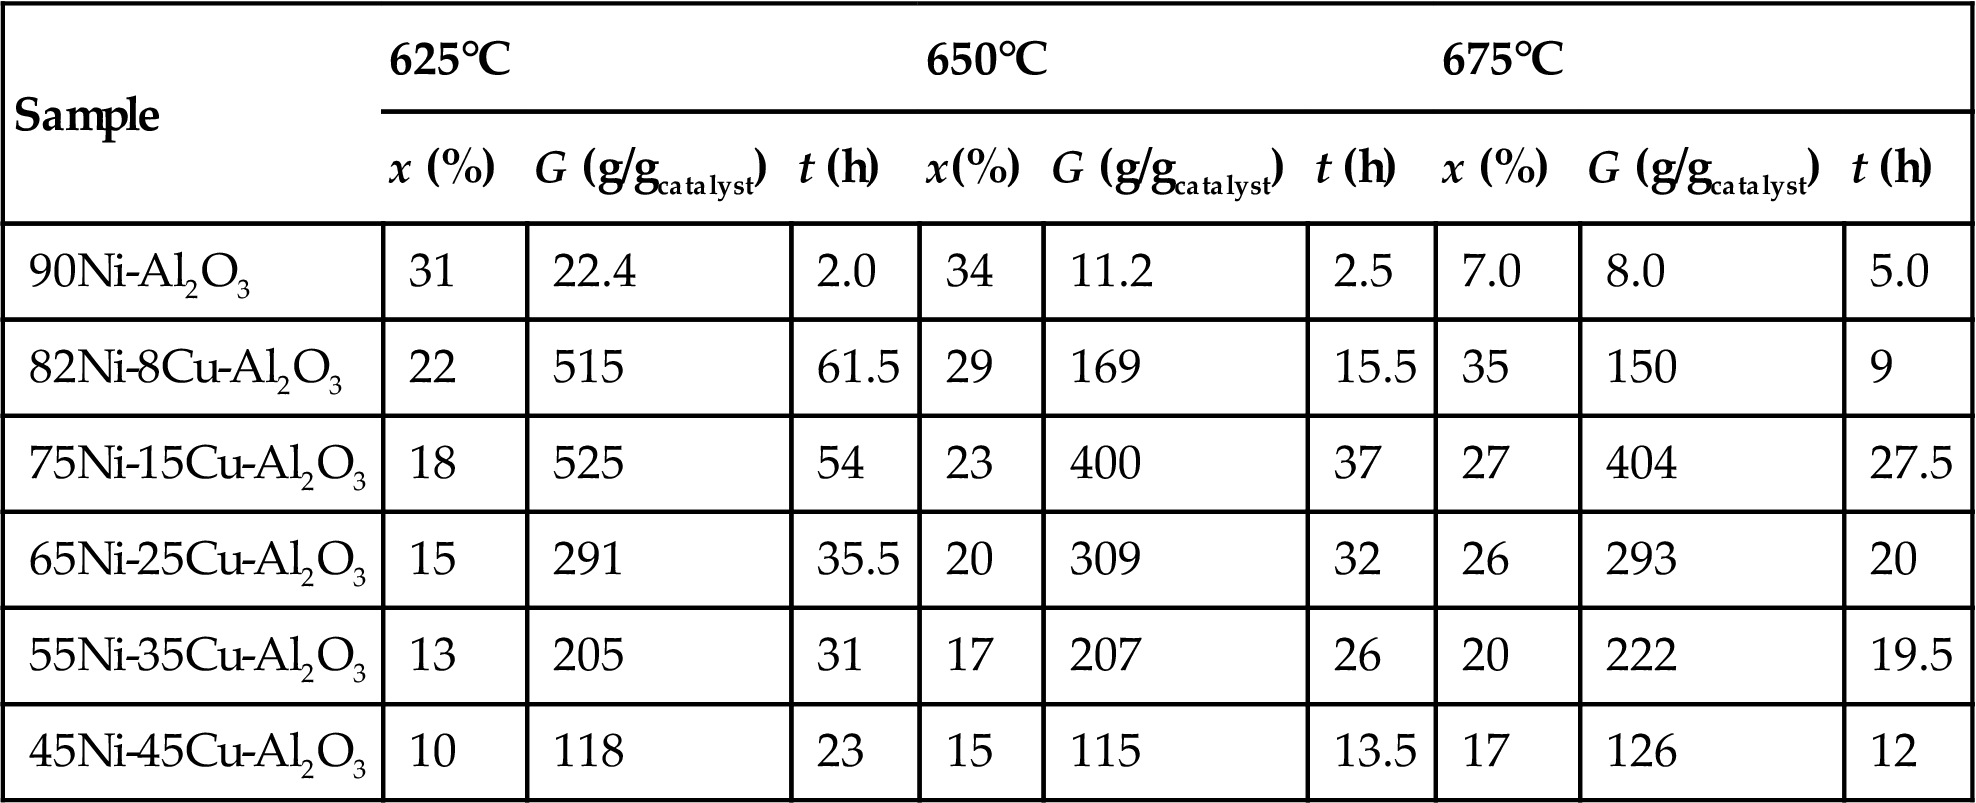
Methane space velocity=901 per gcatalyst-h, PCH4=1 bar.
Source: From T.V. Reshetenko, L.B. Avdeeva, Z.R. Ismagilov, A.L. Chuvilin, V.A. Ushakov, Carbon capacious Ni-Cu-Al2O3 catalysts for high temperature methane decomposition. Appl. Catal. A 247 (2003) 51–63.
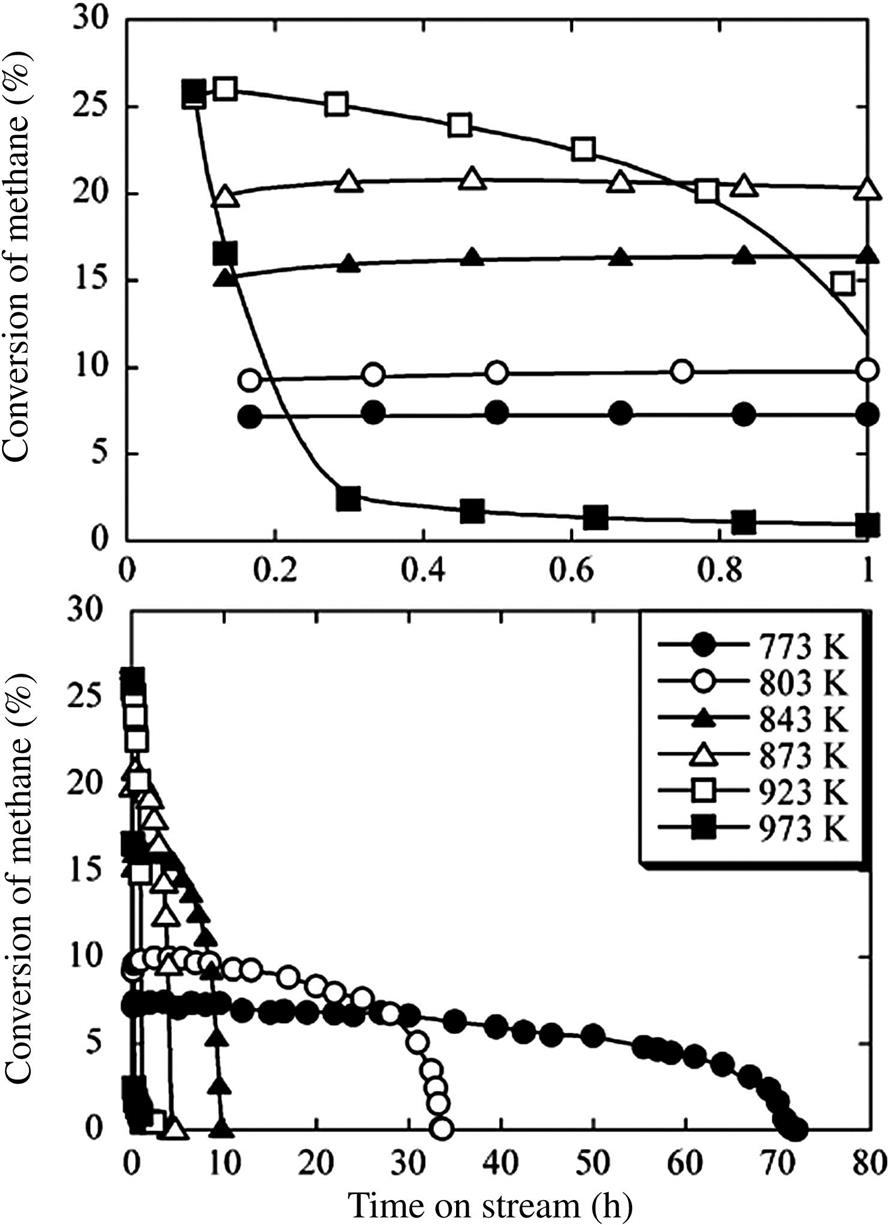
Takenaka et al. [133] have also reported an impressive maximum yield of GN at 491 g/gcatalyst with a Ni/SiO2 formulation. With 40 wt% nickel, the crystallinity of the GN increased with temperature, but the yields dropped sharply after 10 hours online for temperatures above 550°C as shown in Fig. 3.2. The top portion of the graph shows the conversion rates for the first hour of operation (in fractions) and the bottom part shows the results of a longer run. We can see from Fig. 3.2 that while the low-temperature runs yielded more GN, the conversion rate at these temperatures was low from the start (~7.5–10%). At temperatures of ~600–650°C, we see a much higher conversion rate of 25% at the start, and the run ending at about 5 hours. Given the same selectivity, a higher conversion rate saves on feed gas, and 5 hours is not bad for a run in an industrial dual reactor environment. The yield is impressive, and again, with this conversion rate and even 50% of the yield they achieved, the financial numbers would make sense.
Li et al. [134] discuss formulations to demonstrate the importance of metal substrate interaction (MSI) on the catalyst deactivation rate during the methane decomposition to GN and the corresponding yield of the GN. The addition of BaO, La2O3, and ZrO2 to the SiO2 support of a 12 wt% Co/SiO2 catalyst is shown to modify the reduction behavior of Co species and lead to changes in metal dispersion. The rate of catalyst deactivation during methane decomposition (CH4=C+2H2) is shown to increase with increasing MSI. The increasing rate of deactivation correlates with an increasing amount of graphitic carbon versus metal carbide on the used catalyst. It is suggested that an increase in graphitic carbon is a consequence of a strong MSI that limits carbon removal from the metal surface after filament formation.
Ashok et al. [135] examined the influence of copper content in a Ni-Cu-SiO2 catalyst and report the formation of GN as a result of methane decomposition. At 650°C, the Ni-Cu-SiO2 (60:25:15) composition displayed the highest activity with an initial conversion of 53%, a GN yield of 801 gC/(gNi), with a total run time of 1800 min. The GN yield increased with an increase in the Cu content up to a molar composition of Ni:Cu:Si of 60:25:15.
3.1.2 Summary
The discussion above is very brief for the vast catalysis domain in any synthesis effort. But it should be enough to help connect the dots for those interested. The crux of the matter is that there are multitudinous avenues to end up with the catalyst most suited for GN synthesis, especially keeping the industrial needs in mind. Literature gives enough details to give anybody a running start to sit with their catalyst manufacturer and get to the required catalyst within a short period of time. Out of necessity, we changed from a licensed catalyst to our own when the licensor did not renew our license, and learnt all that I have explained in this section, with the pleasant conclusion of significantly reduced catalyst costs.
3.2 Reaction Mechanisms
The specific properties of any type of carbon nanofibers (CNF) originate from their structure and dimensions. Generally the structure of GN is controlled by the nature of the catalysts used and the interaction between the catalysts and carbon sources under working conditions [136–138]. Therefore, in my opinion, some understanding of these factors is important to interpret empirical data and assist in the modifications of design parameters for your final equipment design.
The mechanism of carbon filament (fiber) formation over catalysts has been studied for many years [6,139–144]. However the work was originally done for reasons other than producing nanomaterials. In steam reforming and methanation processes, deactivation of catalysts or rupture of the reactor walls were found to be caused by the formation and/or deposition of filamentous carbons [139,145]. Since the 1990s CNFs have received new attention as potential nanomaterials. It has thus become important to devise means to selectively synthesize CNFs in as high yields as possible, instead of suppressing their formation.
3.2.1 Intermediate structures as building blocks
Before taking final form, it is postulated that the GN may go through an intermediate structure. Yoon et al. [146] examined structures of three typical types of GN, such as catalytically grown platelets, herringbone (also known as fish bone), and tubular types. Scanning electron microscope (SEM), high-resolution transmission electron microscope (HR-TEM), and scanning tunneling microscope (STM) were used for high-resolution scanning. A SEM is a microscope a beam of electrons scan the surface of materials. The reflection of these electrons form an image.
A HR-TEM creates images of the atomic structure of the material. It is one of the modes of an imaging microscope called Transmission Electron Microscope (TEM). In TEM, an electron beam is sent through an ultra-thin sample. The sample interacts with the electrons, and an image is formed. The image is then magnified and focused on an imaging device.
A Scanning Tunneling Microscope (STM) is a surface level atomic imaging tool. The STM is based on quantum mechanics principles, specifically the concept of tunneling. A conducting tip is placed extremely close to the sample surface. A voltage is applied between the two, and electrons, behaving like waves, can tunnel through the vacuum between them. The current generated is a function of tip position, applied voltage, and the local density states (LDOS) of the sample. The information from this current as the tip scans the surface is usually displayed in image form. Meso-dimensional clusters of the hexagonal graphene, such as carbon nano rod (CNR) and carbon nano plate (CNP), were found to be building blocks within the three structures.
In their study, highly graphitic GN were synthesized from CO/H2 using Fe catalysts. Herringbone structures with lower graphitic nature were produced from C2H4/H2 mixtures on Cu/Ni catalysts and graphitic tubular structures from CO/H2 mixtures were synthesized from Fe-Ni catalysts. The SEM and TEM images are shown in Fig. 3.3.

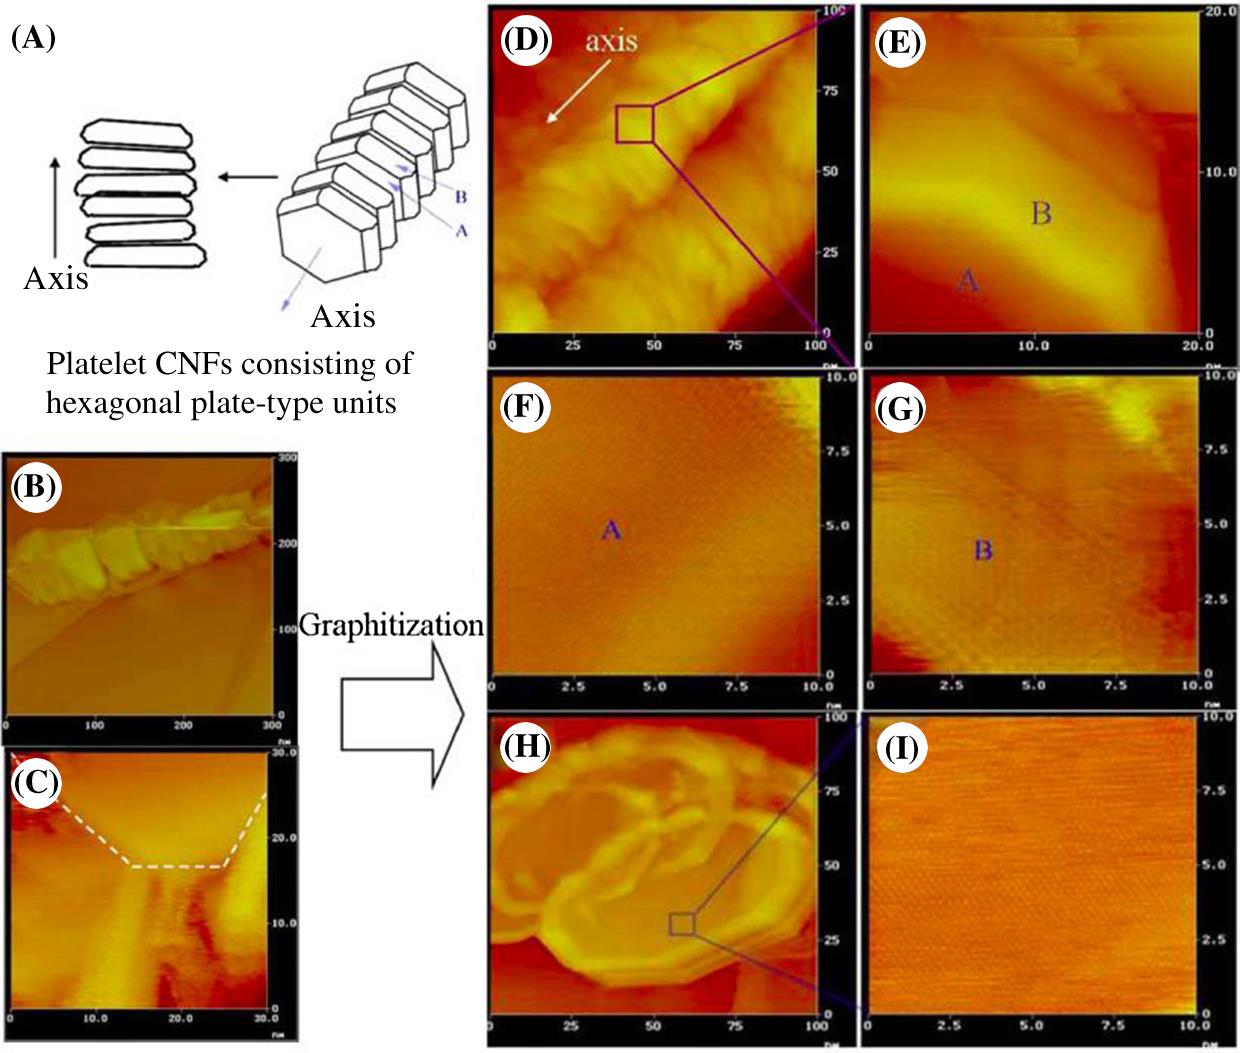
The STM images of Figs. 3.4A and B show platelet GN as-prepared. Fig. 3.4C confirms these GN consist of a number of small units. After graphitization in argon at 2800°C for 10 min, the platelet GN were easily observed. Figs. 3.4D and E show a number of rod-shaped subunits (CNR), about 20 nM in length and 3 nM wide, which were packed perpendicular to the axis and formed a polygonal pillar. The ends of CNR had dome-like caps (Fig. 3.4E) Such caps corresponded exactly to loop-shaped ends, which form by the heat treatment of platelet GN, as seen in Fig. 3.4F. Fig. 3.4E also shows the hexagonal lattice of carbon atoms on the surface of an individual CNR. Fig. 3.4G shows uniform alignment of graphenes planes in the as-prepared platelet GN like that of the graphite, whereas the biased edges of its planes as indicated by dashed circles suggest that the concentric loop-ends as shown in Fig. 3.4F are not a unique product of graphitization, but a building block of GN. When GN were ball-milled in ethanol at room temperature, some rod units separated from the GN (Fig. 3.4H).
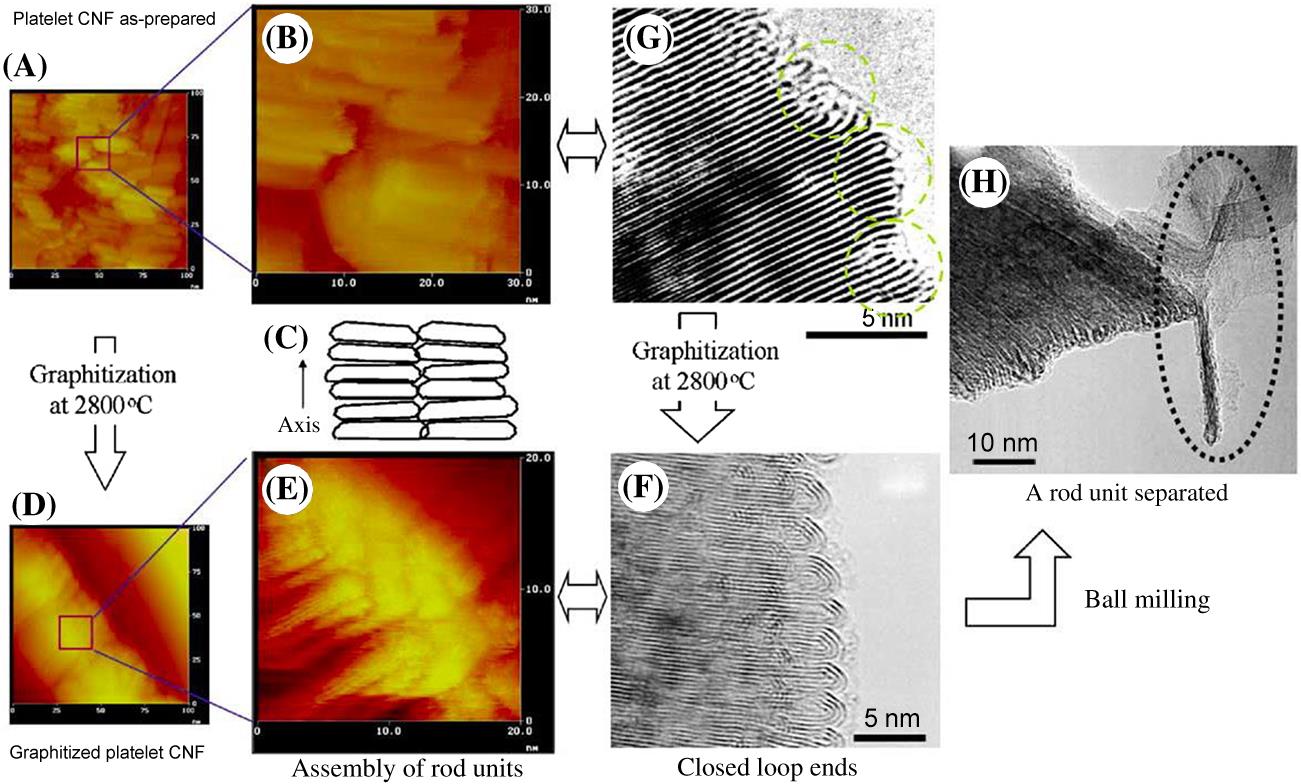
They also observed nanosized platelet units which they termed CNP as a building block in the same sample of the platelet GN, as illustrated with a model of hexagon-type plate stacking in Figs. 3.5A. CNP provided the same (002) lattice fringe pattern as that of GN or graphite from HR-TEM. The STM image in Fig. 3.5B and C shows the as-prepared platelet GN consisting of mainly CNP or its mixture with CNR. After heat treatment, the plate units became more distinct in their shape as shown in Figs. 3.5D–I. Fig. 3.5D shows independent stacking units in the fiber, each of which probably consists of several graphene layers as shown in Fig. 3.5F. Figs. 3.5F and G suggest similar hexagon arrangements of elemental carbon in the A and B faces of a CNP to both equivalent basal planes of a typical graphite crystal. The STM image of Fig. 3.5H shows the obvious presence of transverse shaped polygonal plate units and of the surface of carbon basal planes (Fig. 3.5I). Based on these findings, the authors present a three-dimensional conceptual model. They hypothesize that the cross section of rods should be rectangular or hexagonal.
The authors propose that the formation and excretion of such a carbon cluster may not occur continuously but at intervals. The excreted cluster arranges as a stable form of carbon, assembling with others to produce a particular type of CNF. A catalytic framework within the metal particle may determine the dimension and morphology of CNP or CNR. This sequence would yield structural units such as CNR or CNP, subsequently forming GN.
3.2.2 Models of reaction mechanisms
Other typical models for the formation of GN involve the steps of surface adsorption/decomposition of hydrocarbons on the free surface of a catalyst particle, diffusion of carbon formed into the catalyst particle, and precipitation as graphitic layers on another surface of the catalyst [147].
• Baker et al. [148] correlated Ni, Fe, Co, and Cr with the activation energy of carbon diffusion in the metal and suggested that the diffusion of carbon through the metal particles is rate determining for filament growth. Moreover, they suggest that the driving force for this diffusion is a temperature differential created by the heat generated of the exothermic catalytic reaction supplying the surface carbon atoms and the heat absorbed by the endothermic reaction on the other face of the catalyst particle.
• But it has subsequently been pointed out [149] that filament growth was also observed in cases where the surface reaction was endothermic. Therefore, a carbon concentration gradient was suggested as the driving force instead. The gradient would occur due to a difference in carbon activities at the filament/metal particle interface and at the part of the metal particle surface where the decomposition takes place. This suggestion was supported by reports in the literature that the carbon activity in a metal depends on the composition of the gas phase adjacent to the metal surface.
• Boudart and Holstein [150] also demonstrated with calculations that the temperature difference between the exothermic and endothermic faces is negligible (less than 0.1 K). In the calculation it was assumed that the metal particle diameter is equal to (or less than) 100 nM, which is an order of magnitude smaller than the particle size used in the CVD of GN. But in the case of GN synthesis via fluidized CVD, the fluidization of the particle exposes it to the same temperature on both sides. Furthermore, we see nanofiber growth on both sides of the catalyst. So, it would be reasonable to conclude that for most catalysts used in fluidized bed CVD synthesis of GN, the metal particle is in good thermal contact with the environment on both faces.
• Carbidea as intermediates. Geus and collaborators [151–153] have suggested what is known as the carbide formation mechanism. They reported on extensive studies of carbon filament formation from decomposition of CH4 and CO over Ni/SiO2 and Fe/SiO2 catalysts by gas-phase analysis. They concluded from results of equilibrium studies and from estimates of the surface and defect energies of the filaments that the energy of filament formation or temperature gradient could not be responsible for the observed equilibria. They suggested that this conclusion together with the results of the measurements supported the idea of intermediate unstable carbide formation (carbide equilibrium model), which would determine the deviation from a graphite equilibrium.
• Snoeck et al. [154] proposed that the difference in the diffusional path length causes rapid nucleation and excretion of carbon layers near the gas/metal interface. The path length of carbon diffusion through the metal particle appears to depend on the nature of the metal particle, catalyst particle size, shape, and temperature. Further they suggest that, the interaction between metal and carbon sources at the gas/metal interface may affect the adsorption and decomposition of carbon sources, governing the nucleation rate.
• Helvig [155] and Puretzky et al. [136] used time-resolved, in situ HR-TEM and reported on the formation of fibers from methane decomposition by nickel nano crystals supported on Al2O3. The nanofibers were found to develop through a reaction induced spontaneous reshaping of the nickel nanocrystals into crystalline nickel nanoclusters. The alignment of the resulting fibers was dependent on the size of the clusters. The elongation of the Ni particles correlated with the formation of more graphene sheets at the graphene–Ni interface with their basal (002) planes oriented parallel to the Ni surface, offering the conclusion that the process must have involved transport of C atoms toward and Ni atoms away from the graphene–Ni interface. The nucleation and growth of the fibers involved a continuously changing formation and restructuring of monoatomic step edges at the nickel surface with the nickel assuming elongated and pear-like shapes and returning back to near spherical shape in less than 0.5 seconds. Calculations with density functional theory (DFT) which I explained earlier, a computational quantum mechanical modeling method to determine the electronic structure in the ground state of a multi component system, confirmed that the growth mechanism involved the surface diffusion of carbon and nickel, but the metallic step edges acted as spatiotemporal dynamic growth sites. A graphene over-layer would change the adsorption energy of C and Ni adatoms on the Ni (111) surface. Nickel adatoms bound more strongly at the interface than on the free Ni (111) surface. Adsorbed C atoms could induce Ni step edges because the C binding energy to the Ni step is larger than the energy required for step formation. C adatoms at the interface would be destabilized increasing the barrier for carbon diffusion from the free surface to the interface. They conclude that surface transport of C atoms is the rate-limiting step for the nanofiber growth.
Though the initially described bulk carbon diffusion cannot be discounted yet, these results suggest that it is possible to transport C along the graphene–Ni interface. Step edges act as growth centers for graphene growth. Catalytic reaction designs usually assume a fixed number of stationary sites; so this finding of a spatiotemporal continuously changing growth center could give some insight on the yet so nebulous atomic level activity.
In my humble opinion, if we consider both mechanisms work together, we could possibly modify the Carbide Equilibrium Model slightly to conclude that it could be possible that the bulk diffusion of carbon through the catalyst experiences competion from the surface transport of C toward Ni edges. This combination could be constantly changing concentration of the carbide layer, leading to a small concentration polarization somewhere between the two metal faces that is overcome after more methane is decomposed on the surface, and more C is available. This small interval could explain the findings of Yoon et al. [146] that the fibers form in pulses.
Finally, Ammendola et al. [156] report on some practical factors such as resistance to attrition and pore occlusion. They tested what they term as high gas velocities up to 11.6 cm/s and found very little attrition. Judging by the van der Waal force strength, this result should not be surprising, since high Reynold’s numbers would be difficult to achieve with moving particles of low density, low velocities, and short contact time, considering the vertical height of the reactors typically used for fluidized bed synthesis. As discussed later in the results of our work, the particles must be in a controlled turbulent mode for a longer period of time than simply the transit time through the reactor.
These critical factors are involved in the formation rate and type of CN precursors, and should be part of the thought process of design engineers in formulating catalysts as well as mass production reactors.
3.2.3 Summary
1. Diffusion through the catalyst particle is the most accepted path for GN synthesis.
2. Another widely accepted concept is the Carbide Equilibrium Theory, which predicts the formation of metal carbide films as an intermediate before diffusion into the catalyst surface.
3. Physical observations of intermediate structures that eventually can become GN, theorizes that the nature of GN formation is not consistent, and occurs at intervals.
4. A combination of 1 and 2 could explain the visual observations of 3, and should be considered in the synthesis design of GN.
3.3 Growth Rates of GNs
Knowledge of the growth rates with fairly close approximations is one of the factors high on the wish list among the important aspects of designing reactors. Mostly, this is accomplished by pilot studies and empirical data. However an intelligent starting point during the pilots never hurt anyone. In 2005, with limited knowledge and experience, our group needed some basic cause and effect knowledge for growth rates. We took guidance from engineering handbooks and literature but the task was unprecedented so we had to read between the lines on many fronts. We looked at CVD processes across different industries. Long story short, even then, we lost our catalyst from a vertical furnace for several of the initial runs.
One of the more comprehensive work I have read in this field was from Ilia et al [136]. They describe time-resolved reflectivity (TRR) of Vertically Aligned Nano Tube growth kinetics. Simply put, TRR is a way to study the change in properties (hence composition, phase) of a material over short periods of time (10−16 seconds) by spectroscopic methods using pulsed lasers. The paper elucidates the complex mechanisms and factors affecting the rate equation with direct measurements and a derivation of the resulting differential equation, finally leading to a simplified form that I could derive useful information from. Growth rates and terminal lengths were measured in situ. They considered the following factors for derivation and solving the rate equation:
• The number of carbon atoms initially formed by the cracking of the hydrocarbon gas (in this case C2H2).
• Of that number, the number of carbon atoms that formed a carbonaceous layer on the catalyst surface and did not diffuse into the catalyst particle and the inactive surface atoms of the catalyst on the surface itself.
• The number of carbon atoms that did diffuse into the catalyst particle.
• The number of carbon atoms that would precipitate as nanotubes by using the surface density of a monolayer of graphene and extrapolating to MWCNT.
• The activation barriers for sticking and catalytic decomposition of feed as well as their gas phase product.
• The flux of the hydrocarbon gas.
• Partial densities of feed and it’s pyrolysis product that stays in the gas phase.
A simplified model for an analytical solution of the rate equation is then presented by the authors for determining the parameters that control the growth kinetics and termination, leading to knowledge of rate constants. The simplified analytical solution for temperatures <700°C and ignoring the effect of catalyst inactivity due to carbon deposition and a boundary condition requiring no conversion of feed to gas phase pyrolysis products, the rate relationships determined were:
The kinetics have the characteristic times, τt=1/kt and τsb=1/ksb Where:
kt=The characteristic rate constant for the bulk diffusion to the growth edge of a carbon nanotube.
ksb=surface–bulk penetration constant.
The termination time and length are shown to be defined as the ratio of the rate constants of bulk surface diffusion and carbonaceous deposit formation.
The authors also share growth rates for two different temperatures.
Their work on growth rates versus time and temperature is shown in Fig. 3.6.
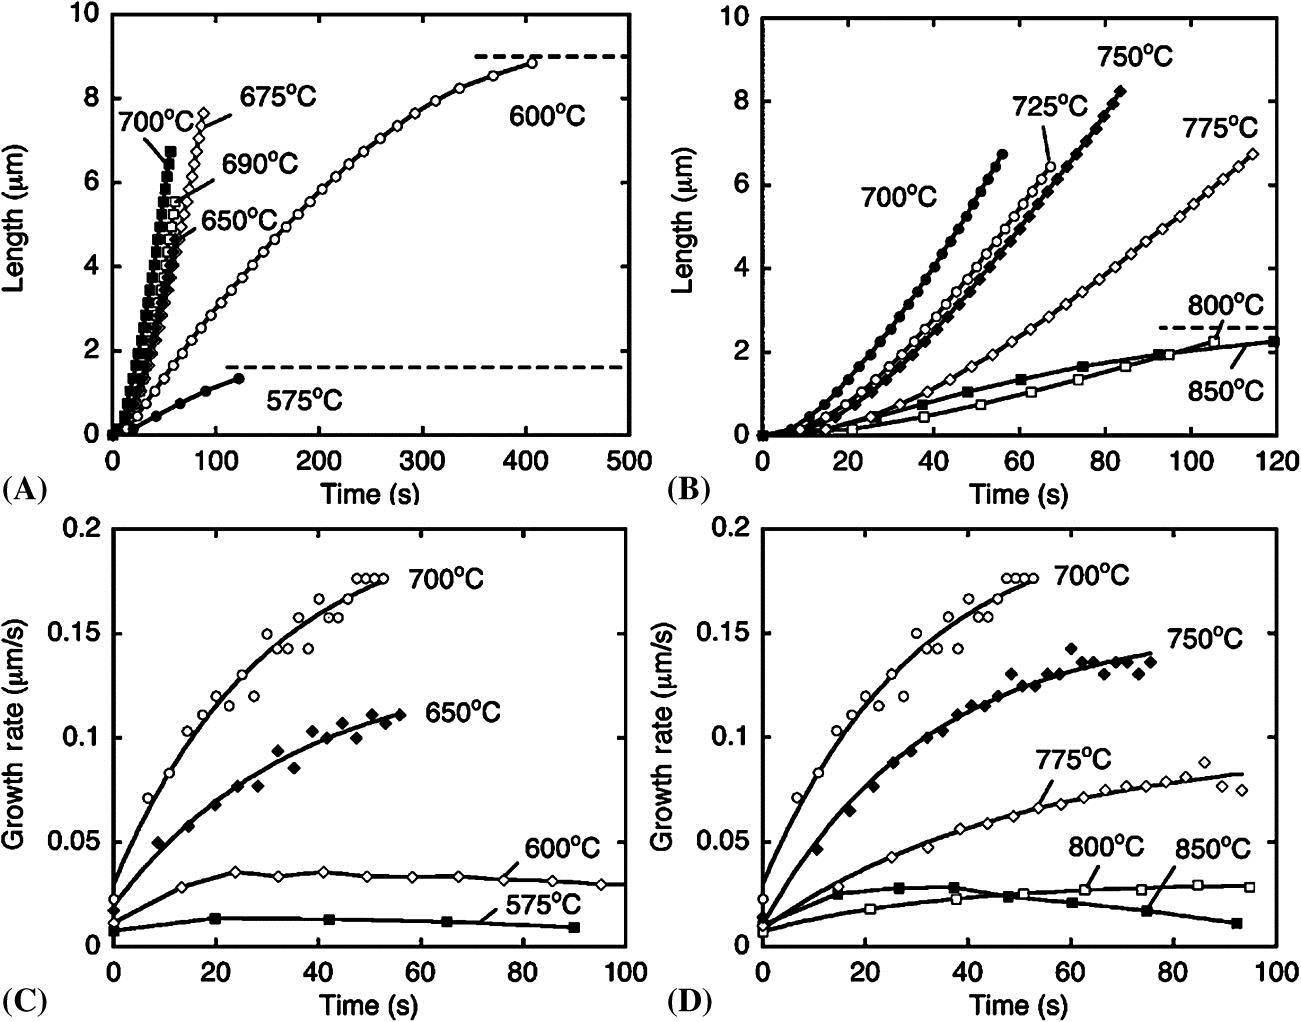
We can deduce from the graph that at higher temperatures, it takes more time to reach the maximum growth rate. At 575°–600°C it takes less than 20 seconds to reach the maximum growth rate (C). At 650°C–700°C, this time increases to ~50 seconds. The published data on CVD reactor design, kinetics, and relationships between variables gave us a good start, but, as we shall note again in the manufacturing section, the best way to design reactors with the limited amount of useful theoretical information available is to collect empirical data with pilot studies. There is no way around empirical data.