Costs of Manufacturing
Abstract
This chapter describes in detail the costs of the production of graphitic nanofibers, carbon nanotubes, and graphene oxide. A comprehensive explanation of cost factors with calculations is concluded with a summary table of cost per Kg-product. Detailed calculations are provided. The chapter concludes with a section on the cost addition if GO was exfoliated to graphene by ultrasonics or supercritical Carbon Dioxide.
Keywords
Carbon nanotubes manufacturing costs; Graphene Oxide manufacturing costs; Graphitic Nanofibers manufacturing costs; graphene manufacturing costs; manufacturing costs; synthesizing
5.1 Carbon Nanotubes
Before we go into discussions about applications and their viability, let us arm ourselves with some costing knowledge about the three materials. We are pretty much familiar with the manufacturing and purification processes of graphitic nanofibers (GN), so I will just comment briefly on carbon nanotube (CNT) and graphene oxide (GO). Further down, we will look at the cost of converting graphite flakes to graphene. To keep our focus on practicality, especially for costs, we will skip the many, many references of CNT synthesis by carbon sources other than methane. These exotic gases have served their purpose well for the authors, but would be difficult if not impossible to scale their use as a feedstock for viability on the commercial end. For example, Moreno and Yoshimura [109] discuss hydrothermal production of multiwall carbon nanotubes (MWCNTs) from amorphous carbon at 800°C and 15,000 psig without any catalysts, Magrez et al. [184] talks about C2H2 as a feedstock with a low yield, and McCaldin et al. [183] discusses C2H4 as a feedstock. As we shall see, even using natural gas as a feedstock makes the products expensive to make. We have discussed the need and complexity of purification of CNTs. These procedures further increase production costs.
5.2 Graphene Oxide
Let me first explain how I have viewed GO in this book: The applications discussed in this book have been chosen with a purpose in mind that GN is an excellent candidate for the given applications. The research and publications cited with “graphene oxide” in their title describe flake graphite as the starting material and oxidation thereof. In my opinion, very few applications I studied would actually require few-layer graphene flakes, except when specifically noted. The materials should really be called graphite oxide (GO). To maintain clarity, I will continue to use the acronym GO and use the word graphene oxide for the oxidized graphite. An overwhelming majority of references cite the procedure for GO synthesis by very harsh oxidation procedures, such as the Hummers and “slightly modified” Hummers (see Figs. 5.1 and 5.2).
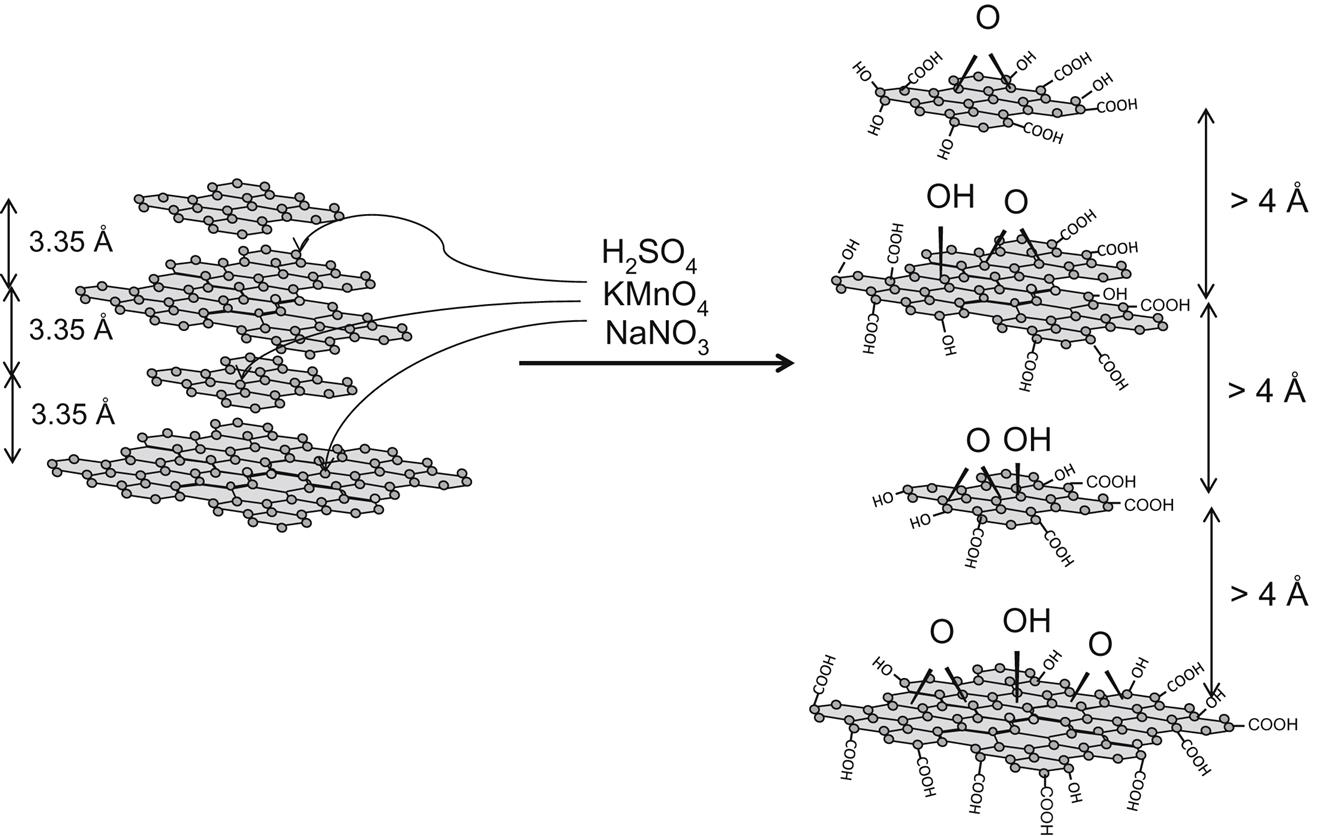
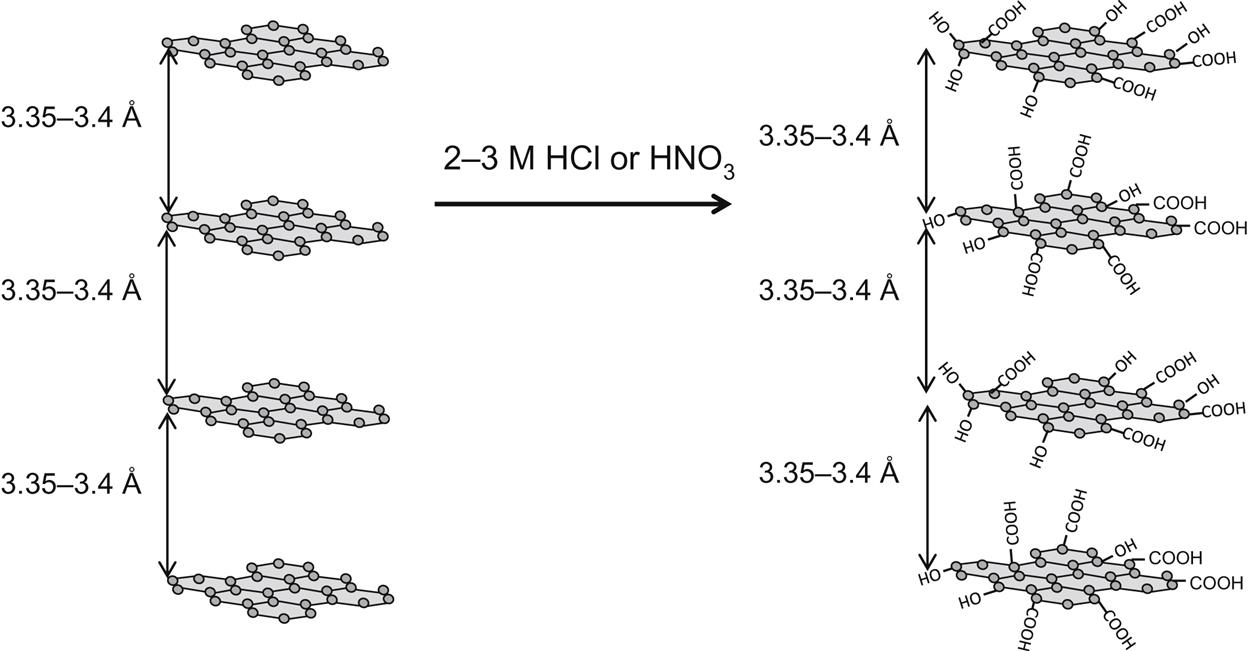
 COOH & OH groups found, do not get attacked on the basal plane.
The experimental details from the 1958 publication [113] outlining the Hummer’s method are:
Though detailed explanations for the minor modifications to the Hummer’s method are given in the experimental sections, papers claiming facile and cost effective large scale manufacturing pathways neglect to consider the environmental implications of toxic gas generation (NO2, N2O4, ClO2 (explosive)), waste treatment of the residual acids and oxidants, and the helacious cost of the chemicals required. Underscoring the purpose of the book, I emphasize the need to look at the cost of manufacturing these hyped, exotic materials. To start with, the original process generates oxides of nitrogen, which require treatment before exhaust. Graphite flakes can have many impurities that may vaporize with the NOx vapors. Since the nature of other gases in the exhaust will always be unknown, calculations for costing should be done for Selective Catalytic Reduction (SCR). The reducing agent is usually NH3 and is injected at a 1:1 molar ratio:
The sodium nitrate used in the reaction (as a catalyst) will be the source of this NO. So let’s see how much NH3 would be required for the referenced batch of 100 grams of flake graphite. Hummer’s recipe calls for 50 grams or ~0.6 moles of NaNO3. We would therefore need 0.6 moles of NH3 or ~10 grams of NH3 on 100% basis. This cost is incorporated in the calculations to follow.
5.3 Cost Calculations
The itemized costs of production for six products are tabulated in Table 5.1. As a reference point, the pricing of materials were obtained on September 30th, 2016. For commodities, I have taken the world spot prices and added a conservative 50% to arrive at the final price for delivered product, as given in Table 5.1. If a company is large enough to buy at world trading commodity prices, they will also have a much larger overhead factor in the costing. These two should cancel each other out.
Table 5.1
Summary of costs and price per kgproduct
| GN-Biogas | GN-Syngas | GN-NG | CNT-Biogas | CNT Syngas | CNT-NG | GO | |
| Direct operating cost | |||||||
| Cost of feed gas per kg | – | – | $3.39 | – | – | $8.40 | – |
| Cost of gas purification per kg | $2.96 | $2.96 | $0.62 | $7.60 | $7.60 | $1.60 | – |
| Catalyst cost | $3.33 | $3.33 | $3.33 | $9.50 | $9.50 | $9.50 | – |
| HNO3 cost | – | – | – | $22.31 | $22.31 | $22.31 | – |
| HCl cost | $1.32 | $1.32 | $1.32 | – | – | – | – |
| NaOH cost | $1.20 | $1.20 | $1.20 | $4.95 | $4.95 | $4.95 | $19.95 |
| H2SO4 cost | – | – | – | – | – | – | $14.22 |
| NaNO3 cost | – | – | – | – | – | – | $0.21 |
| KMnO4 cost | – | – | – | – | – | – | $6.30 |
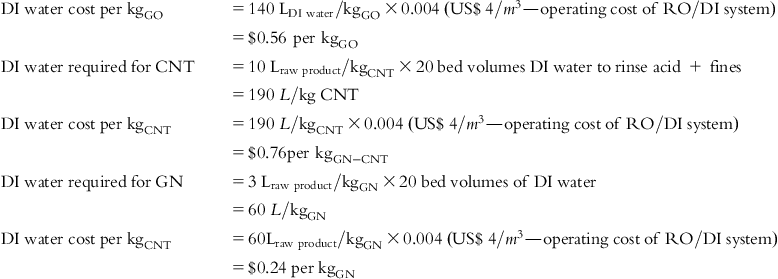
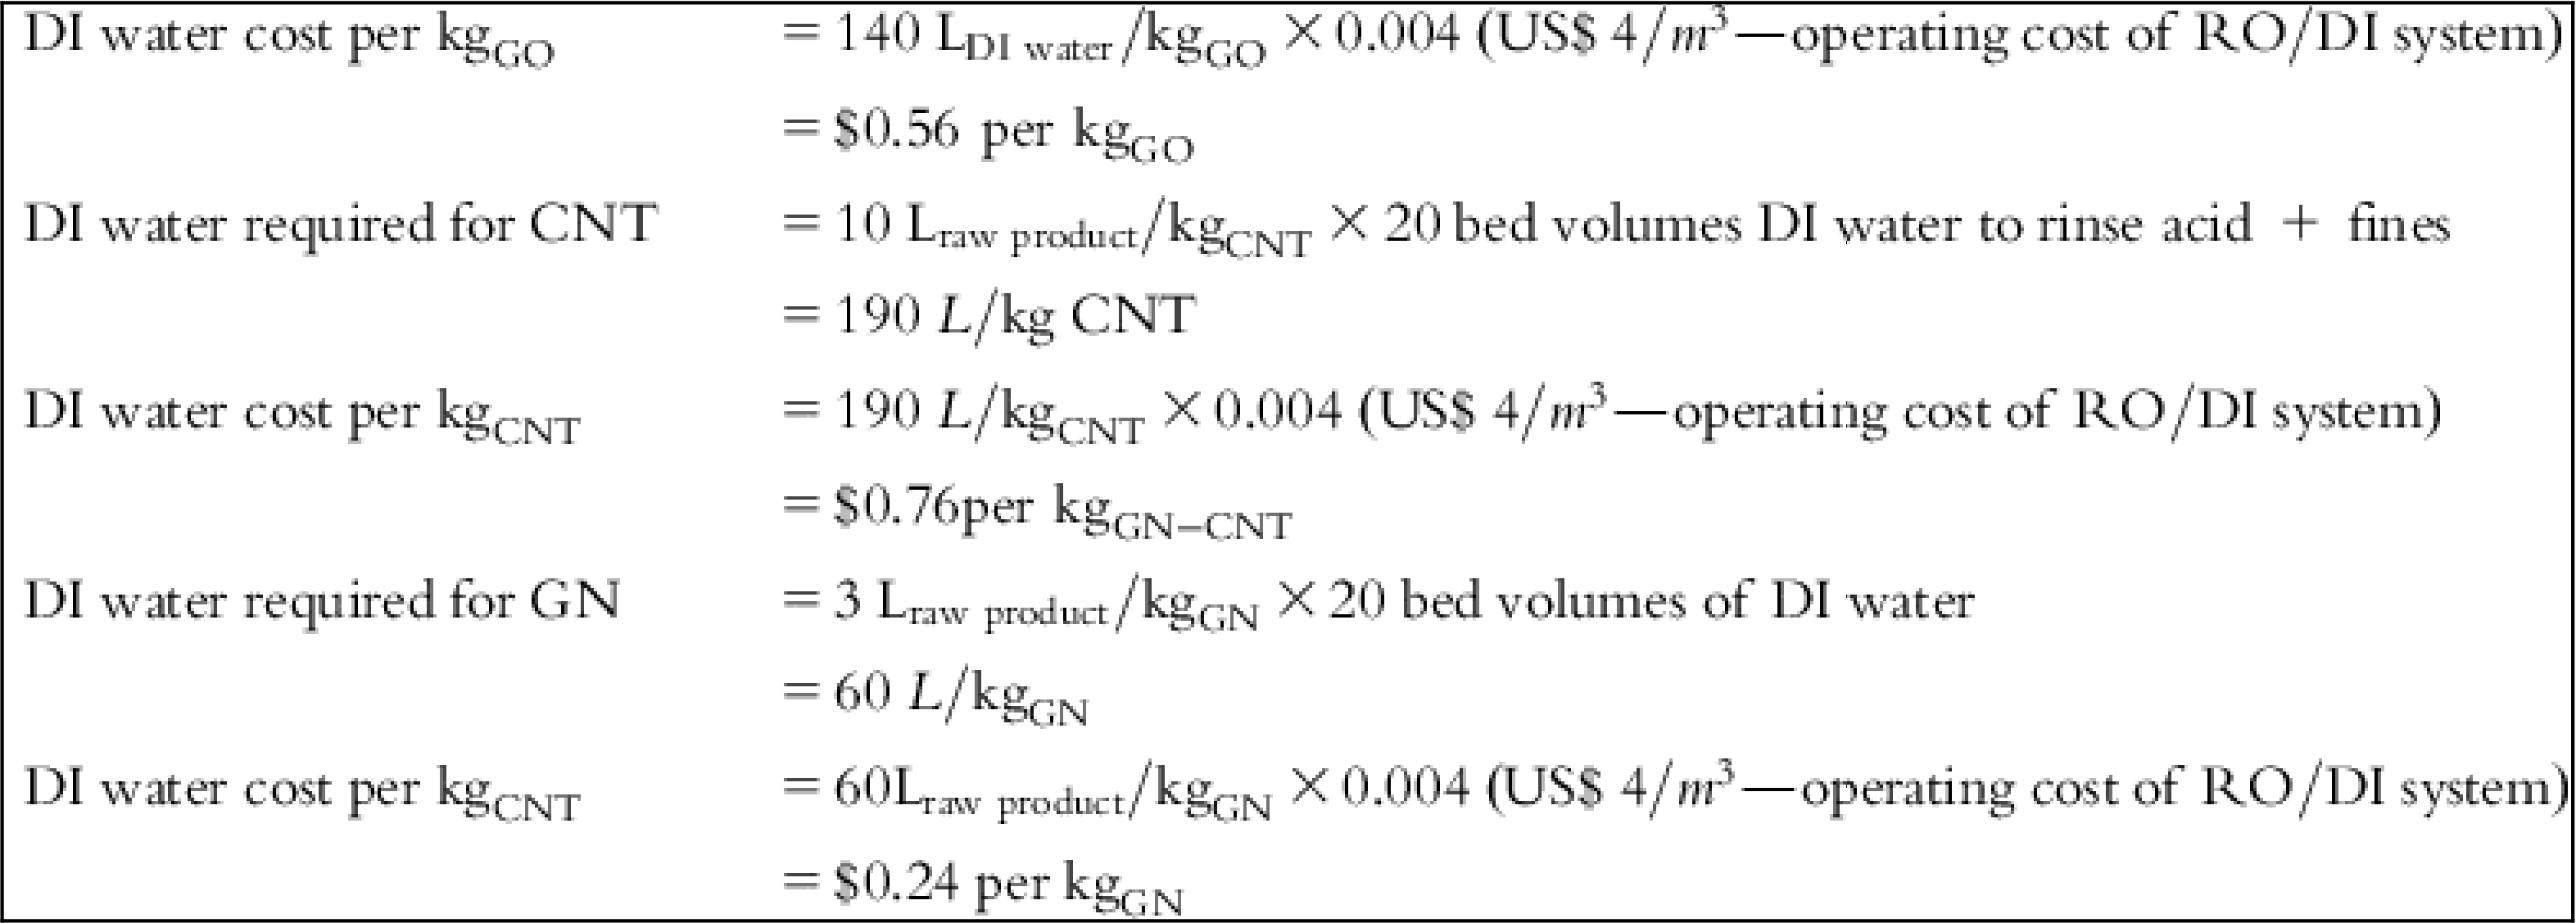
| DI water cost | $0.24 | $0.24 | $0.24 | $0.76 | $0.76 | $0.76 | $0.56 |
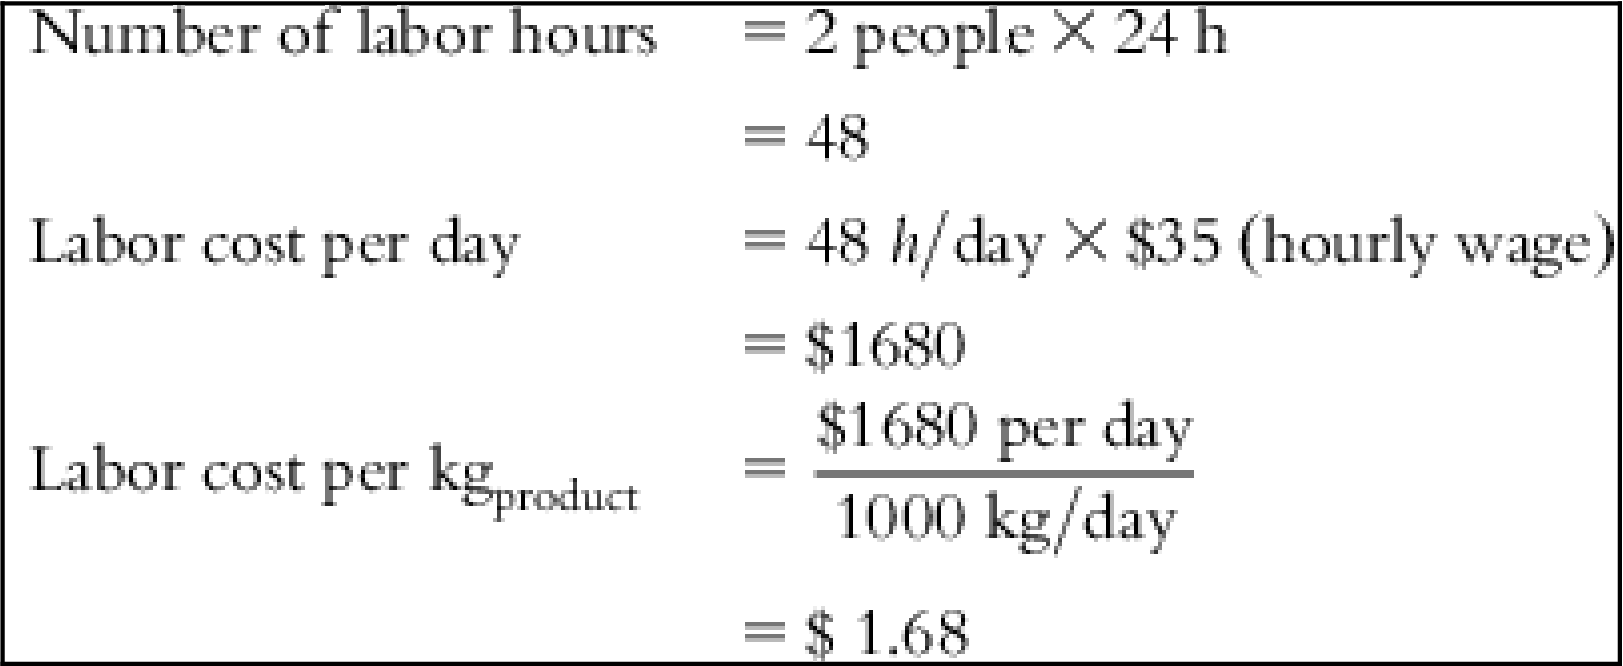
| Labor cost | $1.68 | $1.68 | $1.68 | $1.68 | $1.68 | $1.68 | $1.68 |
| Payroll expense | $0.20 | $0.20 | $0.20 | $0.20 | $0.20 | $0.20 | $0.20 |
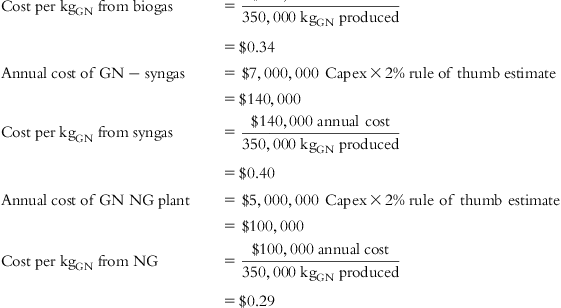
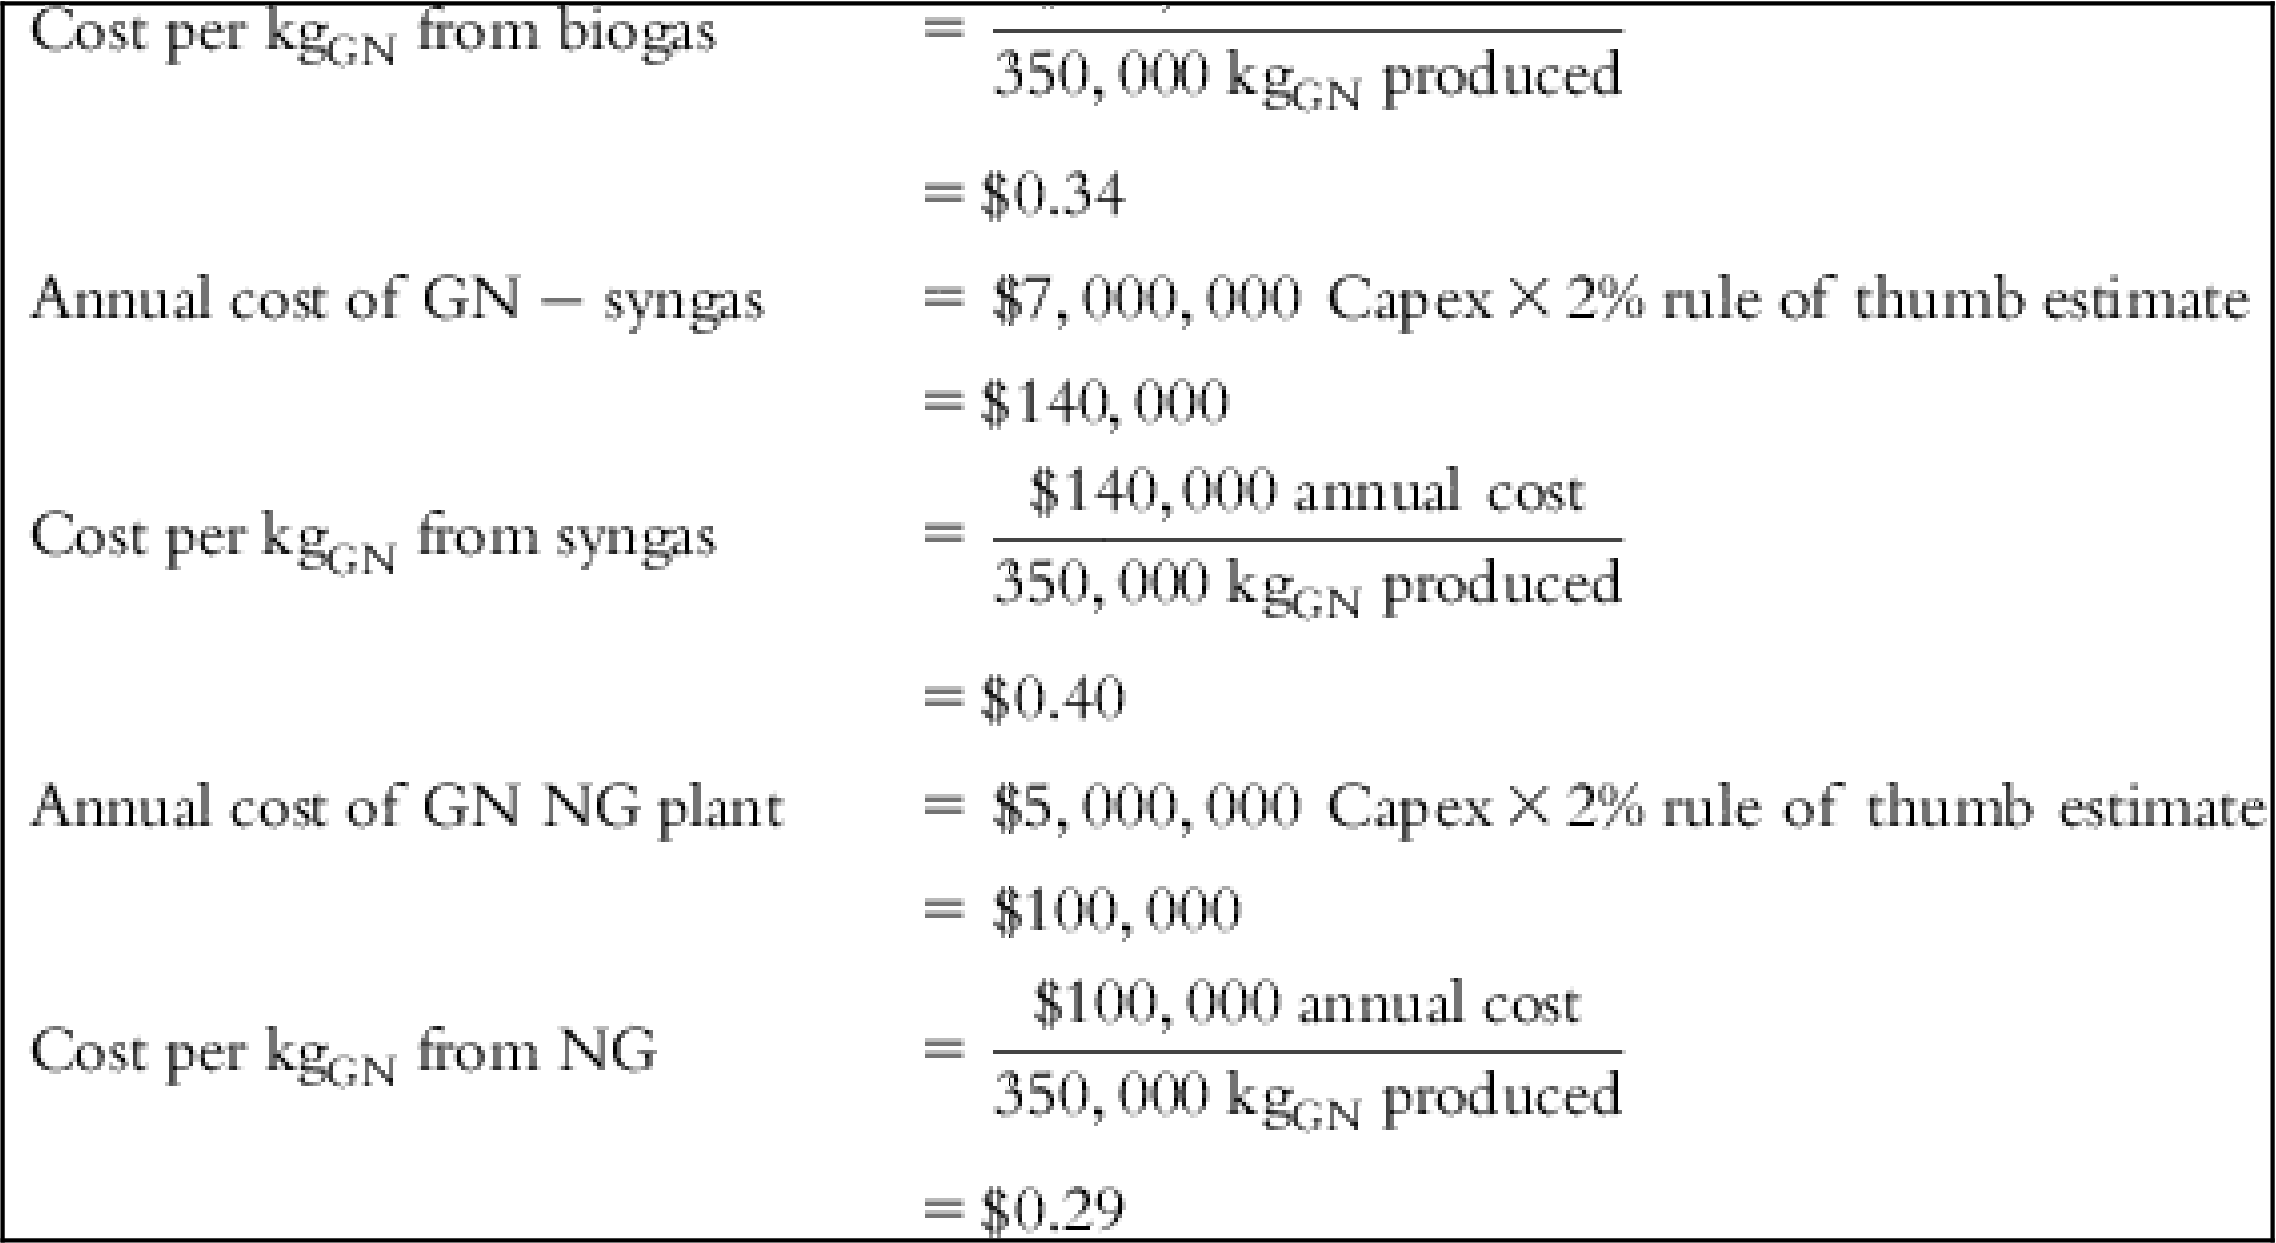
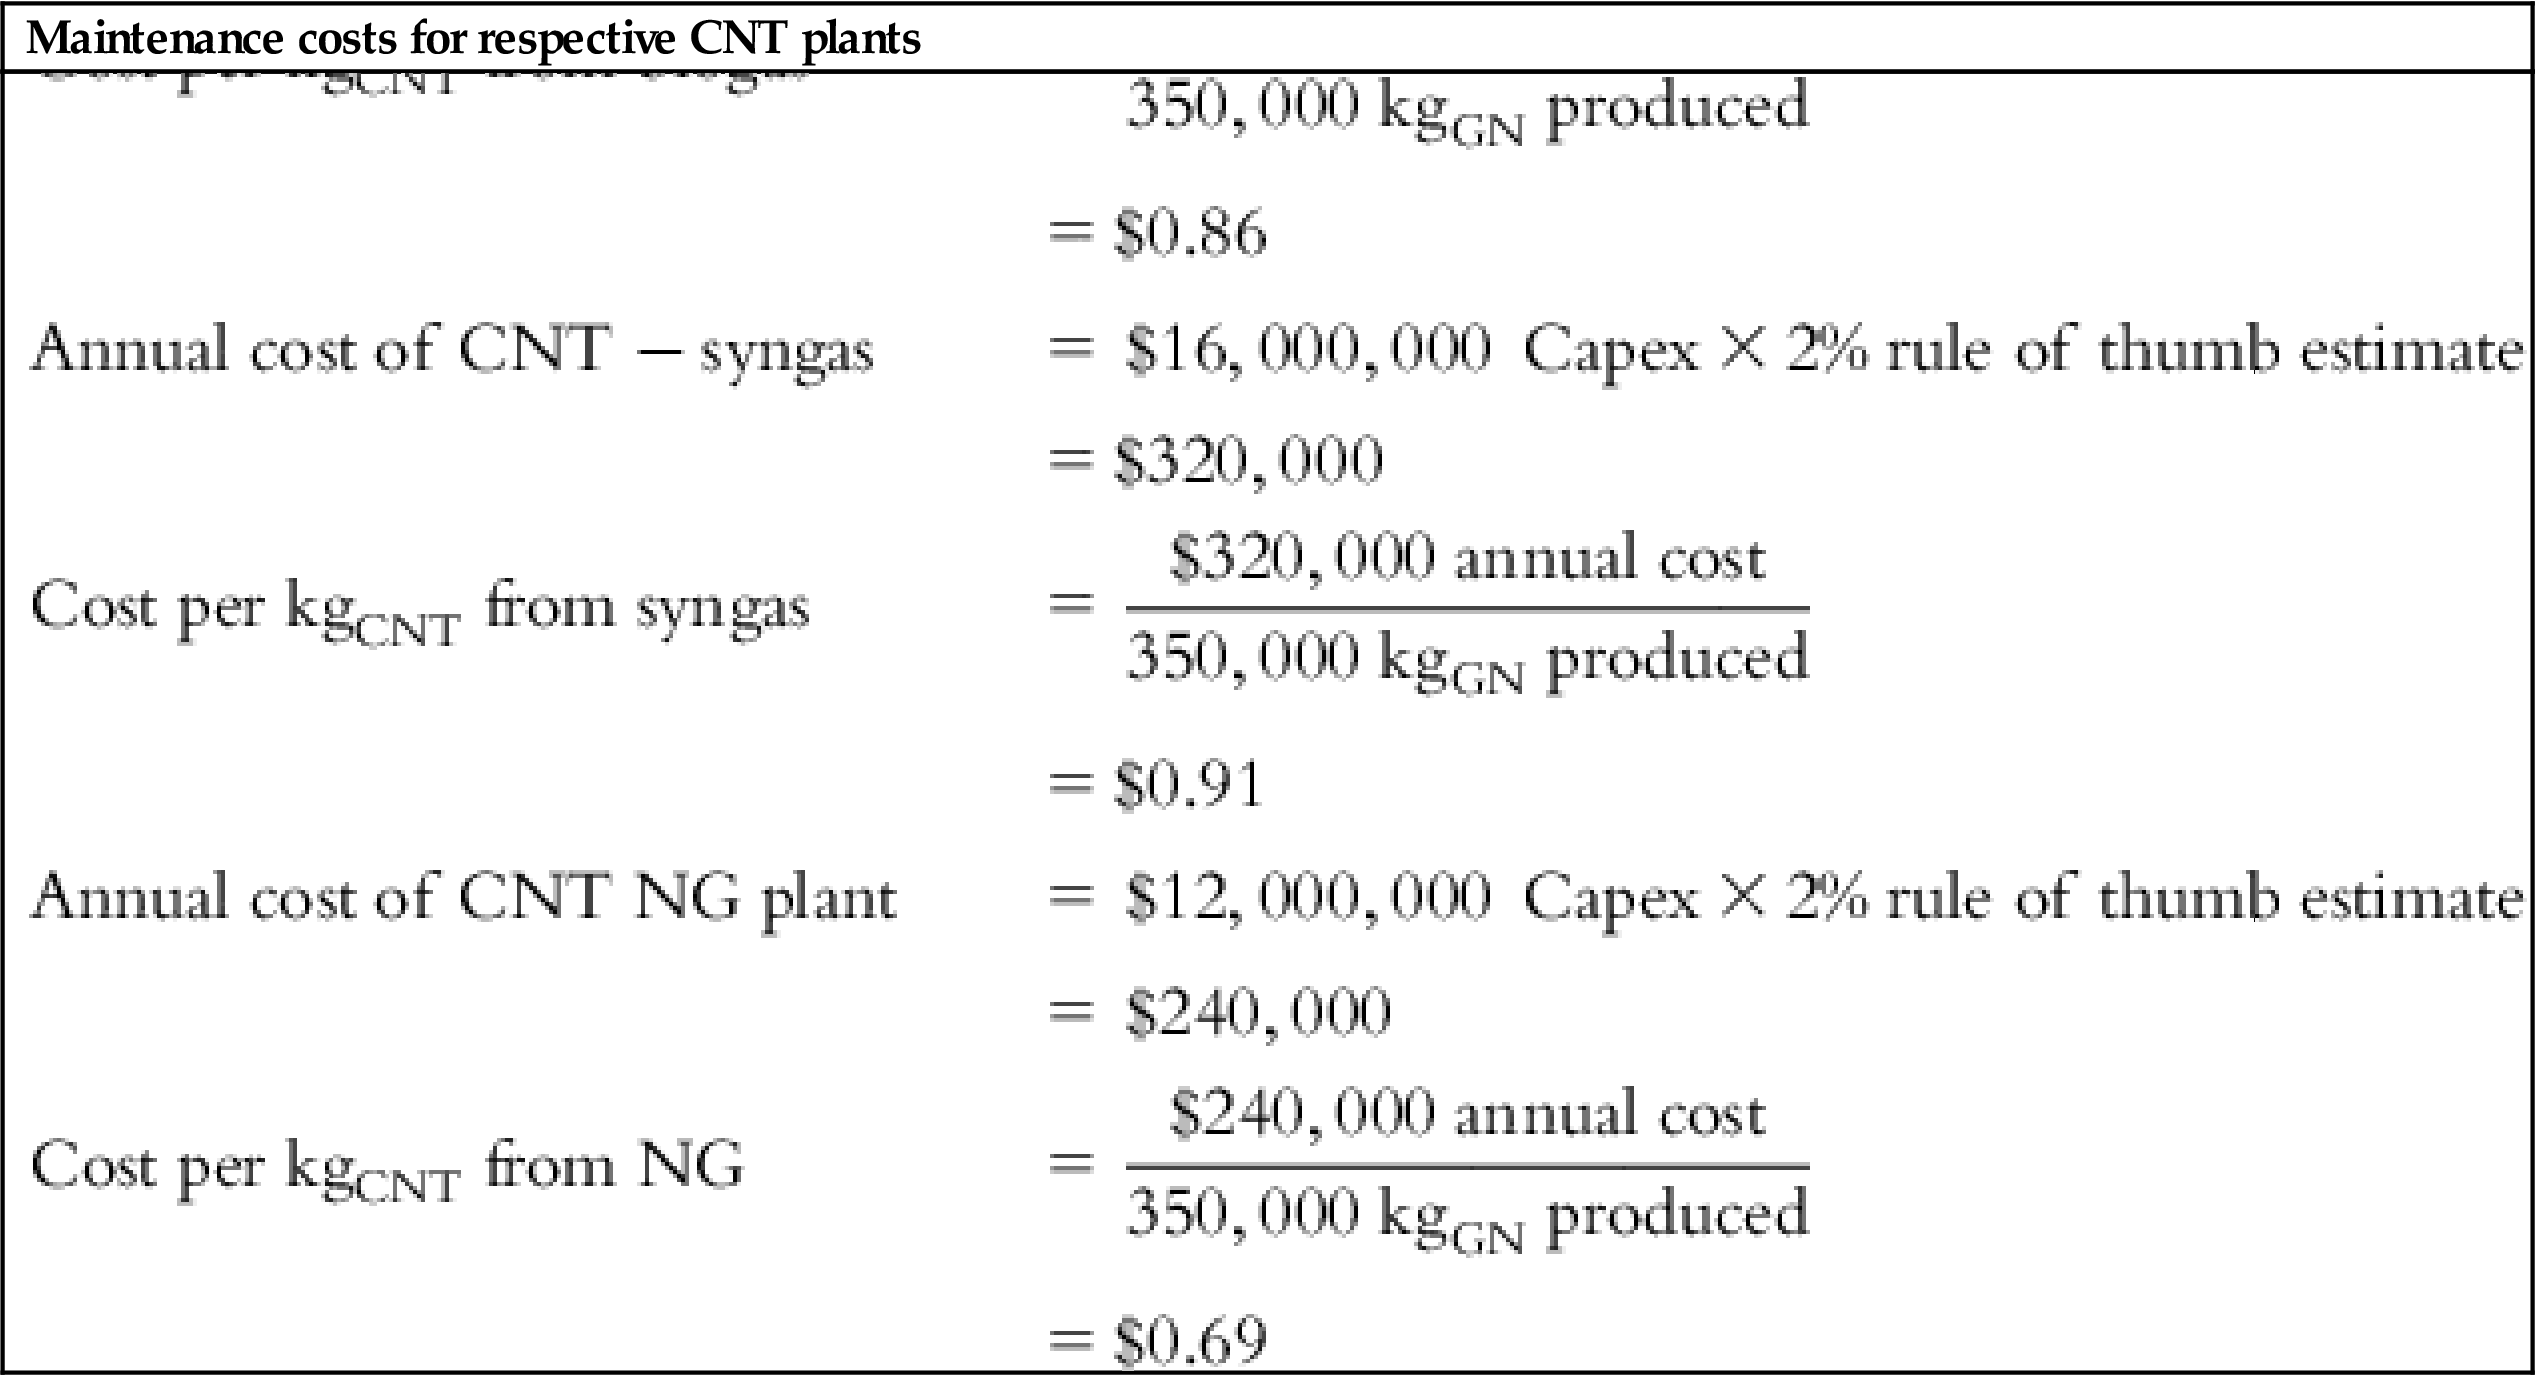
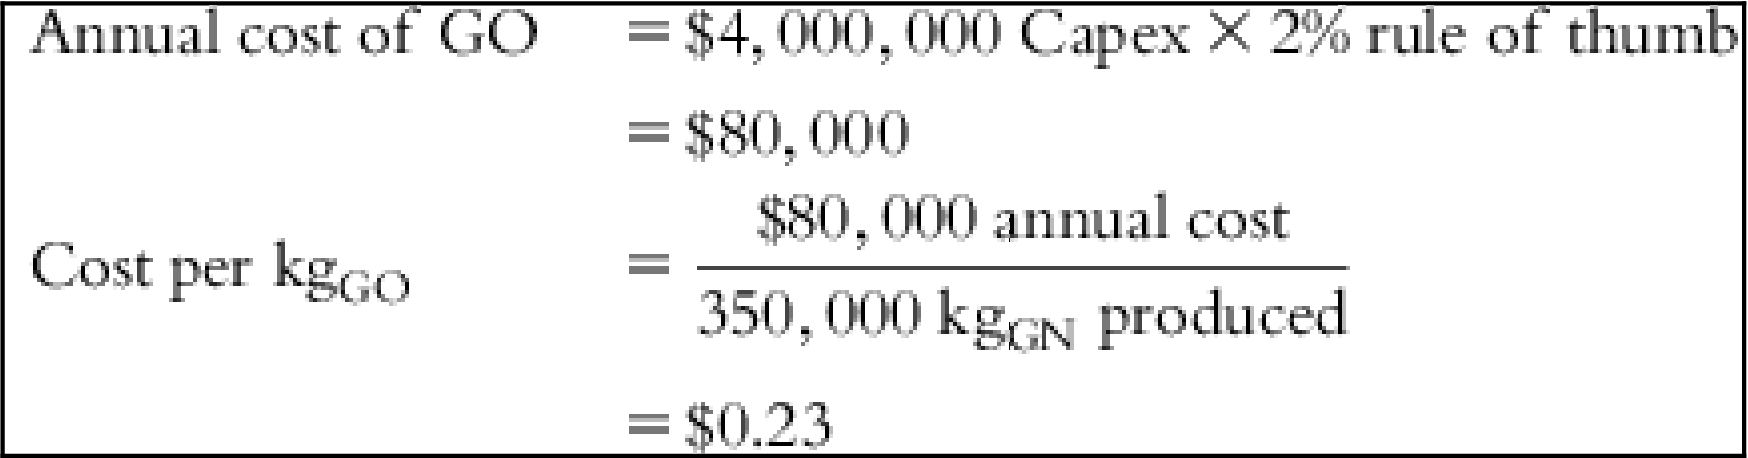
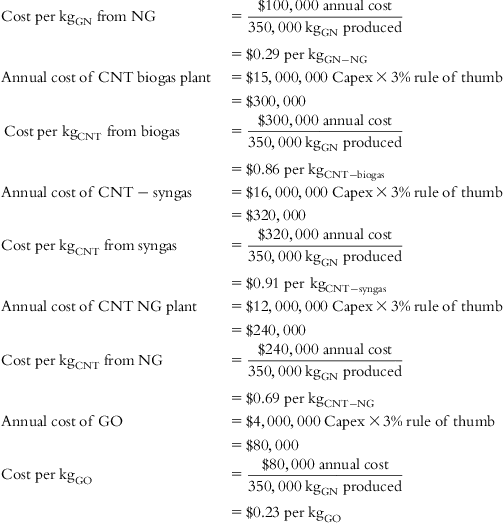
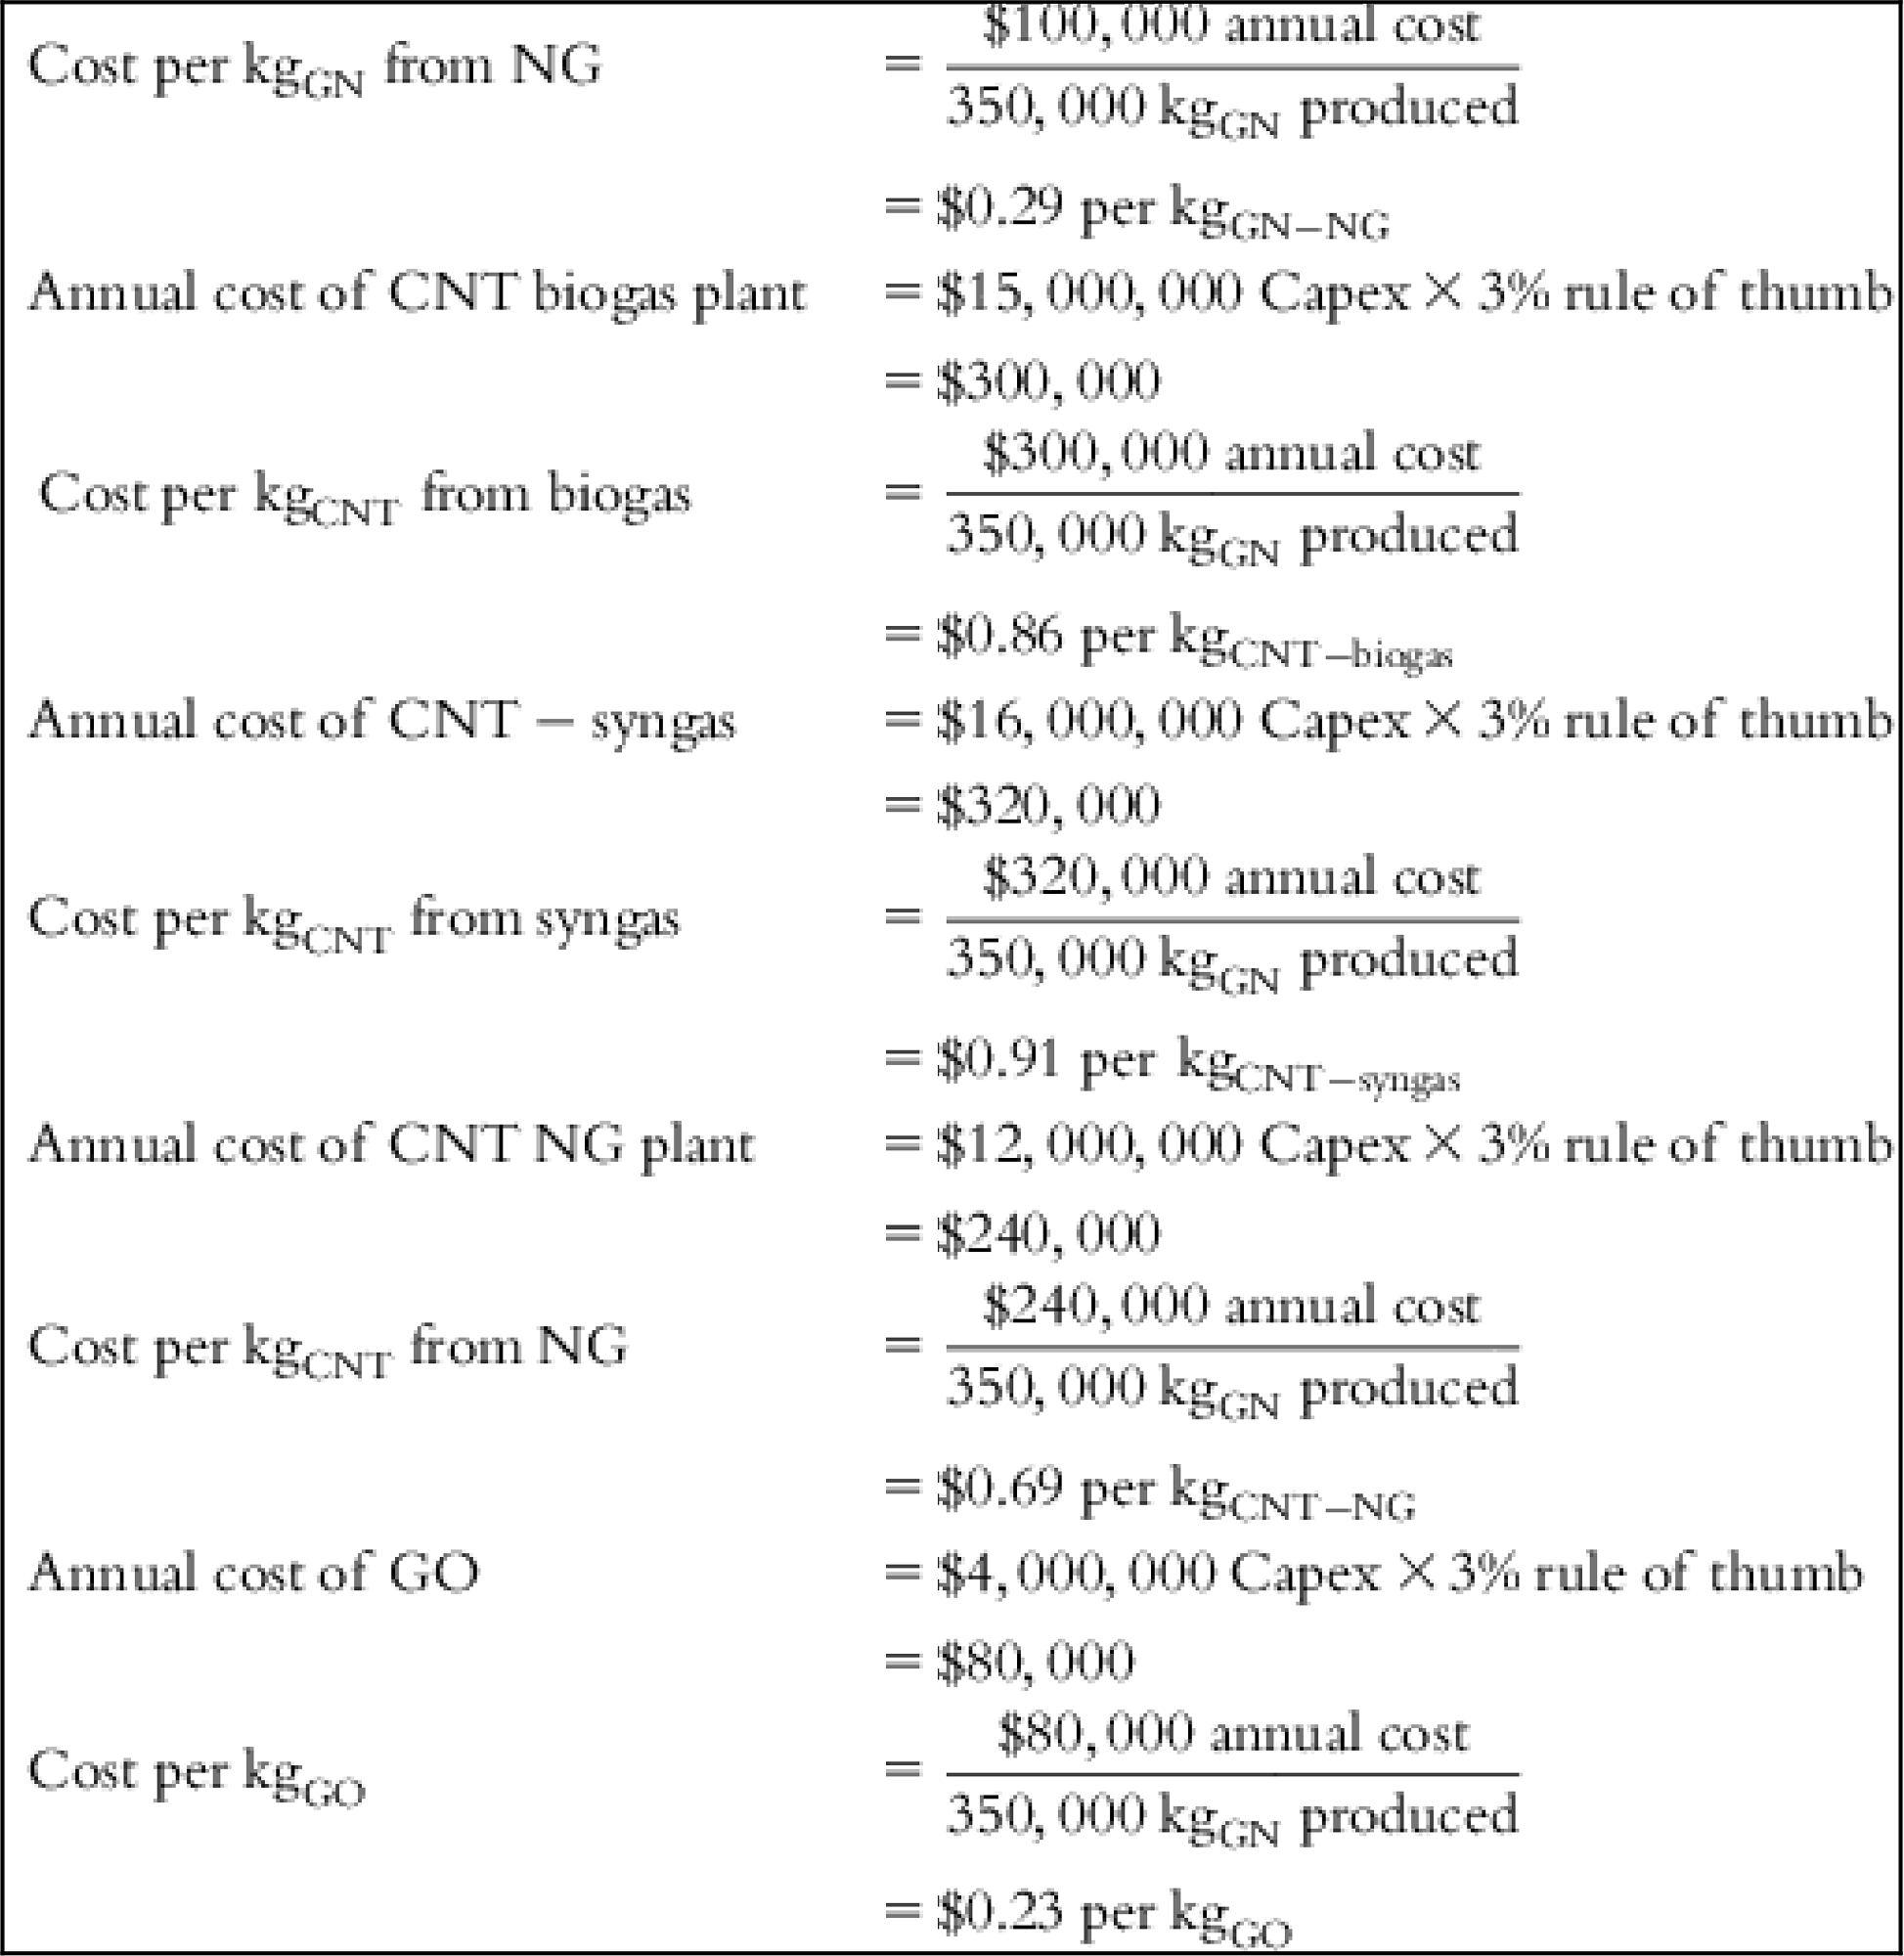
| Maintenance | $0.34 | $0.40 | $0.29 | $0.86 | $0.91 | $0.69 | $0.23 |
| NOx abatement | – | – | – | – | – | – | $0.04 |
| Flake graphite | – | – | – | – | – | – | $10.50 |
| Packaging (estimated) | $1 | $1 | $1 | $1 | $1 | $1 | $1 |
| Total direct operating costs | $12.27 | $12.33 | $13.27 | $48.86 | $48.91 | $51.09 | $54.89 |
| Other operating expenses | |||||||
| Insurance | $0.34 | $0.40 | $0.29 | $0.86 | $0.91 | $0.69 | $0.23 |
| Management salaries | $1.43 | $1.43 | $1.43 | $1.43 | $1.43 | $1.43 | $1.43 |
| Payroll taxes + benefits | $0.17 | $0.17 | $0.17 | $0.17 | $0.17 | $0.17 | $0.17 |
| QC reject | $0.61 | $0.62 | $0.66 | $2.44 | $2.45 | $2.55 | $2.74 |
| Loan payments | $2.18 | $2.55 | $1.82 | $5.46 | $5.82 | $4.36 | $1.45 |
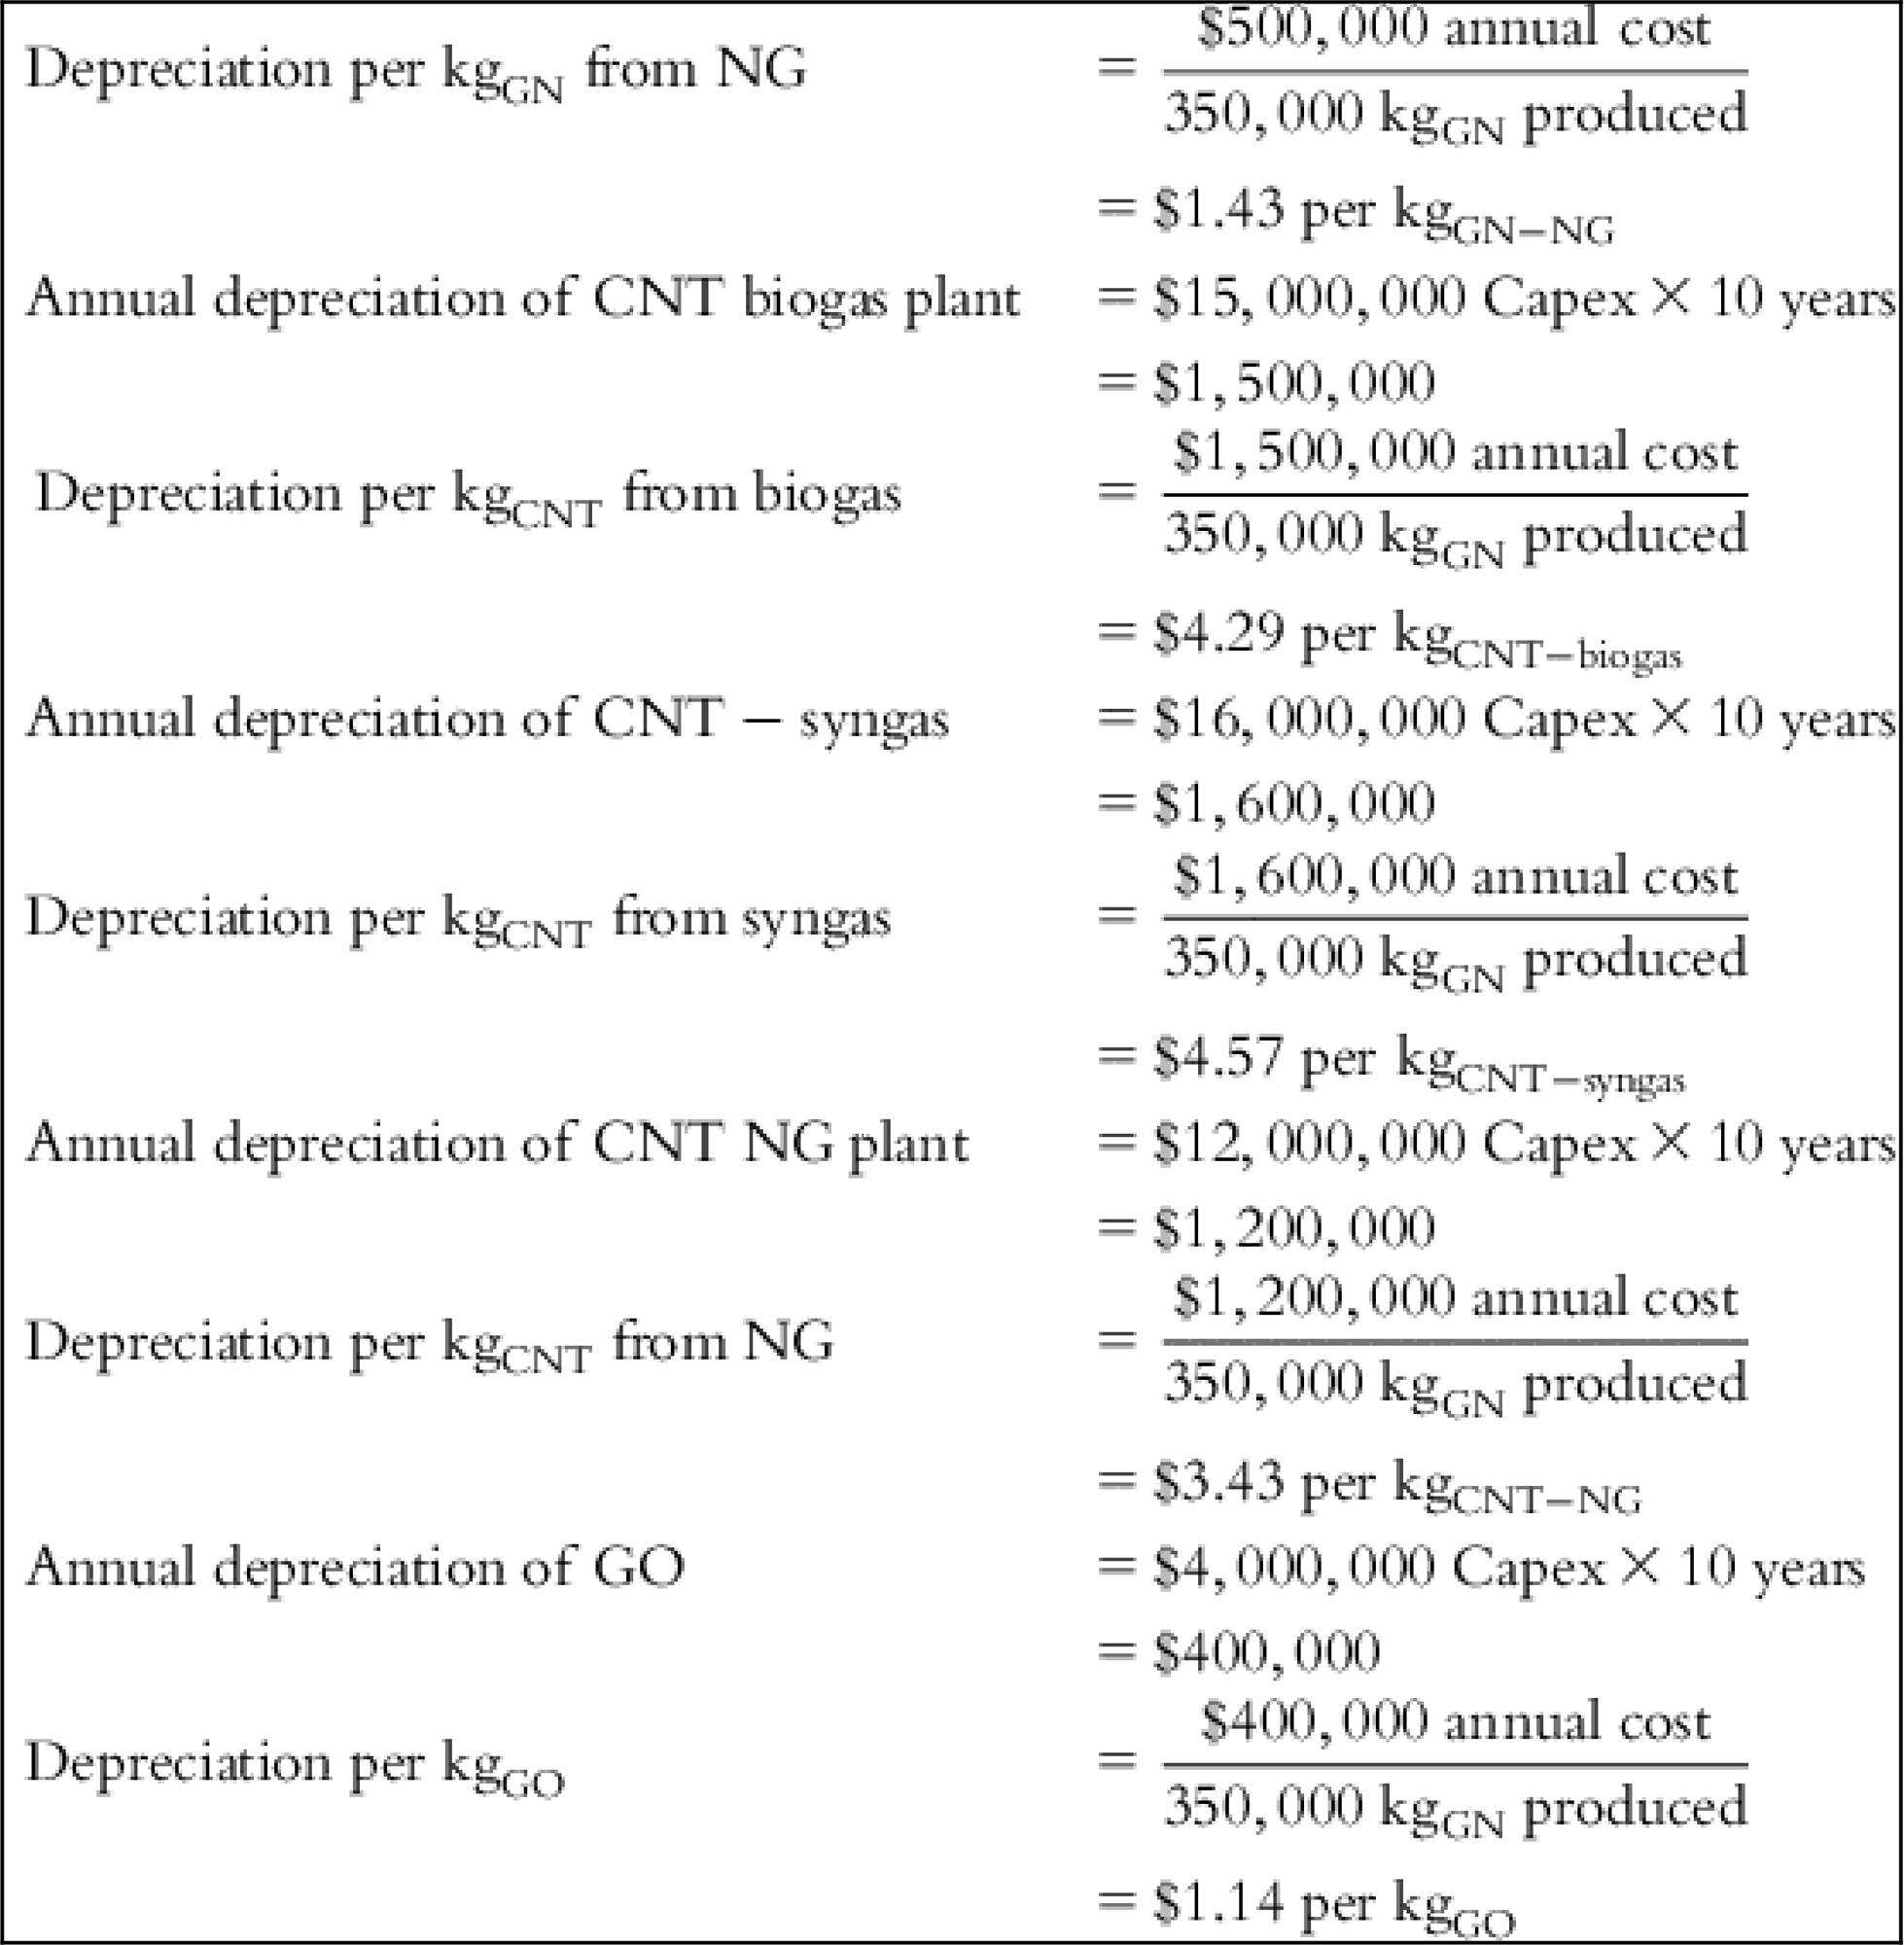
| Depreciation | $1.71 | $0.00 | $1.43 | $4.29 | $4.57 | $3.43 | $1.14 |
| Misc. overheads plant related | $1.23 | $1.23 | $1.33 | $4.89 | $4.89 | $5.11 | $5.49 |
| Total indirect operating costs | $7.67 | $6.40 | $7.13 | $19.54 | $20.24 | $17.74 | $12.65 |
| Total cost to Mfr. per kgproduct | $19.94 | $18.73 | $20.40 | $68.40 | $69.15 | $68.83 | $67.54 |
| Estimating OEM (original equipment manufacturer) price | |||||||
| Mfr. typical net earnings | 15.00% | 15.00% | 15.00% | 15.00% | 15.00% | 15.00% | 15.00% |
| Effective corporate tax rate | 30.00% | 30.00% | 30.00% | 30.00% | 30.00% | 30.00% | 30.00% |
| Earnings before taxes (EBIT) (as % of revenue) | 50.00% | 50.00% | 50.00% | 50.00% | 50.00% | 50.00% | 50.00% |
| Total cost before depreciation | $18.23 | $18.73 | $18.97 | $64.11 | $64.58 | $65.40 | $66.40 |
| Earnings before depreciation (EBITDA) | $18.23 | $37.46 | $37.91 | $128.22 | $129.16 | $130.80 | $132.80 |
| Revenues (Cost + EBITDA) | $36.46 | $56.19 | $56.91 | $192.33 | $193.74 | $196.20 | $199.20 |
| Mfr. sale price to distributors | $36.46 | $41.46 | $40.80 | $136.80 | $138.30 | $137.66 | $135.00 |
| Distributor sale price to customer | $47.40 | $53.90 | $53.04 | $177.84 | $179.90 | $178.96 | $175.60 |
| Avg. price-per kgproduct | $51 | $179 | $176 | ||||

The input values and detailed calculations of the tabulated costs in Table 5.1 are presented at the end of this chapter.
Table 5.1 lists the values of individual cost components and final cost per Kg of each material for several feed source options.
• Manufacturing GN with LFG as the carbon source.
• Manufacturing GN with AD biogas as a carbon source.
• Manufacturing GN with natural gas, including purification required and losses to achieve a Methane Number of 100%.
• Manufacturing CNT with LFG as the carbon source.
• Manufacturing CNT with AD biogas as a carbon source.
• Manufacturing CNT with natural gas, including purification required and losses to achieve a Methane Number of 100%.
5.4 Making Graphene
Let’s look at what it would cost to make graphene, now that we know what GO costs per Kg. Synthesizing large volumes of graphene requires GO or some other form of graphitic nanomaterial. Graphene was first isolated and studied by a mechanical “peeling” of graphite using an adhesive tape. Graphene layers up to a few millimeter in size can be produced by peeling. This technique is currently (and likely to remain) the source for the small demand of basic research. Publications describe new methods of large-area graphite synthesis, including CVD and direct growth on catalysts [185–192]. This method is not practical for large-volume production. The most widely referenced method of synthesizing graphene flakes is via reduction of GO made from flake graphite. A case can be made for GN to be the starting material for synthesizing graphene. Ribbon-type GN would be the best candidates for exfoliation to graphene. The basal planes would stay pristine, and 1 to 10-µm graphene flakes could be synthesized. Exfoliation techniques are worth a look from a cost perspective for ribbon-type GN to graphene. A cursory look at the costs associated with exfoliation to obtain graphene is given below.
5.4.1 Sonication
Ultrasonication is used extensively in research labs. As the name implies, acoustic energy replaces thermal, electrical, and other energy forms. The process is also used for emulsification of immiscible liquids to provide energy for homogeneous chemical reactions and some other niche applications. It can be used in providing the energy required to overcome the van der Waals forces and cleave expanded graphitic plates into single-layer single crystal type graphene particles. Ultrasound has been used to exfoliate expanded graphite (EG) flakes in water, solvents, and surfactants [193–195]. If we consider using functionalized GN in aqueous solution or as-produced in surfactant solutions, rather than using graphite flakes, we could gain some benefits that GN offer over graphite flakes: (1) Consistent characteristics for each graphene plane. (2) Higher purity. (3) Higher crystallinity. Using GN in place of graphite flakes could provide better-quality graphene particles with better yields. The length of the ribbon-type GN would dictate the size of the graphene flakes. These advantages would come at the cost of a slightly higher energy consumption since GN would not be “expanded” as most GO-treated graphite flakes are, and the entire VdW force would have to be overcome.
For cost calculations, unfortunately, Refs. [193–195] do not extrapolate the power consumption of this technique per unit mass, nor do they specify cost of other materials. Six hundred watts of ultrasonic power was used for 5 minutes to exfoliate 1 g of EG to “20-layer” graphene flakes, which the authors term FLG (few-layer graphene) [193]. The two-step process also requires heating the EG to 1100°C prior to sonication. It is not clear how the authors acquired EG, or what process was used. On a manufacturer’s website (Hielscher), some estimates of volume processed per day per KW of sonic power are given for graphene concentrations of 1–0.001%. In fact, most other references I have read on the use of ultrasonics for exfoliation of graphene plates also use very dilute solutions of either GO or graphite suspensions to evaluate the ability of ultrasound to exfoliate. In Table 5.2, I have tried to extrapolate the values buried in the texts. The table also lists if the experiments were done on graphite flakes GO (sometimes referred to as EG). These costs may seem high due to the small amounts of graphene recovered in the experiments. But the concentrations used must be modified to adjust these costs.
Table 5.2
Derivation of direct costs for exfoliation by sonication
| References | Grams graphene recovered | Power (KW-h) | Solvent (mL) | Total power ($) | Total solvent ($) | Cost per kgproduct ($) |
| [198] | 2.0 from graphite | 9.00 | 700 | 0.90 | 1.40 | 1150 |
| [193] | 2.3 from graphite | 17.63 | 700 | 1.77 | 1.40 | 1378 |
| [201] | 1.3 from graphite | 1 | 1000 | 0.10 | 1.0 | 846 |

1. Electrical power to ultrasound energy conversion has been assumed to be 60% [197].
2. Cost of electricity is assumed to be US$0.10 per KW-h.
3. Cost of solvents is assumed to be US$2 per kg with a specific gravity ~1.0.
5.4.2 Supercritical carbon dioxide
Another method for a non-GO route exfoliation is by using supercritical carbon dioxide [196]. In its critical phase, CO2 behaves neither like a liquid nor a gas (see Fig. 5.3). ScCO2 has a surface tension that is an order of magnitude lower than propane, and a very low viscosity. It penetrates tiny pores or cracks and mixes readily with oils. These qualities result in unique solvent-like qualities. ScCO2 has been used widely for extraction of oils, enhanced oil recovery, etc. Once the material to be extracted is dissolved in the ScCO2, the pressure and/or temperature conditions are changed, at which point the CO2 releases as a gas, and the solvate can be recovered. Again, by avoiding the GO route, intercalation and exfoliation by ScCO2 has the possibility of producing pristine graphene planes for graphite, or consistent sized platelets from ribbon-type GN. Li et al. [196] describe complete depressurization of the ScCO2 for the rapid exfoliation of the basal planes.
The process equipment for such a route on an industrial scale would be expensive though it has been used by the oil industry for decades now. High-pressure vessels, multistage compressors with heat removal between stages, loss of ScCO2 due to maintenance of gas seals, special material requirements for O-rings to resist explosive decompression (CO2 gets trapped in the materials), and last but not least, high-purity CO2 as a feedstock are some of the reasons. Power consumption on a large scale may be calculated by using atmospheric intake, and a 1800-psig discharge a three-stage compressor, and a power consumption cost at (US$0.10 per KW-h). This gives us an estimated electrical cost of ~$80 per kg. An analysis similar to the one we did on the GN and CNTs, with the proper equipment costs would give more accurate numbers. Further investigation with pilots should be carried out to find the actual numbers.
As is common knowledge, none of the above methods has been tested or implemented on a large-scale commercial exfoliation of graphite/graphene oxide.
5.5 Calculations for Table 5.1
Table 5.3
| Chemical | World commodity price | Small manufacturer’s price 50% higher |
| Cost/kg US$ | Cost/kg US$ | |
| Flake graphite | 10 | 15 |
| H2SO4 | 0.32 | 0.48 |
| KMnO4 (100%) | 2 | 3 |
| Na2O5S2 (100%) | 1.6 | 2.4 |
| NaOH (100%) | 0.5 | 0.75 |
| NaNO3 (100%) | 0.4 | 0.6 |
| NH3 (anhydrous) | 0.18 | 0.27 |
| HCl 31%— muriatic | 0.21 | 0.315 |
| HNO3 (16M) | 1.1 | 1.65 |
| Catalyst for GN | 600 | 900 |
| Hydrazine hydrate | 3 | 4.5 |
Table 5.4
| Other operating variables | Value | Unit |
| Unit cost of natural gas | 15 | $/MMBTU |
| Unit cost of natural gas treatment | 0.1 | $/nM3 |
| Unit cost biogas treatment | 0.25 | $/nM3 |
| Conversion rates | 35 | % |
| Selectivity to CNT | 35 | % |
| Selectivity to GN | 90 | % |
| CH4 content in biogas | 50 | % |
| Bulk density flake graphite | 0.667 | g/cc |
| Bulk density CNT and GN | 0.300 | g/cc |
| Unpurified product | 300 | g/gcatalyst |
| Plant capacity | 50 | kg/h |
| Plant capacity | 1000 | kg/day |
| Operating hours | 20 | Per day |
| Days/year | 350 | Days |
| Capacity | 350,000 | kg/year |
| Unit labor rate | 35 | $/h |
| Maintenance | 2 | % of capex/year |
| Cumulative mgmt. salaries | 500, 000 | US$/year |
| Payroll expenses | 12 | % of gross pay |
| Insurance | 3 | % of capex year |
| QC rejects | 5 | % (To give net plant cap). |
| Concentration of HCl | 3 | Normal |
| Concentration of NaOH used | 100 | % by weight |
| Concentration of HNO3 used | 16 | Molar |
| Concentration of H2SO4 used | 98 | % by weight |
| Baseline quantity of total carbon deposited | 300 | g/gcatalyst |
Table 5.5
| Financial factors | |
| Capex GN biogas | $6,000,000 |
| Capex GN syngas | $7,000,000 |
| Capex GN NG | $5,000,000 |
| Capex CNT biogas | $15,000,000 |
| Capex CNT syngas | $16,000,000 |
| Capex CNT NG | $12,000,000 |
| Capex GO | $4,000,000 |
| Loan term | 84 months |
| Interest rate | 8% |
| Leverage | 70% |
| Depreciation | 10-year straight line |
Table 5.6
Prepurification quantity of product required to achieve desired output
| Weight of raw product required before purification to achieve rated capacity |
 |

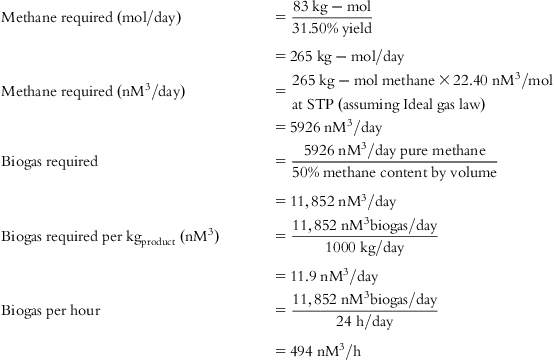
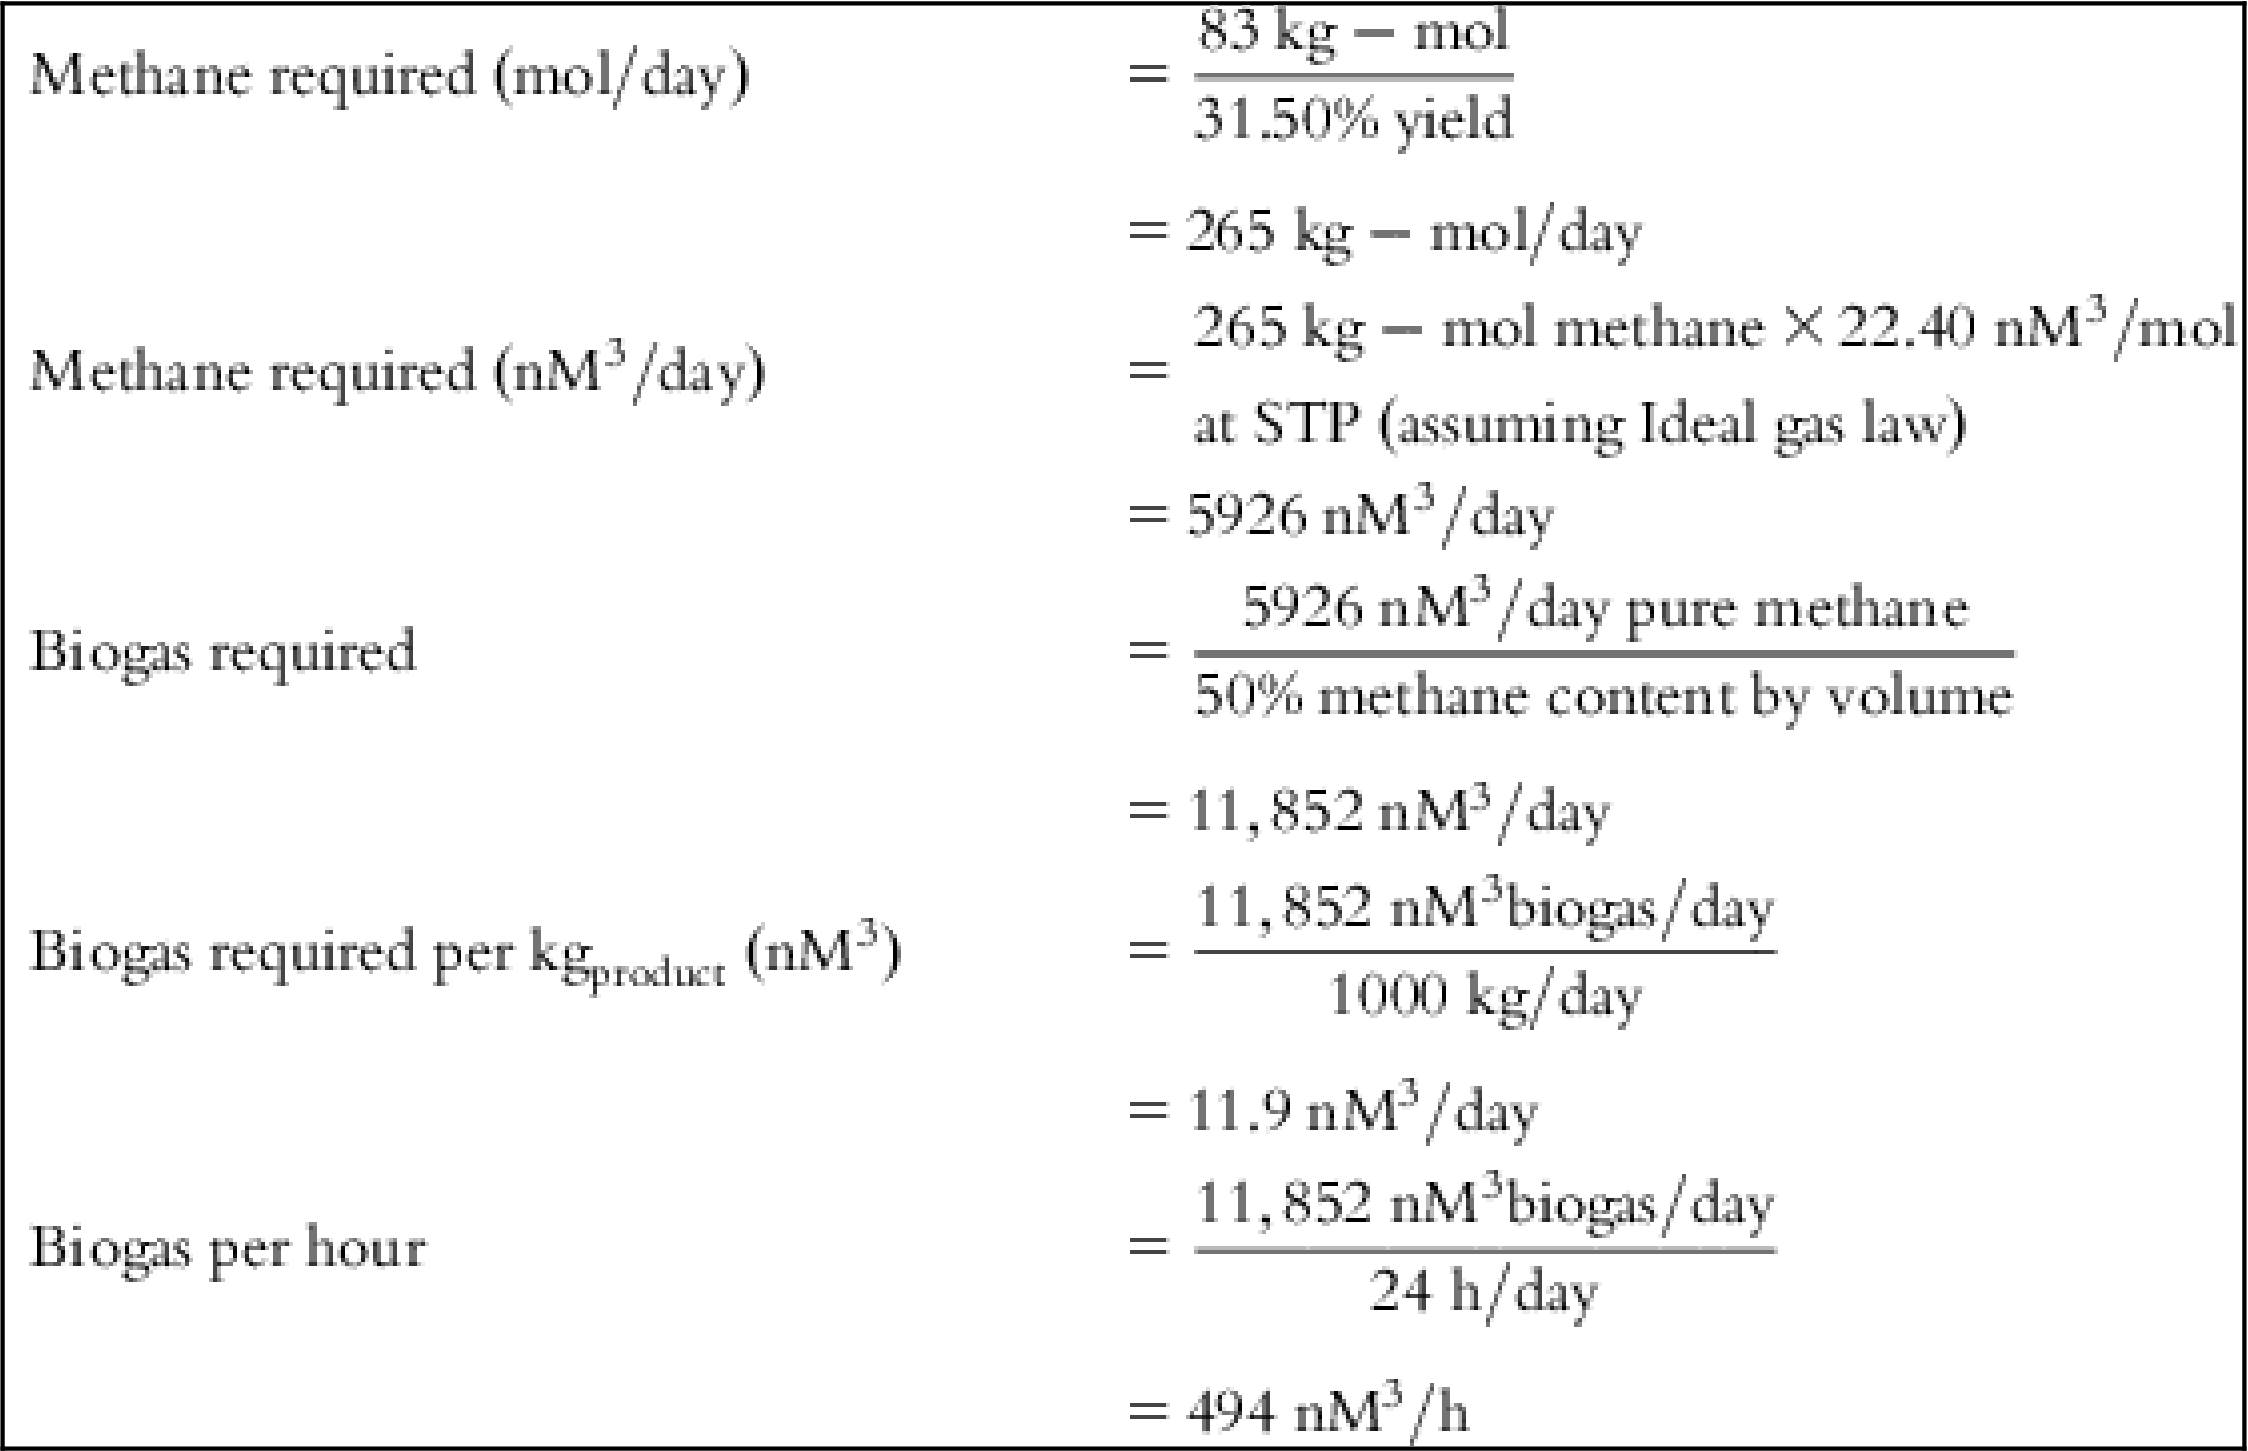
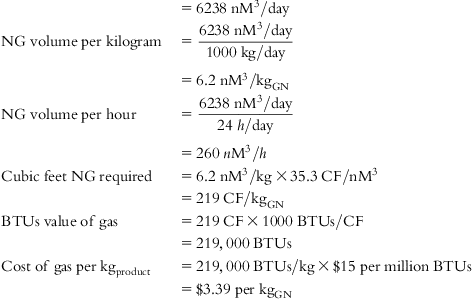
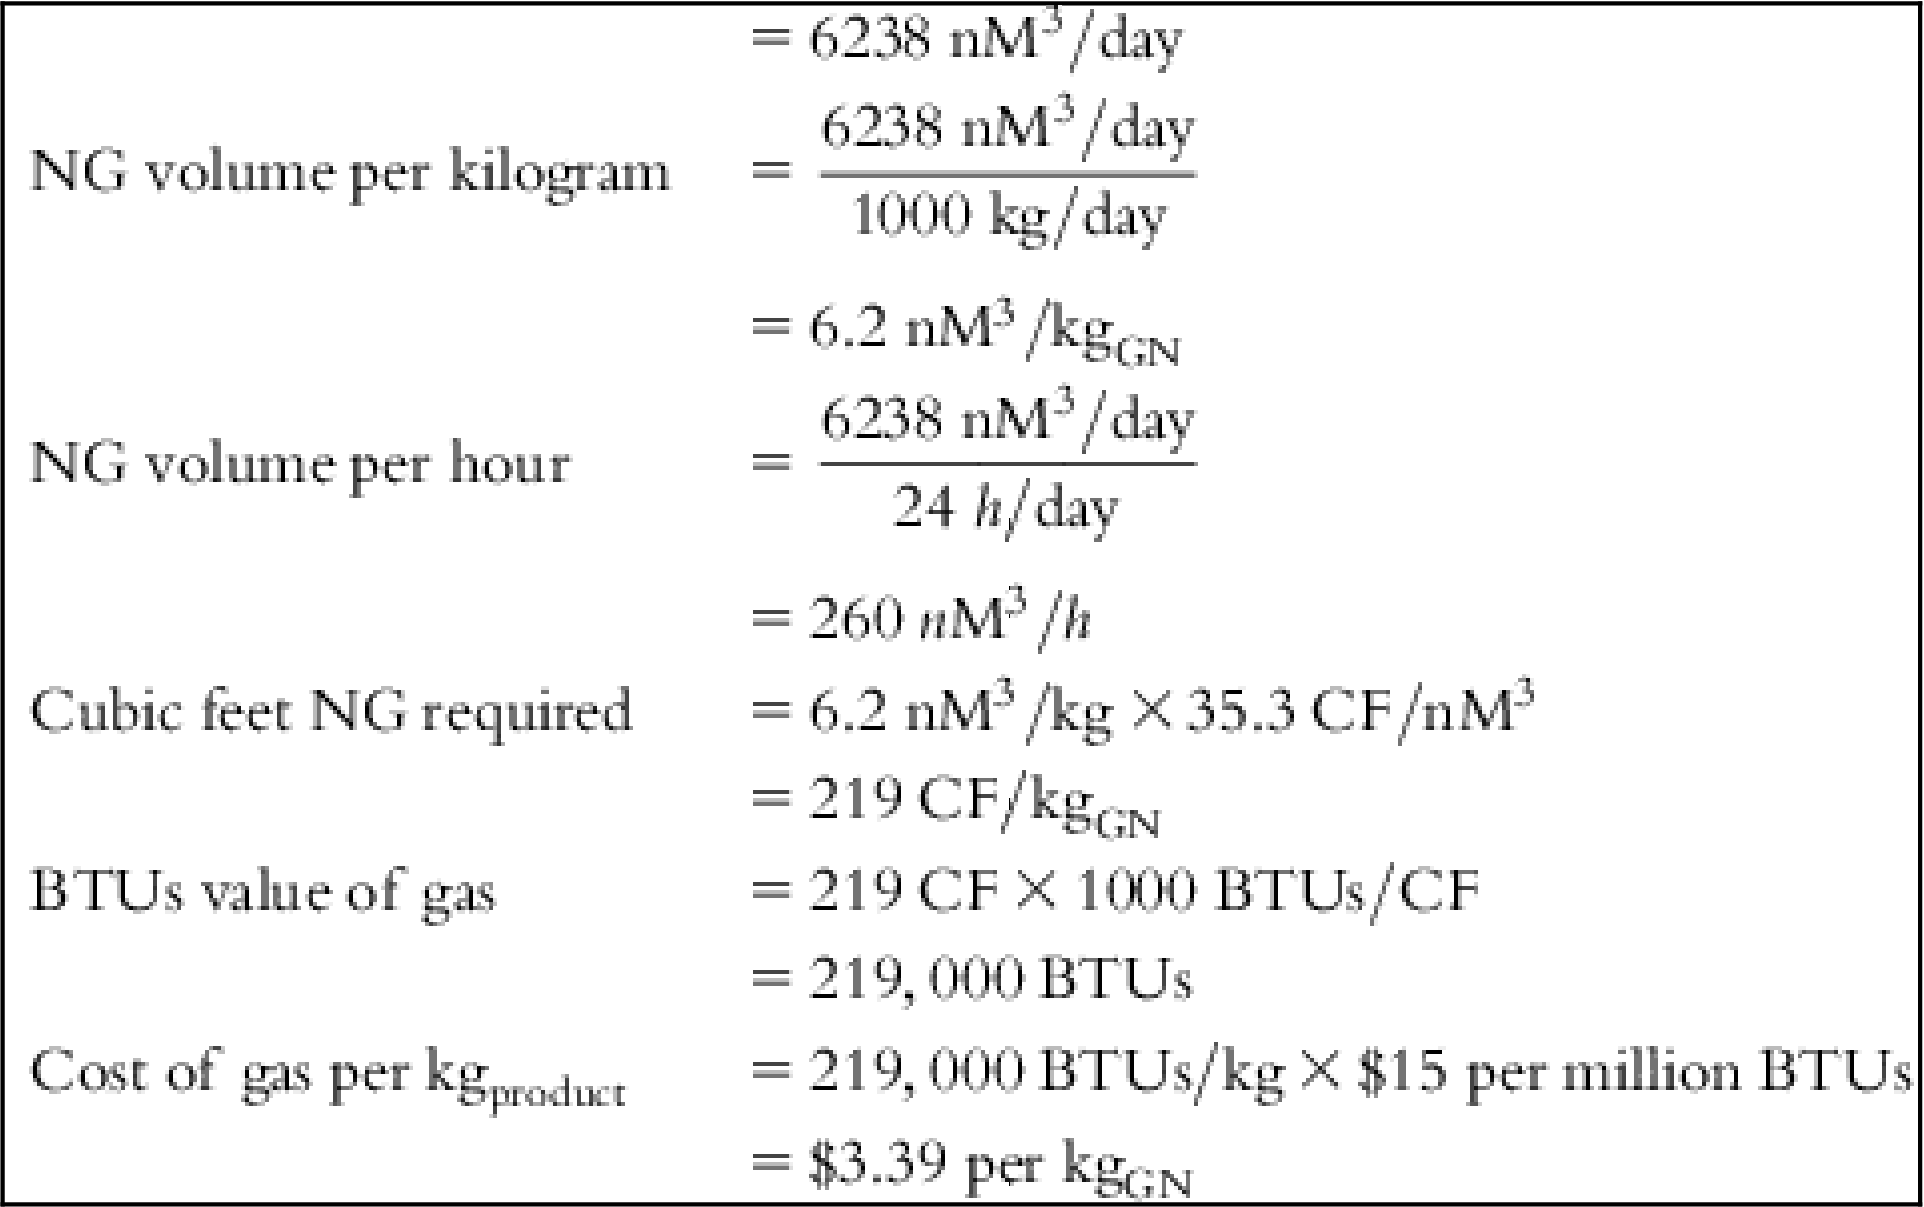
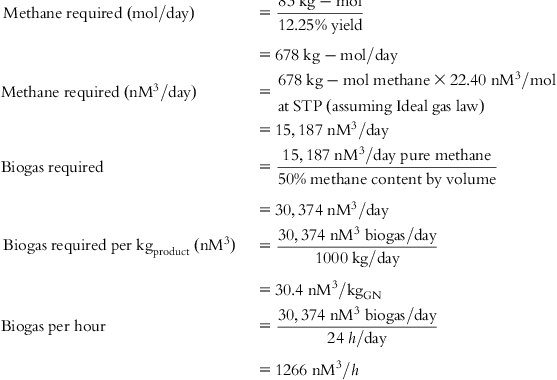

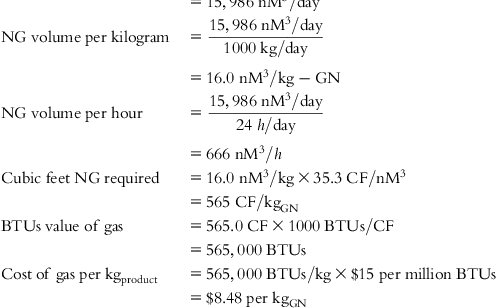


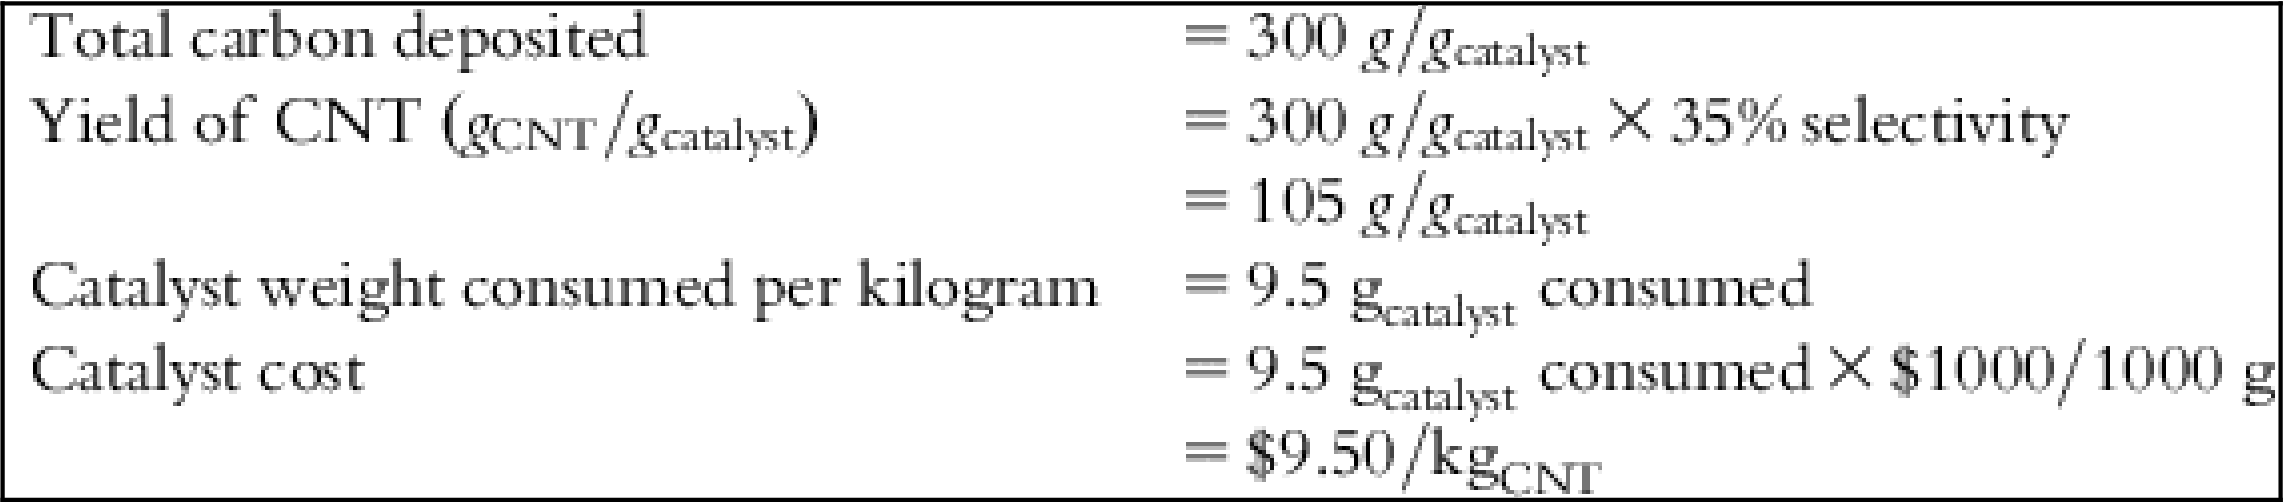
Table 5.13
Volume of acids for purification
| Volume of acids required to soak raw materials for purification—1 bed volume | |
| Bulk density of CNT-GN | 300 g/L |
| Weight per 1 m3—CNT-GN | 300 kg/m3 |
| Weight of produced material required to yield 1000 kgCNT-product | 2900 kg/day-CNT |
| Volume of HNO3 required for purification to achieve 1000 kgCNT-product | 9.67 m3 |
| Weight of produced material required to achieve 1000 kgGN-product | 1111 kg |
| Volume of HCl required to purify GN for 1000 kgproduct | 3.7 m3 |
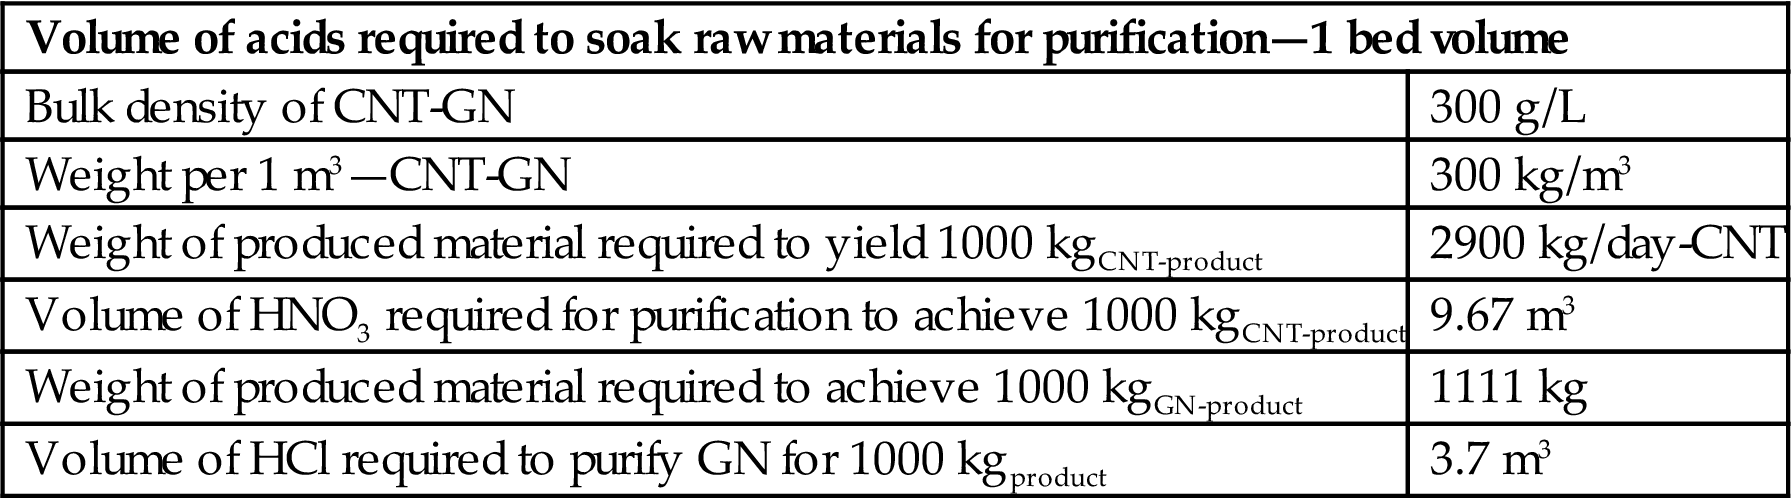
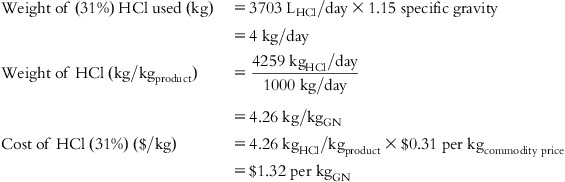
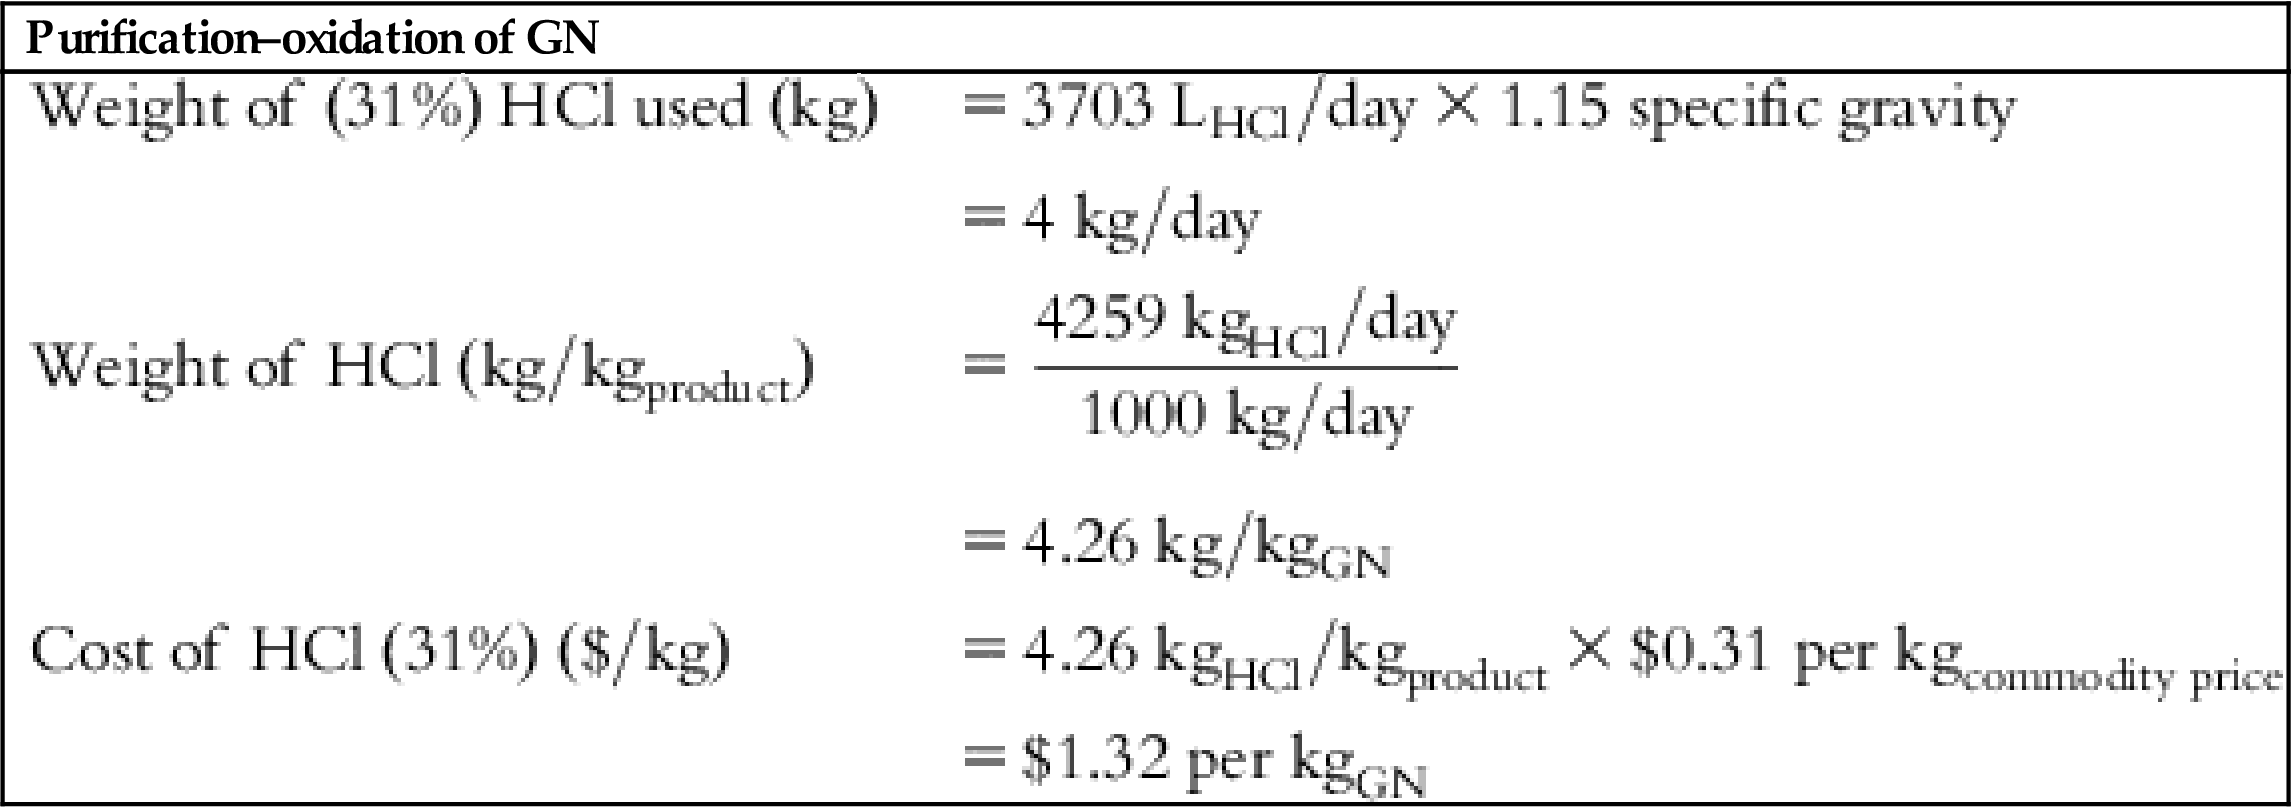

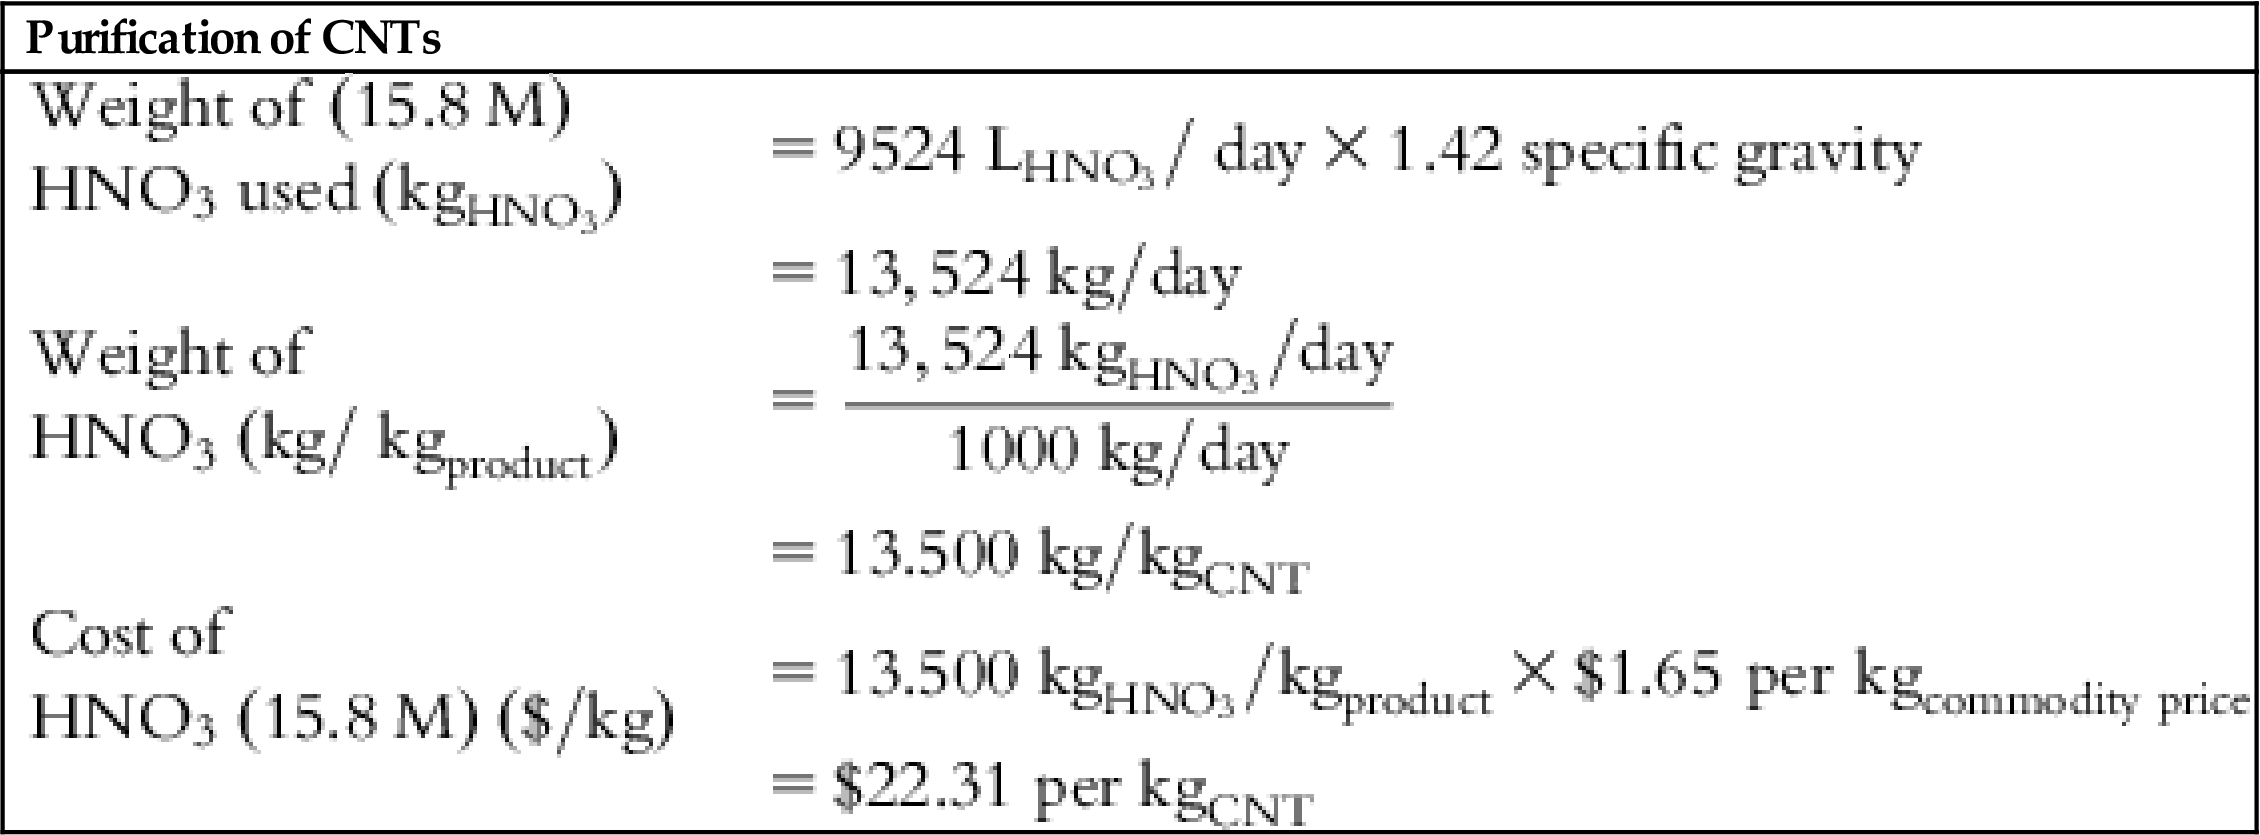
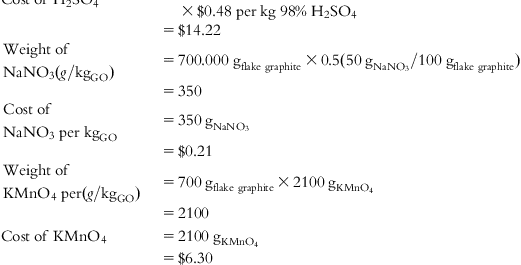

Table 5.17
Cost of wastewater treatment for GN purification
| Cost of NaOH to neutralize HCl used for GN purification |
 |

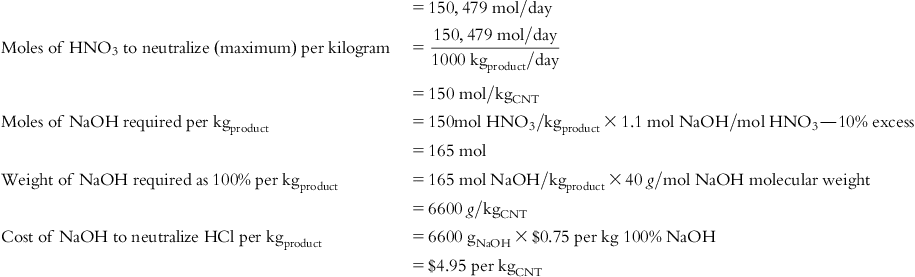
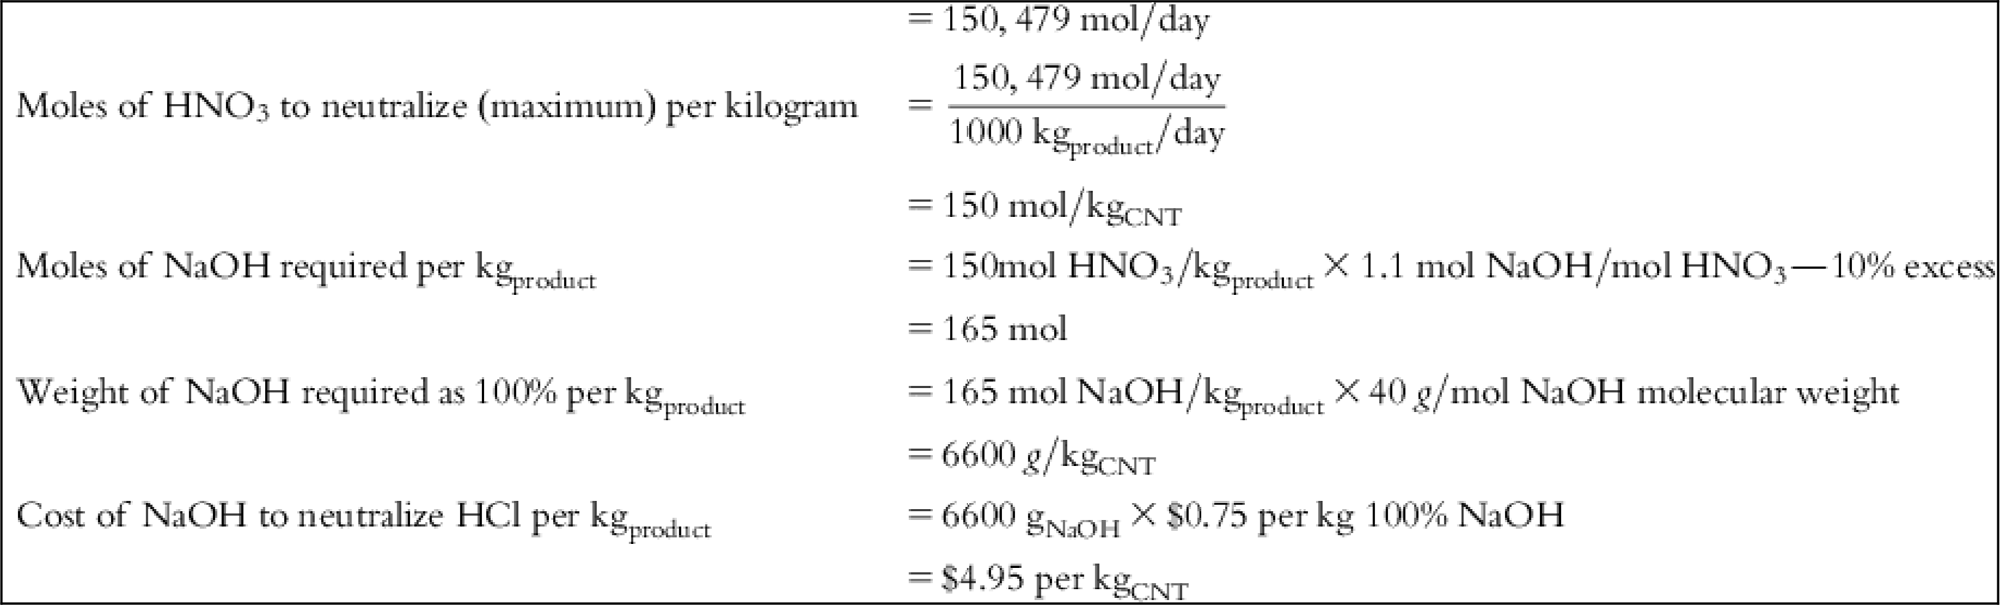
Table 5.19
Cost of wastewater treatment from GO synthesis
| Cost of NaOH required to neutralize H2SO4 used in GO synthesis |
 |