
CHAPTER 22
Advanced Reverse Engineering
In the previous chapter, we took a look at the basics of reverse engineering source code and binary files. Conducting reverse engineering with full access to the way in which an application works (regardless of whether this is a source view or a binary view) is called white box testing. In this chapter, we take a look at alternative methodologies, often termed black box testing and gray box testing; both require running the application that we are analyzing. In black box testing, you know no details of the inner workings of the application, whereas in gray box testing, you combine white box and black box techniques and, for example, run the application under the control of a debugger. The intent of these methodologies is to observe how the application responds to various input stimuli.
In this chapter, you’ll learn about the tools and techniques used for runtime detection of potentially exploitable conditions in software, including how to generate interesting input values and how to analyze the behaviors that those inputs elicit from the programs you are testing. This chapter covers the following topics:
• Why try to break software?
• Overview of the software development process
• Instrumentation tools
• Fuzzing
• Instrumented fuzzing tools and techniques
Why Try to Break Software?
In the computer security world, debate always rages as to the usefulness of vulnerability research and discovery. Other chapters in this book discuss some of the ethical issues involved, but in this chapter we will attempt to stick to practical reasons for trying to break software. Consider the following facts:
• There is no regulatory agency for software reliability.
• Virtually no software is guaranteed to be free from defects.
• Most end-user license agreements (EULAs) require the user of a piece of software to hold the author of the software free from blame for any damage caused by the software.
Given these circumstances, who is to blame when a computer system is broken into because of a newly discovered vulnerability in an application or the operating system that happens to be running on that computer? Arguments are made either way, blaming the vendor for creating the vulnerable software in the first place, or blaming the user for failing to quickly patch or otherwise mitigate the problem. The fact is, given the current state of the art in intrusion detection, users can only defend against known threats. This leaves passive users to rely completely on ethical security researchers to discover vulnerabilities and report them and on vendors to develop patches for those vulnerabilities before they are discovered and exploited in a malicious fashion. The most aggressive sysadmin whose systems always have the latest patches applied will always be at the mercy of those who possess zero-day exploits. Vendors can’t develop patches for problems that they are unaware of or refuse to acknowledge (which defines the nature of a zero-day exploit).
If you believe that vendors will discover every problem in their software before others do, and you believe that those vendors will release patches for those problems in an expeditious manner, then this chapter is probably not for you. This chapter (and others in this book) is for those people who want to take at least some measure of control in ensuring that their software is as secure as possible.
Overview of the Software Development Process
We will avoid any in-depth discussion of how software is developed, and instead encourage you to seek out a textbook on software engineering practices. In many cases, software is developed by some orderly, perhaps iterative, progression through the following activities:
• Requirements analysis Determining what the software needs to do
• Design Planning out the pieces of the program and considering how they will interact
• Implementation Expressing the design in software source code
• Testing Ensuring that the implementation meets the requirements
• Operation and support Deploying the software to end users and supporting the product in end-user hands
Problems generally creep into the software during any of the first three phases. These problems may or may not be caught in the testing phase. Unfortunately, those problems that are not caught in testing are destined to manifest themselves after the software is already in operation. Many developers want to see their code operational as soon as possible and put off doing proper error checking until after the fact. While they usually intend to return and implement proper error checks once they can get some piece of code working properly, all too often they forget to return and fill in the missing error checks. The typical end user has influence over the software only in its operational phase. A security conscious end user should always assume that there are problems that have avoided detection all the way through the testing phase. Without access to source code and without resorting to reverse engineering program binaries, end users are left with little choice but to develop interesting test cases and to determine whether programs are capable of securely handling these test cases. A tremendous number of software bugs are found simply because a user provided unexpected input to a program. One method of testing software involves exposing the software to large numbers of unusual input cases. This process is often termed stress testing when performed by the software developer. When performed by a vulnerability researcher, it is usually called fuzzing. The difference in the two is that the software developer has a far better idea of how he expects the software to respond than the vulnerability researcher, who is often hoping to simply record something anomalous.
Fuzzing is one of the main techniques used in black/gray box testing. To fuzz effectively, two types of tools are required, instrumentation tools and fuzzing tools. Instrumentation tools are used to pinpoint problem areas in programs either at runtime or during post-crash analysis. Fuzzing tools are used to automatically generate large numbers of interesting input cases and feed them to programs. If an input case can be found that causes a program to crash, you make use of one or more instrumentation tools to attempt to isolate the problem and determine whether it is exploitable.
Instrumentation Tools
Thorough testing of software is a difficult proposition at best. The challenge to the tester is to ensure that all code paths behave predictably under all input cases. To do this, test cases must be developed that force the program to execute all possible instructions within the program. Assuming the program contains error handling code, these tests must include exceptional cases that cause execution to pass to each error handler. Failure to perform any error checking at all and failure to test every code path are just two of the problems that attackers may take advantage of. Murphy’s Law assures us that it will be the one section of code that was untested that will be the one that is exploitable.
Without proper instrumentation, determining why a program has failed will be difficult, if not impossible. When source code is available, it may be possible to insert “debugging” statements to paint a picture of what is happening within a program at any given moment. In such a case, the program itself is being instrumented and you can turn on as much or as little detail as you choose. When all that is available is a compiled binary, it is not possible to insert instrumentation into the program itself. Instead, you must make use of tools that hook into the binary in various ways in your attempt to learn as much as possible about how the binary behaves. In searching for potential vulnerabilities, it would be ideal to use tools that are capable of reporting anomalous events, because the last thing you want to do is sort through mounds of data indicating that a program is running normally. We will cover several types of software testing tools and discuss their applicability to vulnerability discovery. The following classes of tools will be reviewed:
• Debuggers
• Code coverage analysis tools
• Profiling tools
• Flow analysis tools
• Memory use monitoring tools
Debuggers
Debuggers provide fine-grain control over an executing program and can require a fair amount of operator interaction. During the software development process, they are most often used for isolating specific problems rather than for large-scale automated testing. When you use a debugger for vulnerability discovery, however, you take advantage of the debugger’s ability to both signal the occurrence of an exception and provide a precise snapshot of a program’s state at the moment it crashes. During black box testing, it is useful to launch programs under the control of a debugger prior to any fault injection attempts. If a black box input can be generated to trigger a program exception, detailed analysis of the CPU registers and memory contents captured by the debugger makes it possible to understand what avenues of exploitation might be available as a result of a crash.
The use of debuggers needs to be well thought out. Threaded programs and programs that fork can be difficult for debuggers to follow.

NOTE
A fork operation creates a second copy, including all state, variable, and open file information, of a process. Following the fork, two identical processes exist, distinguishable only by their process IDs. The forking process is termed the parent and the newly forked process is termed the child. The parent and child processes continue execution independently of each other.
Following a fork operation, you must decide whether to follow and debug the child process or to stick with and continue debugging the parent process. Obviously, if you choose the wrong process, you may completely fail to observe an exploitable opportunity in the opposing process. For processes that are known to fork, it is occasionally an option to launch the process in nonforking mode. This option should be considered if black box testing is to be performed on such an application. When forking cannot be prevented, a thorough understanding of the capabilities of your debugger is a must. For some operating system/debugger combinations, it is not possible for the debugger to follow a child process after a fork operation. If it is the child process you are interested in testing, some way of attaching to the child after the fork has occurred is required.
NOTE
The act of attaching a debugger to a process refers to using a debugger to latch onto a process that is already running. This is different from the common operation of launching a process under debugger control. When a debugger attaches to a process, the process is paused and will not resume execution until a user instructs the debugger to do so.
When using a GUI-based debugger, attaching to a process is usually accomplished via a menu option (such as File | Attach) that presents a list of currently executing processes. Console-based debuggers, on the other hand, usually offer an attach command that requires a process ID (PID) obtained from a process-listing command such as ps.
In the case of network servers, it is common to fork immediately after accepting a new client connection in order to allow a child process to handle the new connection while the parent continues to accept additional connection requests. By delaying any data transmission to the newly forked child, you can take the time to learn the PID of the new child and attach to it with a debugger. Once you have attached to the child, you can allow the client to continue its normal operation (usually fault injection in this case), and the debugger will catch any problems that occur in the child process rather than the parent. The GNU debugger, gdb, has an option named follow-fork-mode designed for just this situation. Under gdb, follow-fork-mode can be set to parent, child, or ask, such that gdb will stay with the parent, follow the child, or ask the user what to do when a fork occurs.
NOTE
gdb’s follow-fork-mode option is not available on all architectures.
Another useful feature available in some debuggers is the ability to analyze a core dump file. A core dump is simply a snapshot of a process’s state, including memory contents and CPU register values, at the time an exception occurs in a process. Core dumps are generated by some operating systems when a process terminates as a result of an unhandled exception such as an invalid memory reference. Core dumps are particularly useful when attaching to a process is difficult to accomplish. If the process can be made to crash, you can examine the core dump file and obtain all of the same information you would have gotten had you been attached to the process with a debugger at the moment it crashed. Core dumps may be limited in size on some systems (they can take up quite a bit of space), and may not appear at all if the size limit is set to zero. Commands to enable the generation of core files vary from system to system. On a Linux system, using the bash shell, the command to enable core dumps looks like this:
# ulimit -c unlimited
The last consideration for debuggers is that of kernel-level debugging versus user space debugging. When performing black box testing of user space applications, which includes most network server software, user space debuggers usually provide adequate monitoring capabilities. OllyDbg, written by Oleh Yuschuk, and WinDbg, available from Microsoft, are two user space debuggers for the Microsoft Windows family of operating systems. gdb is the principle user space debugger for Unix/Linux operating systems.
To monitor kernel-level software such as device drivers, kernel-level debuggers are required. Unfortunately, in the Linux world at least, kernel-level debugging tools are not terribly sophisticated at the moment. On the Windows side, Microsoft’s WinDbg has become the kernel-level debugger of choice following the demise of Compuware’s SoftICE product.
Code Coverage Analysis Tools
Code coverage tools give developers an idea of what portions of their programs are actually getting executed. Such tools are excellent aids for test case development. Given results that show what sections of code have and have not been executed, additional test cases can be designed to cause execution to reach larger and larger percentages of the program. Unfortunately, code coverage tools are generally more useful to the software developer than to the vulnerability researcher. They can point out the fact that you have or have not reached a particular section of code, but indicate nothing about the correctness of that code. Further complicating matters, commercial code coverage tools often integrate into the compilation phase of program development. This is obviously a problem if you are conducting black box analysis of a binary program, as you will not be in possession of the original source code.
There are two principal cases in which code coverage tools can assist in exploit development. One case arises when a researcher has located a vulnerability by some other means and wishes to understand exactly how that vulnerability can be triggered by understanding how data flows through the program. The second case is in conjunction with fuzzing tools to understand what percentage of an application has been reached via generated fuzzing inputs. In the second case, the fuzzing process can be tuned to attempt to reach code that is not getting executed initially. Here the code coverage tool becomes an essential feedback tool used to evaluate the effectiveness of the fuzzing effort.
Pedram Amini’s Process Stalker is a powerful, freely available code coverage tool designed to perform in the black box testing environment. Process Stalker consists of two principal components and some post-processing utilities. The heart of Process Stalker is its tracing module, which requires a list of breakpoints and the name or PID of a process to stalk as input. Breakpoint lists are currently generated using an IDA Pro plug-in module that extracts the block structure of the program from an IDA Pro disassembly and generates a list of addresses that represent the first instruction in each basic block within the program. At the same time, the plug-in generates GML (Graph Modeling Language) files to represent each function in the target program. These graph files form the basis of Process Stalker’s visualization capabilities when they are combined with runtime information gathered by the tracer. (As an aside, these graph files can be used with third-party graphing tools such as GDE Community Edition from www.oreas.com to provide an alternative to IDA Pro’s built-in graphing capabilities.)
The tracer is then used to attach to or launch the desired process, and it sets breakpoints according to the breakpoint list. Once breakpoints have been set, the tracer allows the target program to continue execution and the tracer makes note of all breakpoints that are hit. The tracer can optionally clear each breakpoint when the breakpoint is hit for the first time in order to realize a tremendous speedup. Recall that the goal of code coverage is to determine whether all branches have been reached, not necessarily to count the number of times they have been reached. To count the number of times an instruction has been executed, breakpoints must remain in place for the lifetime of the program. Setting breakpoints on every instruction in a program would be very costly from a performance perspective. To reduce the amount of overhead required, Process Stalker, like BinDiff, leverages the concept of a basic block of code. When setting breakpoints, it is sufficient to set a breakpoint only on the first instruction of each basic block, since a fundamental property of basic blocks is that once the first instruction in a block is hit, all remaining instructions in the block are guaranteed to be executed in order. As the target program runs under the tracer’s control, the tracer logs each breakpoint that is hit and immediately resumes execution of the target program. A simple example of determining the PID of a Windows process and running a trace on it in Process Stalker is shown here:
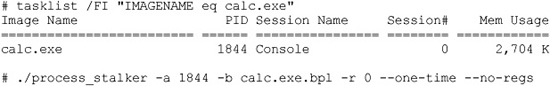
For brevity, the console output of process_stalker is omitted. The example shows how a PID might be obtained, using the Windows tasklist command, and then passed to the process_stalker command to initiate a trace. The process_stalker command expects to be told the name of a breakpoint list, calc.exe.bpl in this case, which was previously generated using the IDA Pro plug-in component of Process Stalker. Once a trace is complete, the post-processing utilities (a set of Python scripts) are used to process and merge the trace results to yield graphs annotated with the gathered trace data.
Profiling Tools
Profiling tools are used to develop statistics about how much time a program spends in various sections of code. This might include information on how frequently a particular function is called, and how much execution time is spent in various functions or loops. Developers utilize this information in an attempt to improve the performance of their programs. The basic idea is that performance can be visibly improved by making the most commonly used portions of code very fast. Like code coverage tools, profiling tools may not be of tremendous use in locating vulnerabilities in software. Exploit developers care little whether a particular program is fast or slow; they care simply whether the program can be exploited.
Flow Analysis Tools
Flow analysis tools assist in understanding the flow of control or data within a program. Flow analysis tools can be run against source code or binary code, and often generate various types of graphs to assist in visualizing how the portions of a program interact. IDA Pro offers control flow visualization through its graphing capabilities. The graphs that IDA Pro generates are depictions of all the cross-referencing information that IDA Pro develops as it analyzes a binary. Figure 22-1 shows a function call tree generated by IDA Pro for a very simple program using IDA Pro’s Xrefs From (cross-references from) menu option. In this case, we see all the functions referenced from a function named sub_804882F, and the graph answers the question, “Where do we go from here?” To generate such a display, IDA Pro performs a recursive descent through all functions called by sub_804882F.

Figure 22-1 Function call tree for function sub_804882F
Graphs such as that in Figure 22-1 generally terminate at library or system calls for which IDA Pro has no additional information.
Another useful graph that IDA Pro can generate comes from the Xrefs To option. Cross-references to a function lead us to the points at which a function is called and answers the question, “How did we get here?” Figure 22-2 is an example of the cross-references to the function send() in a simple program. The display reveals the most likely points of origin for data that will be passed into the send() function (should that function ever get called).
Graphs such as that in Figure 22-2 often ascend all the way up to the entry point of a program.
A third type of graph available in IDA Pro is the function flowchart graph. As shown in Figure 22-3, the function flowchart graph provides a much more detailed look at the flow of control within a specific function.

Figure 22-2 Cross-references to the send function

Figure 22-3 IDA Pro-generated flowchart for sub_80487EB
One shortcoming of IDA Pro’s graphing functionality is that many of the graphs it generates are static, meaning that they can’t be manipulated, and thus they can’t be saved for viewing with third-party graphing applications. This shortcoming is addressed by BinNavi (discussed in Chapter 20) and to some extent Process Stalker.
The preceding examples demonstrate control flow analysis. Another form of flow analysis examines the ways in which data transits a program. Reverse data tracking attempts to locate the origin of a piece of data. This is useful in determining the source of data supplied to a vulnerable function. Forward data tracking attempts to track data from its point of origin to the locations in which it is used. Unfortunately, static analysis of data through conditional and looping code paths is a difficult task at best.
Memory Use Monitoring Tools
Some of the most useful tools for black box testing are those that monitor the way that a program uses memory at runtime. Memory monitoring tools can detect the following types of errors:
• Access of uninitialized memory
• Access outside of allocated memory areas
• Memory leaks
• Multiple release (freeing) of memory blocks

CAUTION
Dynamic memory allocation takes place in a program’s heap space. Programs should return all dynamically allocated memory to the heap manager at some point. When a program loses track of a memory block by modifying the last pointer reference to that block, it no longer has the ability to return that block to the heap manager. This inability to free an allocated block is called a memory leak. While memory leaks may not lead directly to exploitable conditions, the leaking of a sufficient amount of memory can exhaust the memory available in the program heap. At a minimum, this will generally result in some form of denial of service. Dynamic memory allocation takes place in a program’s heap space. Programs should return all dynamically allocated memory to the heap manager at some point. When a program loses track of a memory block by modifying the last pointer reference to that block, it no longer has the ability to return that block to the heap manager. This inability to free an allocated block is called a memory leak.
Each of these types of memory problems has been known to cause various vulnerable conditions from program crashes to remote code execution.
Valgrind
Valgrind is an open source memory debugging and profiling system for Linux x86 program binaries. Valgrind can be used with any compiled x86 binary; no source code is required. It is essentially an instrumented x86 interpreter that carefully tracks memory accesses performed by the program being interpreted. Basic Valgrind analysis is performed from the command line by invoking the valgrind wrapper and naming the binary that it should execute. To use Valgrind with the following example,
/*
* valgrind_1.c - uninitialized memory access
*/
int main() {
int p, t;
if (p == 5) { /*Error occurs here*/
t = p + 1;
}
return 0;
}
you simply compile the code and then invoke Valgrind as follows:
# gcc –o valgrind_1 valgrind_1.c
# valgrind ./valgrind_1
Valgrind runs the program and displays memory use information as shown here:
==16541== Memcheck, a.k.a. Valgrind, a memory error detector for x86-linux.
==16541== Copyright (C) 2002-2003, and GNU GPL'd, by Julian Seward.
==16541== Using valgrind-2.0.0, a program supervision framework for x86-linux.
==16541== Copyright (C) 2000-2003, and GNU GPL'd, by Julian Seward.
==16541== Estimated CPU clock rate is 3079 MHz
==16541== For more details, rerun with: -v
==16541==
==16541== Conditional jump or move depends on uninitialised value(s)
==16541== at 0x8048328: main (in valgrind_1)
==16541== by 0xB3ABBE: __libc_start_main (in /lib/libc-2.3.2.so)
==16541== by 0x8048284: (within valgrind_1)
==16541==
==16541== ERROR SUMMARY: 1 errors from 1 contexts (suppressed: 0 from 0)
==16541== malloc/free: in use at exit: 0 bytes in 0 blocks.
==16541== malloc/free: 0 allocs, 0 frees, 0 bytes allocated.
==16541== For a detailed leak analysis, rerun with: --leak-check=yes
==16541== For counts of detected errors, rerun with: -v
In the example output, the number 16541 in the left margin is the PID of the Valgrind process. The first line of output explains that Valgrind is making use of its memcheck tool to perform its most complete analysis of memory use. Following the copyright notice, you see the single error message that Valgrind reports for the example program. In this case, the variable p is being read before it has been initialized. Because Valgrind operates on compiled programs, it reports virtual memory addresses in its error messages rather than referencing original source code line numbers. The ERROR SUMMARY at the bottom is self-explanatory.
A second simple example demonstrates Valgrind’s heap-checking capabilities. The source code for this example is as follows:
/*
* valgrind_2.c - access outside of allocated memory
*/
#include <stdlib.h>
int main()
int *p, a;
p = malloc(10 * sizeof(int));
p[10] = 1; /* invalid write error */
a = p[10]; /* invalid read error */
free(p);
return 0;
}
This time Valgrind reports errors for an invalid write and read outside of allocated memory space. Additionally, summary statistics report on the number of bytes of memory dynamically allocated and released during program execution. This feature makes it very easy to recognize memory leaks within programs.
==16571== Invalid write of size 4
==16571== at 0x80483A2: main (in valgrind_2)
==16571== by 0x398BBE: __libc_start_main (in /lib/libc-2.3.2.so)
==16571== by 0x80482EC: (within valgrind_2)
==16571== Address 0x52A304C is 0 bytes after a block of size 40 alloc’d
==16571== at 0x90068E: malloc (vg_replace_malloc.c:153)
==16571== by 0x8048395: main (in valgrind_2)
==16571== by 0x398BBE: __libc_start_main (in /lib/libc-2.3.2.so)
==16571== by 0x80482EC: (within valgrind_2)
==16571==
==16571== Invalid read of size 4
==16571== at 0x80483AE: main (in valgrind_2)
==16571== by 0x398BBE: __libc_start_main (in /lib/libc-2.3.2.so)
==16571== by 0x80482EC: (within valgrind_2)
==16571== Address 0x52A304C is 0 bytes after a block of size 40 alloc’d
==16571== at 0x90068E: malloc (vg_replace_malloc.c:153)
==16571== by 0x8048395: main (in valgrind_2)
==16571== by 0x398BBE: __libc_start_main (in /lib/libc-2.3.2.so)
==16571== by 0x80482EC: (within valgrind_2
==16571==
==16571== ERROR SUMMARY: 2 errors from 2 contexts (suppressed: 0 from 0)
==16571== malloc/free: in use at exit: 0 bytes in 0 blocks.
==16571== malloc/free: 1 allocs, 1 frees, 40 bytes allocated.
==16571== For a detailed leak analysis, rerun with: --leak-check=yes
==16571== For counts of detected errors, rerun with: -v
The type of errors reported in this case might easily be caused by off-by-one errors or a heap-based buffer overflow condition.
The last Valgrind example demonstrates reporting of both a memory leak and a double free problem. The example code is as follows:
/*
* valgrind_3.c - memory leak/double free
*/
#include <stdlib.h>
int main() {
int *p;
p = (int*)malloc(10 * sizeof(int));
p = (int*)malloc(40 * sizeof(int)); //first block has now leaked
free(p);
free(p); //double free error
return 0;
}
NOTE
A double free condition occurs when the free function is called a second time for a pointer that has already been freed. The second call to free corrupts heap management information that can result in an exploitable condition.
The results for this last example follow. In this case, Valgrind was invoked with the detailed leak checking turned on.
# valgrind --leak-check=yes ./valgrind_3
This time an error is generated by the double free, and the leak summary reports that the program failed to release 40 bytes of memory that it had previously allocated:
==16584== Invalid free() / delete / delete[]
==16584== at 0xD1693D: free (vg_replace_malloc.c:231)
==16584== by 0x80483C7: main (in valgrind_3)
==16584== by 0x126BBE: __libc_start_main (in /lib/libc-2.3.2.so)
==16584== by 0x80482EC: (within valgrind_3)
==16584== Address 0x47BC07C is 0 bytes inside a block of size 160 free’d
==16584== at 0xD1693D: free (vg_replace_malloc.c:231)
==16584== by 0x80483B9: main (in valgrind_3)
==16584== by 0x126BBE: __libc_start_main (in /lib/libc-2.3.2.so)
==16584== by 0x80482EC: (within valgrind_3)
==16584==
==16584== ERROR SUMMARY: 1 errors from 1 contexts (suppressed: 0 from 0)
==16584== malloc/free: in use at exit: 40 bytes in 1 blocks.
==16584== malloc/free: 2 allocs, 2 frees, 200 bytes allocated.
==16584== For counts of detected errors, rerun with: -v
==16584== searching for pointers to 1 not-freed blocks.
==16584== checked 4664864 bytes.
==16584==
==16584== 40 bytes in 1 blocks are definitely lost in loss record 1 of 1
==16584== at 0xD1668E: malloc (vg_replace_malloc.c:153)
==16584== by 0x8048395: main (in valgrind_3)
==16584== by 0x126BBE: __libc_start_main (in /lib/libc-2.3.2.so)
==16584== by 0x80482EC: (within valgrind_3)
==16584==
==16584== LEAK SUMMARY:
==16584== definitely lost: 40 bytes in 1 blocks.
==16584== possibly lost: 0 bytes in 0 blocks.
==16584== still reachable: 0 bytes in 0 blocks.
==16584== suppressed: 0 bytes in 0 blocks.
==16584== Reachable blocks (those to which a pointer was found) are not shown.
==16584== To see them, rerun with: --show-reachable=yes
While the preceding examples are trivial, they do demonstrate the value of Valgrind as a testing tool. Should you choose to fuzz a program, Valgrind can be a critical piece of instrumentation that can help to quickly isolate memory problems, in particular heap-based buffer overflows, which manifest themselves as invalid reads and writes in Valgrind.
References
GDE Community Edition www.oreas.com
OllyDbg www.ollydbg.de/
Process Stalker pedram.redhive.com/code/process_stalker/
Valgrind valgrind.org/
WinDbg www.microsoft.com/whdc/devtools/debugging
Fuzzing
Black box testing works because you can apply some external stimulus to a program and observe how the program reacts to that stimulus. Monitoring tools give you the capability to observe the program’s reactions. All that is left is to provide interesting inputs to the program being tested. As mentioned previously, fuzzing tools are designed for exactly this purpose, the rapid generation of input cases designed to induce errors in a program. Because the number of inputs that can be supplied to a program is infinite, the last thing you want to do is attempt to generate all of your input test cases by hand. It is entirely possible to build an automated fuzzer to step through every possible input sequence in a brute-force manner and attempt to generate errors with each new input value. Unfortunately, most of those input cases would be utterly useless and the amount of time required to stumble across some useful ones would be prohibitive. The real challenge of fuzzer development is building them in such a way that they generate interesting input in an intelligent, efficient manner. An additional problem is that it is very difficult to develop a generic fuzzer. To reach the many possible code paths for a given program, a fuzzer usually needs to be somewhat “protocol aware.” For example, a fuzzer built with the goal of overflowing query parameters in an HTTP request is unlikely to contain sufficient protocol knowledge to also fuzz fields in an SSH key exchange. Also, the differences between ASCII and non-ASCII protocols make it more than a trivial task to port a fuzzer from one application domain to another.
NOTE
The Hypertext Transfer Protocol (HTTP) is an ASCII-based protocol described in RFC 2616. Secure Shell (SSH) is a binary protocol described in various Internet-Drafts. RFCs and Internet-Drafts are available online at www.ietf.org.
Instrumented Fuzzing Tools and Techniques
Fuzzing should generally be performed with some form of instrumentation in place. The goal of fuzzing is to induce an observable error condition in a program. Tools such as memory monitors and debuggers are ideally suited for use with fuzzers. For example, valgrind will report when a fuzzer has caused a program executing under valgrind control to overflow a heap-allocated buffer. Debuggers will usually catch the fault induced when an invalid memory reference is made as a result of fuzzer-provided input. Following the observation of an error, the difficult job of determining whether the error is exploitable really begins. Exploitability determination will be discussed in the next chapter.
A variety of fuzzing tools exist in both the open source and the commercial world. These tools range from stand-alone fuzzers to fuzzer development environments. In this chapter, we will discuss the basic approach to fuzzing, as well as introduce a fuzzer development framework. Chapters 23 and 25 will cover several more recent fuzzing tools, including fuzzers tailored to specific application domains.
A Simple URL Fuzzer
As an introduction to fuzzers, we will look at a simple program for fuzzing web servers. Our only goal is to grow a long URL and see what effect it has on a target web server. The following program is not at all sophisticated, but it demonstrates several elements common to most fuzzers and will assist you in understanding more advanced examples:
1: /*
2: * simple_http_fuzzer.c
3: *
4: #include <stdio.h>
5: #include <stdlib.h>
6: #include <sys/socket.h>
7: #include <netinet/in.h>
8: //maximum length to grow our url
9: #define MAX_NAME_LEN 2048
10: //max strlen of a valid IP address + null
11: #define MAX_IP_LEN 16
12: //static HTTP protocol content into which we insert fuzz string
13: char request[] = "GET %*s.html HTTP/1.1
Host: %s
";
14: int main(int argc, char **argv) {
15: //buffer to build our long request
16: char buf[MAX_NAME_LEN + sizeof(request) + MAX_IP_LEN];
17: //server address structure
18: struct sockaddr_in server;
19: int sock, len, req_len;
20: if (argc != 2) { //require IP address on the command line
21: fprintf(stderr, "Missing server IP address
");
22 exit(1);
23: }
24: memset(&server, 0, sizeof(server)); //clear the address info
25: server.sin_family = AF_INET; //building an IPV4 address
26: server.sin_port = htons(80); //connecting to port 80
27: //convert the dotted IP in argv[1] into network representation
28: if (inet_pton(AF_INET, argv[1], &server.sin_addr) <= 0) {
29: fprintf(stderr, "Invalid server IP address: %s
", argv[1]);
30: exit(1);
31: }
32: //This is the basic fuzzing loop. We loop, growing the url by
33: //4 characters per pass until an error occurs or we reach MAX_NAME_LEN
34: for (len = 4; len < MAX_NAME_LEN; len += 4) {
35: //first we need to connect to the server, create a socket...
36: sock = socket(AF_INET, SOCK_STREAM, 0);
37: if (sock == -1) {
38: fprintf(stderr, "Could not create socket, quitting
");
39: exit(1);
40: }
41: //and connect to port 80 on the web server
42: if (connect(sock, (struct sockaddr*)&server, sizeof(server))) {
43: fprintf(stderr, "Failed connect to %s, quitting
", argv[1]);
44: close(sock);
45: exit(1); //terminate if we can't connect
46: }
47: //build the request string. Request really only reserves space for
48: //the name field that we are fuzzing (using the * format specifier)
49: req_len = snprintf(buf, sizeof(buf), request, len, "A", argv[1]);
50: //this actually copies the growing number of A's into the request
51: memset(buf + 4, 'A', len);
52: //now send the request to the server
53: send(sock, buf, req_len, 0);
54: //try to read the server response, for simplicity's sake let's assume
55: //that the remote side choked if no bytes are read or a recv error
56: //occurs
57: if (read(sock, buf, sizeof(buf), 0) <= 0) {
58: fprintf(stderr, "Bad recv at len = %d
", len);
59: close(sock);
60: break; //a recv error occurred, report it and stop looping
61: }
62: close(sock);
63: }
64: return 0;
65: }
The essential elements of this program are its knowledge, albeit limited, of the HTTP protocol contained entirely in line 13, and the loop in lines 34–63 that sends a new request to the server being fuzzed after generating a new larger filename for each pass through the loop. The only portion of the request that changes between connections is the filename field (%*s) that gets larger and larger as the variable len increases. The asterisk in the format specifier instructs the snprintf() function to set the length according to the value specified by the next variable in the parameter list, in this case len. The remainder of the request is simply static content required to satisfy parsing expectations on the server side. As len grows with each pass through the loop, the length of the filename passed in the requests grows as well. Assume for example purposes that the web server we are fuzzing, bad_httpd, blindly copies the filename portion of a URL into a 256-byte, stack-allocated buffer. You might see output such as the following when running this simple fuzzer:
# ./simple_http_fuzzer 127.0.0.1
# Bad recv at len = 276
From this output, you might conclude that the server is crashing when you grow your filename to 276 characters. With appropriate debugger output available, you might also find out that your input overwrites a saved return address and that you have the potential for remote code execution. For the previous test run, a core dump from the vulnerable web server shows the following:
# gdb bad_httpd core.16704
Core was generated by './bad_httpd'.
Program terminated with signal 11, Segmentation fault.
#0 0x006c6d74 in ?? ()
This tells you that the web server terminated because of a memory access violation and that execution halted at location 0x006c6d74, which is not a typical program address. In fact, with a little imagination, you realize that it is not an address at all, but the string “tml”. It appears that the last 4 bytes of the filename buffer have been loaded into eip, causing a segmentation fault. Since you can control the content of the URL, you can likely control the content of eip as well, and you have found an exploitable problem.
Note that this fuzzer does exactly one thing: it submits a single long filename to a web server. A more interesting fuzzer might throw additional types of input at the target web server, such as directory traversal strings. Any thoughts of building a more sophisticated fuzzer from this example must take into account a variety of factors, such as:
• What additional static content is required to make new requests appear to be valid? What if you wanted to fuzz particular HTTP request header fields, for example?
• Additional checks imposed on the recv operation to allow graceful failure of recv operations that time out. Possibilities include setting an alarm or using the select function to monitor the status of the socket.
• Accommodating more than one fuzz string.
As an example, consider the following URL:
http://gimme.money.com/cgi-bin/login?user=smith&password=smithpass
What portions of this request might you fuzz? It is important to identify those portions of a request that are static and those parts that are dynamic. In this case, the supplied request parameter values smith and smithpass are logical targets for fuzzing, but they should be fuzzed independently from each other, which requires either two separate fuzzers (one to fuzz the user parameter and one to fuzz the password parameter) or a single fuzzer capable of fuzzing both parameters at the same time. A multivariable fuzzer requires nested iteration over all desired values of each variable being fuzzed, and is therefore somewhat more complex to build than the simple single-variable fuzzer in the example.
Fuzzing Unknown Protocols
Building fuzzers for open protocols is often a matter of sitting down with an RFC and determining static protocol content that you can hard-code and dynamic protocol content that you may want to fuzz. Static protocol content often includes protocol-defined keywords and tag values, while dynamic protocol content generally consists of user-supplied values. How do you deal with situations in which an application is using a proprietary protocol whose specifications you don’t have access to? In this case, you must reverse-engineer the protocol to some degree if you hope to develop a useful fuzzer. The goals of the reverse engineering effort should be similar to your goals in reading an RFC: identifying static versus dynamic protocol fields. Without resorting to reverse-engineering a program binary, one of the few ways you can hope to learn about an unknown protocol is by observing communications to and from the program. Network sniffing tools might be very helpful in this regard. The WireShark network monitoring tool, for example, can capture all traffic to and from an application and display it in such a way as to isolate the application layer data that you want to focus on. Initial development of a fuzzer for a new protocol might simply build a fuzzer that can mimic a valid transaction that you have observed. As protocol discovery progresses, the fuzzer is modified to preserve known static fields while attempting to mangle known dynamic fields. The most difficult challenges are faced when a protocol contains dependencies among fields. In such cases, changing only one field is likely to result in an invalid message being sent from the fuzzer to the server. A common example of such dependencies is embedded length fields, as shown in this simple HTTP POST request:
POST /cgi-bin/login.pl HTTP/1.1
Host: gimme.money.com
Connection: close
User-Agent: Mozilla/6.0
Content-Length: 29
Content-Type: application/x-www-form-encoded
user=smith&password=smithpass
In this case, if you want to fuzz the user field, then each time you change the length of the user value, you must be sure to update the length value associated with the Content-Length header. This somewhat complicates fuzzer development, but it must be properly handled so that your messages are not rejected outright by the server simply for violating the expected protocol.
SPIKE
SPIKE is a fuzzer creation toolkit/API developed by Dave Aitel of Immunity, Inc. SPIKE provides a library of C functions for use by fuzzer developers. Only Dave would call SPIKE pretty, but it was one of the early efforts to simplify fuzzer development by providing buffer construction primitives useful in many fuzzing situations. SPIKE is designed to assist in the creation of network-oriented fuzzers and supports sending data via TCP or UDP. Additionally, SPIKE provides several example fuzzers for protocols ranging from HTTP to Microsoft Remote Procedure Call (MSRPC). SPIKE libraries can be used to form the foundation of custom fuzzers, or SPIKE’s scripting capabilities can be used to rapidly develop fuzzers without requiring detailed knowledge of C programming.
The SPIKE API centers on the notion of a “spike” data structure. Various API calls are used to push data into a spike and ultimately send the spike to the application being fuzzed. Spikes can contain static data, dynamic fuzzing variables, dynamic length values, and grouping structures called blocks. A SPIKE “block” is used to mark the beginning and end of data whose length should be computed. Blocks and their associated length fields are created with name tags. Prior to sending a spike, the SPIKE API handles all of the details of computing block lengths and updating the corresponding length field for each defined block. SPIKE cleanly handles nested blocks.
We will review some of the SPIKE API calls here. The API is not covered in sufficient detail to allow creation of stand-alone fuzzers, but the functions described can easily be used to build a SPIKE script. Most of the available functions are declared (though not necessarily described) in the file spike.h. Execution of a SPIKE script will be described later in the chapter.
Spike Creation Primitives
When developing a stand-alone fuzzer, you need to create a spike data structure into which you will add content. All of the SPIKE content manipulation functions act on the “current” spike data structure as specified by the set_spike() function. When creating SPIKE scripts, these functions are not required, as they are automatically invoked by the script execution engine.
• struct spike *new_spike() Allocate a new spike data structure.
• int spike_free(struct spike *old_spike) Release the indicated spike.
• int set_spike(struct spike *newspike) Make newspike the current spike. All future calls to data manipulation functions will apply to this spike.
SPIKE Static Content Primitives
None of these functions requires a spike as a parameter; they all operate on the current spike as set with set_spike.
• s_string(char *instring) Insert a static string into a spike.
• s_binary(char *instring) Parse the provided string as hexadecimal digits and add the corresponding bytes into the spike.
• s_bigword(unsigned int aword) Insert a big-endian word into the spike. Inserts 4 bytes of binary data into the spike.
• s_xdr_string(unsigned char *astring) Insert the 4-byte length of astring followed by the characters of astring into the spike. This function generates the XDR representation of astring.
NOTE
XDR is the External Data Representation standard, which describes a standard way in which to encode various types of data such as integers, floating-point numbers, and strings.
• s_binary_repeat(char *instring, int n) Add n sequential instances of the binary data represented by the string instring into the spike.
• s_string_repeat(char *instring, int n) Add n sequential instances of the string instring into the spike.
• s_intelword(unsigned int aword) Add 4 bytes of little-endian binary data into the spike.
• s_intelhalfword(unsigned short ashort) Add 2 bytes of little-endian binary data into the spike.
SPIKE Block Handling Primitives
The following functions are used to define blocks and insert placeholders for block length values. Length values are filled in prior to sending the spike, once all fuzzing variables have been set.
• int_block_start(char *blockname) Start a named block. No new content is added to the spike. All content added subsequently up to the matching block_end call is considered part of the named block and contributes to the block’s length.
• int s_block_end(char *blockname) End the named block. No new content is added to the spike. This marks the end of the named block for length computation purposes.
Block lengths may be specified in many different ways depending on the protocol being used. In HTTP, a block length may be specified as an ASCII string, while binary protocols may specify block lengths using big- or little-endian integers. SPIKE provides a number of block length insertion functions covering many different formats.
• int s_binary_block_size_word_bigendian(char*blockname) Insert a 4-byte big-endian placeholder to receive the length of the named block prior to sending the spike.
• int s_binary_block_size_halfword_bigendian(char*blockname) Insert a 2-byte big-endian block size placeholder.
• int s_binary_block_size_intel_word(char*blockname) Insert a 4-byte little-endian block size placeholder.
• int s_binary_block_size_intel_halfword(char*blockname) Insert a 2-byte little-endian block size placeholder.
• int s_binary_block_size_byte(char *blockname) Insert a 1-byte block size placeholder.
• int s_blocksize_string(char *blockname, int n) Insert an n-character block size placeholder. The block length will be formatted as an ASCII decimal integer.
• int s_blocksize_asciihex(char *blockname) Insert an 8-character block size placeholder. The block length will be formatted as an ASCII hex integer.
SPIKE Fuzzing Variable Declaration
The last function required for developing a SPIKE-based fuzzer provides for declaring fuzzing variables. A fuzzing variable is a string that SPIKE will manipulate in some way between successive transmissions of a spike.
• void s_string_variable(unsigned char *variable) Insert an ASCII string that SPIKE will change each time a new spike is sent.
When a spike contains more than one fuzzing variable, an iteration process is usually used to modify each variable in succession until every possible combination of the variables has been generated and sent.
SPIKE Script Parsing
SPIKE offers a limited scripting capability. SPIKE statements can be placed in a text file and executed from within another SPIKE-based program. All of the work for executing scripts is accomplished by a single function.
• int s_parse(char *filename) Parse and execute the named file as a SPIKE script.
A Simple SPIKE Example
Consider the HTTP post request we looked at earlier:
POST /cgi-bin/login.pl HTTP/1.1
Host: gimme.money.com
Connection: close
User-Agent: Mozilla/6.0
Content-Length: 29
Content-Type: application/x-www-form-encoded
user=smith&password=smithpass
The following sequence of SPIKE calls would generate valid HTTP requests while fuzzing the user and password fields in the request:
s_string("POST /cgi-bin/login.pl HTTP/1.1
");
s_string("Host: gimme.money.com
);
s_string("Connection: close
");
s_string("User-Agent: Mozilla/6.0
");
s_string("Content-Length: ");
s_blocksize_string("post_args", 7);
s_string("
Content-Type: application/x-www-form-encoded
");
s_block_start("post_args");
s_string("user=");
s_string_variable("smith");
s_string("&password=");
s_string_variable("smithpass");
s_block_end("post_args");
These statements constitute a valid SPIKE script (we refer to this script as demo.spk). All that is needed now is a way to execute these statements. Fortunately, the SPIKE distribution comes with a simple program called generic_send_tcp that takes care of the details of initializing a spike, parsing a script into the spike, and iterating through all fuzzing variables in the spike. Five arguments are required to run generic_send_tcp: the host to be fuzzed, the port to be fuzzed, the filename of the spike script, information on whether any fuzzing variables should be skipped, and whether any states of each fuzzing variable should be skipped. These last two values allow you to jump into the middle of a fuzzing session, but for our purposes, set them to zero to indicate that you want all variables fuzzed and every possible value used for each variable. Thus the following command line would cause demo.spk to be executed:
# ./generic_send_tcp gimme.money.com 80 demo.spk 0 0
If the web server at gimme.money.com had difficulty parsing the strings thrown at it in the user and password fields, then you might expect generic_tcp_send to report errors encountered while reading or writing to the socket connecting to the remote site.
If you’re interested in learning more about writing SPIKE-based fuzzers, you should read through and understand generic_send_tcp.c. It uses all of the basic SPIKE API calls to provide a nice wrapper around SPIKE scripts. More detailed information on the SPIKE API itself can only be found by reading through the spike.h and spike.c source files.
SPIKE Proxy
SPIKE Proxy is another fuzzing tool, also developed by Dave Aitel, that performs fuzzing of web-based applications. The tool sets itself up as a proxy between you and the website or application you want to fuzz. By configuring a web browser to proxy through SPIKE Proxy, you interact with SPIKE Proxy to help it learn some basic information about the site being fuzzed. SPIKE Proxy takes care of all the fuzzing and is capable of performing attacks such as SQL injection and cross-site scripting. SPIKE Proxy is written in Python and can be tailored to suit your needs.
Sharefuzz
Also authored by Dave Aitel, Sharefuzz is a fuzzing library designed to fuzz set user ID (SUID) root binaries.
NOTE
A SUID binary is a program that has been granted permission to run as a user other than the user that invokes the program. The classic example is the passwd program, which must run as root to modify the system password database.

Figure 22-4 Normal call to getenv using libc
Vulnerable SUID root binaries can provide an easy means for local privilege escalation attacks. Sharefuzz operates by taking advantage of the LD_PRELOAD mechanism on Unix systems. By inserting itself as a replacement for the getenv library function, Sharefuzz intercepts all environment variable requests and returns a long string rather than the actual environment variable value. Figure 22-4 shows a standard call to the getenv library function, while Figure 22-5 shows the results of a call to getenv once the program has been loaded with Sharefuzz in place. The goal is to locate binaries that fail to properly handle unexpected environment string values.
Reference
SPIKE, SPIKE Proxy, Sharefuzz www.immunitysec.com/resources-freesoftware.shtml
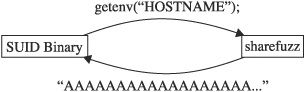
Figure 22-5 Fuzzed call to getenv with Sharefuzz in place