
Chapter 7
Stage 4: Analytics Coding for Ease of Review
Summary
Once data has been loaded into the Data Manipulation Environment (DME), it is time to do some analysis on it. This is Stage 4 of the Guerrilla Analytics workflow. A significant amount of analysis involves writing program code to manipulate and prepare data and perhaps then apply statistical models, machine-learning algorithms, and visualizations. This chapter introduces simple conventions to improve the clarity, traceability, and reproducibility of analytics code, and thereby save time and reduce confusion in the Guerrilla Analytics environment.
Keywords
Coding
Code Review
Programming
Logging
Data Step
Run Order
7.1. Guerrilla Analytics workflow
At this stage in the Guerrilla Analytics workflow of Figure 19, data has been extracted from a source system and received by the analytics team. This data has been successfully loaded into the target DME. You have now reached a stage in the analytics workflow where you can do some actual analytics. This involves writing program code in your data analytics environment. Program code has several purposes in analytics work.
• Manipulate data: To manipulate data, changing it from one form and shape into another, and merging together datasets.
• Derive data: To create new data points that are derived from existing data points.
• Test data: To test and profile data so that defects in the data can be detected.
• Build models: To produce statistical models from the data.
• Visualize insights: To produce visualizations of the data.
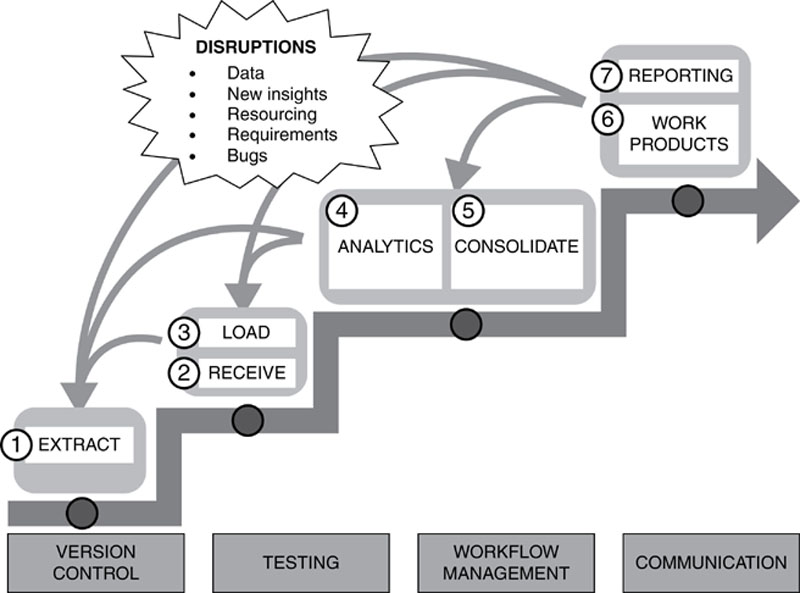
Figure 19 The Guerrilla Analytics workflow
The outputs of your program code will be one or more datasets and perhaps some graphical outputs. Keeping in mind the highly dynamic Guerrilla Analytics environment, you need to strive to write code that is easy to understand and review and that preserves the provenance of your data. You need to do this with minimal documentation and process overhead.
7.1.1. Example Activities
Here are some examples of analytics program code.
• A single SQL code file that connects to a relational database goes through a supplier address table and identifies the address country for each supplier by looking for recognized zip code patterns in the supplier address fields. This derived address country is added into the dataset as a new data field.
• A single R code file that reads a CSV data file, classifies its columns into variables, runs a statistical regression analysis on the variables, and then outputs the analysis results as tables and as plots to image files.
• A Python script that runs through a directory of thousands of office documents, calls an external tool to convert these to XML format, and saves the XML file beside its original office document with the same name. This process is to prepare the data for further entity enrichment with another tool.
• Twenty code files are run in a particular order to manipulate and reshape data so it can be imported into a data-mining tool.
• A SQL code file that creates a predefined subset of data according to business rules and exports this subset of data into a spreadsheet with mark-up columns for the customer to review and complete.
• A collection of code files that incorporate spreadsheet inputs from users and build them into a data repository so they can be summarized for Management Information (MI) reporting and checked for inconsistencies.
• A direct export of a dataset in the DME so the customers can do their own work with the data.
There are of course many more examples. I have deliberately chosen these examples to draw attention to some important Guerrilla Analytics themes.
• Many languages: A variety of data manipulation languages may be in use in the team either because of the functionality required or because they are familiar to particular team members. These languages will have code files with different structures because of the languages’ designs.
• Multiple code files: Some work requires a single program code file while other work involves several code files that must be executed together in a particular order. It is the analyst’s choice how the data flow is split into code files.
• Multiple outputs and output formats: Some work involves multiple outputs in a variety of formats such as data samples in spreadsheets and graphical charts in image files.
• Multiple environments: Some work is running on the file system and some work is running within a database or other DME.
• Human-keyed inputs: Some work is incorporating user inputs and mark-ups.
• Tiny code: Even the simplest code – extracting a copy of a dataset – is something that needs to be traceable to maintain data provenance.
7.2. Pitfalls and risks
Analytics coding is a very wide area to cover as you have seen in the previous section’s examples. This means that there are plenty of pitfalls and risks associated with coding. In essence, the challenge is that one or more code files is producing one or more outputs in one or more formats using one or more environments. Losing the mapping between the code files and these outputs runs the following risks for the team.
• Lost data provenance: Nobody is confident about where a particular dataset was generated and the DME becomes cluttered with datasets that cannot be deleted for fear that they cannot be reproduced.
• Time wasted in review and development: Review and debugging of code becomes awkward and time consuming. Since every code file produces its own outputs with no convention for what those outputs should be called, a reviewer has to read the code fully to find a reference to the output dataset name and location. Conversely, when a problem arises with a dataset, there is no quick way to determine which code file created that dataset and investigate the cause of the problem.
• Reproducibility is impaired: Work products that involve multiple code files are awkward to rerun and reproduce because it is difficult to determine the order in which files should be run. Work products that involve multiple program languages must be executed using different tools, have different structures, and may be located in different places.
Work products cannot be rerun quickly because the code is cluttered with snippets and fragments of exploratory code that must be skipped over. Alternatively, work products cannot be rerun quickly because the code jumps between programming languages and so the user must jump between different code files and development environments.
An important theme across all these pitfalls is that of ease of reproducibility and review. The beauty and danger of program code is that you can get to an excellent and correct analytics result with a wide variety of approaches. At one end of the spectrum, you can write a hulking great single piece of code that must be stepped through and jumped in and out of by the person executing the code. Alternatively, at the other end of the spectrum, you can write a piece of modular code that flows through clearly defined steps. Both approaches will get you the right answer. Only the latter approach stands up to the dynamics and constraints of a Guerrilla Analytics project.
The subsequent sections detail tips for mitigating the risks associated with analytics coding.
7.3. Practice tip 19: use one code file per data output
7.3.1. Guerrilla Analytics Environment
Recall that you are now writing code that manipulates data into a final output dataset. It is very easy and tempting to have a single code file produce many related outputs. But it is difficult to tie these multiple outputs back to their originating code file. You will need to do this when problems are identified with the dataset and when work needs to be handed over to another team member. Understanding a dataset is challenging when the code that is generated is hidden half way through an 800 line code file and depends on several other datasets that are equally well obscured.
7.3.2. Guerrilla Analytics Approach
It is best to structure code such that one code file produces one data output. Data outputs may be charts, images, and further datasets. If the name of the code file is included in the name of the output, this greatly helps traceability.
7.3.3. Advantages
One code file per data output has several advantages.
• Ease of debugging: When there is a problem with a dataset, your first place to go is a single code file of a similar name rather than having to trawl through the whole code base.
• Ease of understanding: When a dataset needs to be rebuilt, you have a single code file to understand and execute. This is much more difficult if a code file has to be executed starting somewhere in the middle of the file and finishing somewhere before the end of the code file.
• Ease of knowledge sharing: When work needs to be handed over or audited, you can easily identify the source code of a particular dataset.
• Ease of testing and maintenance: Code files tend to be smaller and therefore more manageable in terms of maintenance and testing of their functionality.
• Ease of shared development: Because code files are more granular and modular, it is easier for several analysts to work in the same code base without stepping on one another’s toes. When your team has large code files, you can end up with analysts lining up to make changes to the file. This is of course inefficient.
7.4. Practice tip 20: produce clearly identifiable data outputs
7.4.1. Guerrilla Analytics Environment
While a code file might produce a single data output, it probably also produces several intermediate outputs on its journey to a result. You may need to pull in other data sources and modify them. You may need to break down complex calculations into smaller steps and write out the results of those smaller steps into datasets. These intermediate datasets clog up the DME and make it difficult to find the result datasets.
7.4.2. Guerrilla Analytics Approach
Although intermediate datasets are important to understand the code file and data manipulations in detail, they are not essential to a quick understanding of the most important dataset – the code file’s output. The code file’s output should appear at the end of the code file (since it is the last thing the code file does) and should be clearly marked as the code file’s output. A simple convention on dataset naming can achieve this. For example, conventions such as prefixing all intermediate dataset names with a character like “_” makes it clear that these datasets are less important to the overall results.
7.4.3. Advantages
When code file outputs are clearly identifiable, the advantages to the team and manager are as follows.
• You quickly identify the correct part of the code file where an output is produced so you can work backward and determine how the output was generated, step by step. This reduces code review and handover time.
• Intermediate datasets can be ignored until the full data flow needs to be understood or debugged. This helps team members to focus on the areas of code that matter most instead of wading through lots of preparatory code or even unrelated code.
Both of these advantages mean that less of the team’s time is wasted in trying to locate and understand a result. This is critical in the Guerrilla Analytics environment.
7.5. Practice tip 21: write code that runs from start to finish
7.5.1. Guerrilla Analytics Environment
We have discussed how analytics by its nature leads to piece meal code. An analyst’s workflow will typically include summarizing and profiling data to better understand it. They may trial several statistical models to determine the most appropriate one to use in the final work product. Exceptions and nuances in the data are discovered during analysis and have to be addressed with revised code. This exploratory code is necessary.
Problems arise if this exploratory code is left lying around in code files. Code files are then in a state where you cannot quickly execute them without tripping over all the exploratory code that is still in the file. Very often this exploratory code is old and breaks code execution. If nothing else, time and space are wasted executing code and creating data that is no longer needed.
7.5.2. Guerrilla Analytics Approach
In practice, many of the problems of creating understandable and well-integrated analytics code disappear if you insist on a simple rule – code files must always execute straight through from start to finish.
7.5.3. Advantages
With this rule in place, many of the following bugs and bad practice disappear.
• Cleaner code: Any code snippet that is not relevant to the final work product has either been deleted or commented out. This means it does not distract the reviewer, does not execute unnecessarily, and does not hang around going out of date and breaking code execution.
• Stale data bugs are detected: If a temporary dataset has disappeared or a dataset reference has changed then the code will fail. Lurking bugs of stale data references like these are quickly identified by making the code fail fast.
7.6. Practice tip 22: favor code that is not embedded in proprietary file formats
7.6.1. Guerrilla Analytics Environment
Broadly, we can identify two types of analytics tools.
• Programmatic inputs: These tools can be controlled via a command-line, can be configured with external nonproprietary configuration files and their data manipulations, and commands are executed through program code text files.
• Proprietary graphical inputs: These tools are controlled through a graphical interface. Their configuration, data manipulations, and execution are driven through a graphical interface, and their projects are often saved in proprietary binary file formats.
The latter tools make it difficult to automate data manipulation code and this slows down the Guerrilla Analyst.
7.6.2. Guerrilla Analytics Approach
Given the choice, prefer tools with programmatic inputs over those with graphical inputs. Note that I am not advocating avoiding tools with graphical inputs – these can be great time-savers and increase productivity on complex tasks. However, those same tools should have a programmatic interface that allows them to be deployed and executed outside the graphical interface when the design work is finished.
7.6.3. Advantages
Having programmatic control of analytics tools has huge advantages for productivity.
• Automation, scheduling, and parameters: If a tool can be controlled from a command-line, its work can be easily automated, scheduled, and parameterized. For example, you could write a script to open a PDF document (which you would pass into the script with a parameter) and then look up some domain-specific concepts used in the file such as office locations. Because you have a simple script that can be parameterized at the command line, you can now point that script at an arbitrary folder of millions of PDF documents and do the same work. This scale up and automation would have been difficult to execute inside of many graphical tools.
• Complex configuration: If configuration settings can be externalized into one or more configuration files, the analytics tool can easily be deployed in a variety of scenarios. Only the associated configuration file needs to change while the core analytics code can remain the same. This is typical of the approach taken in traditional software deployment scenarios. You would do development in a “development environment” against a development database. The associated location and connection settings for this development database would be in the development configuration file. In addition, you would have a production configuration file so that the same application could be pointed at a production database in a separate production location with different connection settings.
• Version control: Version control works best with text files. This is because version control software looks at files, detects differences between versions of the files, and tracks who made the edits that caused those differences. While this is easy to do with text format files, it is very difficult to do with binary format files. If a tool can save its code in external text files then your work with that tool can be version controlled. However, if the tool saves your work in a large binary file there is little you can do to put robust version control around that file.
7.7. Practice tip 23: clearly label the running order of code files
7.7.1. Guerrilla Analytics Environment
The practice tips covered so far allow you to quickly achieve the following.
• Locate the code file that created a dataset.
• Work backward through that code from the point at which its output dataset was created.
• Avoid the distraction of broken code snippets and stale data references.
• Execute code from start to finish to quickly reproduce an analysis.
However, complex analytics work products are often broken into several code files. You do this either to make them easier to understand or because a mixture of programming languages and technologies is being used. Without some convention, it is difficult to know which code files should be run in which order to reproduce a work product. There is nothing more frustrating than rummaging through a collection of code files to solve a run-order mystery.
7.7.2. Guerrilla Analytics Approach
In practice, the simplest and most lightweight way to highlight the running order of code files is to prefix their file name with their running order. This running order does not have to be numbered continuously. Indeed, it makes sense to space out the numbering so that you can easily insert a new file into the running order without having to rename all subsequent files.
Figure 20 shows a simple example for cleaning some data about crime rates. The data flow takes some crime data and attaches postcodes and zip codes to it. It then does some follow-up cleaning of the data file and plots the data by city using an R script. On the left, the order in which the code should be executed is unclear. On the right, files have been numbered in the order in which they should be executed. For little effort, a major source of confusion and wasted time has been removed.
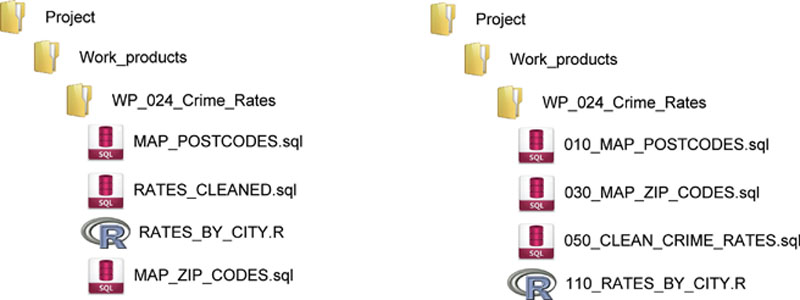
Figure 20 A muddled execution order and a clear execution order of code files
7.7.3. Advantages
• Efficiency: Handovers and reviews do not necessitate a conversation around what files to run and in which order. It is immediately clear from how the files are named.
• Provenance: Work products can be reproduced quickly without having to understand the inputs and outputs of every code file in the code base. Take the code files as presented, run them in the order as presented and your work product should pop out at the end.
• Automation: Automation of code file execution is simplified. A script can list all code files in alphabetical order and then execute them in that order. Without this naming convention, script run orders would have to be maintained in a separate schedule. Under tight timelines, these external schedule files are difficult to maintain.
7.8. Practice tip 24: drop all datasets at the start of code execution
7.8.1. Guerrilla Analytics Environment
As analytics code is executed and then re-executed during development, it will try to create the same intermediate and output datasets that may already exist from a previous execution. This is easily detected when the analytics code halts and warns you that a desired output dataset already exists. However, failure to apply a drop and then create to all datasets related to a work product can hide a particularly nasty type of stale dataset bug. If there is a dataset that is not dropped and recreated on every run of the code, that dataset can linger in code references. Your code will happily run through without complaint but will be referencing an old and incorrect dataset.
7.8.2. Guerrilla Analytics Approach
Before running analytics code, drop all datasets produced by that analytics code if they already exist. Effectively this means cleaning out the target space into which the code is about to write its datasets.
7.8.3. Advantages
The main advantage of the “drop and create” approach is that it quickly exposes stale dataset and stale data field bugs. Every execution of the code effectively rebuilds the intermediate and output datasets “from scratch.” Dependencies on the existence of datasets are explicitly called out and necessary intermediate datasets have to be created by the code. Any breakages in data provenance are thus quickly detected.
7.9. Practice tip 25: break up data flows into “data steps”
7.9.1. Guerrilla Analytics Environment
A “data step” is a small chunk of code that produces a dataset. You can think about a data analytics process as involving several data steps that make a series of manipulations to data until a final output dataset is produced. Even when code files are mapped one-to-one with datasets, it is still possible to have a lot of complex code within a single file. Many languages allow you to build up quite complex data manipulations in a single code segment. This makes code difficult to review and also obscures the impact on the data of individual data manipulations.
7.9.2. Guerrilla Analytics Approach
It is better to break down code into comprehensible data steps where possible.
7.9.3. Advantages
Coding with data steps is advantageous in several ways.
• Debugging: Code is easier to debug because the intermediate datasets after each data step can be inspected, tested, and understood. Any extra time spent in a slightly less efficient code execution is usually won back in the time saved trying to understand unnecessarily complex code.
• Provenance: The impact of data manipulations on the data is easier to quantify. Because significant data manipulations are broken out into individual data steps, it is easier to work through each data step and test, or report on its output as necessary.
• Maintenance: Code is easier to refactor in the future because there are more break points in the code where new rules and data sources can be introduced.
7.10. Practice tip 26: don’t jump in and out of a code file
7.10.1. Guerrilla Analytics Environment
In analytics work, it is common to have to apply a variety of programming languages to a work product. You may do heavy lifting of data in one language, statistical modeling in another language, and visualization in a third language. These languages generally do not work together in the same code files. You are therefore faced with having to jump between programming languages and associated code files. Without some simple conventions, executing code becomes a tangled mess of code jumps that are poorly documented and impossible to automate.
7.10.2. Guerrilla Analytics Approach
This tip says that a data flow should not jump out of a code file to execute another process and then jump back into that same code file to resume the data flow.
7.10.3. Advantages
The primary advantage of this tip is that you can preserve code that runs from start to finish. The advantages of end-to-end code were already discussed. Applying this tip helps extend that approach across multiple programming languages and tools typically required in Guerrilla Analytics.
7.11. Practice tip 27: log code execution
7.11.1. Guerrilla Analytics Environment
As the complexity and volume of code files increases, it becomes more difficult to monitor what the code is doing. If code execution is time consuming, you would like some indication of progress through the data flow so that you know the time remaining and whether data processing may have stalled for some reason. Having to manually inspect program outputs in a graphical development environment is time consuming and error prone.
7.11.2. Guerrilla Analytics Approach
Logging allows you to output log messages at various points in the execution of your code file. The richness of logging available to you depends on the programming languages and libraries you are using. In some cases, languages have comprehensive logging frameworks that output messages in a variety of formats and severity thresholds. In other languages you may be limited to simply printing messages to a text file.
Figure 21 shows a simple example of a log file containing the main features useful in Guerrilla Analytics. Every line contains a time stamp so you can see how the code is progressing. The log also mentions the file name in which the log is being stored. Every line contains the code file name from which the log is being printed. This is useful if an error is printed and needs to be followed up. Finally, the log reports how long it took to execute all files.
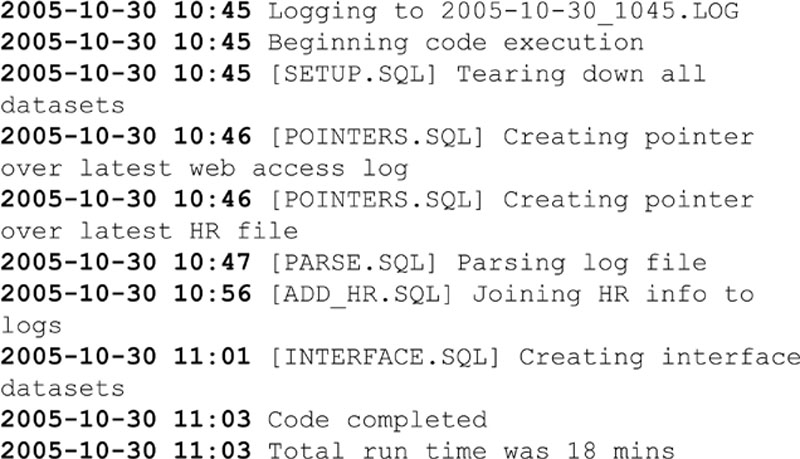
Figure 21 Example log output
7.11.3. Advantages
With even the most basic logging in place, you can leverage the following advantages.
• Execution progress: You have feedback on the progress of code execution. If 10 of your code files have logged that they have completed, you know you are 10 files into your analytics run. Without this information, you have no idea whether the analytics code is 5% complete or 95% complete.
• Highlight inefficiencies: After one code run, you can have a time stamp of how long each data step took and can easily identify pinch points and inefficiencies in the data flow. For example, if the fifth code file in your execution takes three times as long to complete as every other file, perhaps this is a good area for optimization. Perhaps the code could be better written or the data could be better constructed.
• Find errors: You can automatically check for errors by searching your log files rather than having to individually inspect and test outputs after every code run.
• Audit: You have a time-stamped record of the code that was run and what it produced. This can be important when tracing problems with work products and if there is an audit requirement to show that code was run without errors at a particular point in time.
7.12. Common Challenges
Introducing some of the conventions of this chapter can be perceived as overbearing by some team members. People get used to their own way of working and are reluctant to change. Here are some common challenges you may encounter.
7.12.1. What about Graphical Analytics and ETL Tools?
There are many graphical tools for data manipulation and analytics work. By graphical tools we mean those tools that allow you to design and specify data flows and analyses by arranging graphical components. These tools are often touted because you “do not have to know how to code” and you get your documentation for free in the graphical interface. These tools struggle in a Guerrilla Analytics environment for the following reasons.
• The files describing the analytics cannot easily be version controlled as they are often in a binary file format.
• An analysis cannot be easily modified. The analyst has to drill down through the interface and navigate many wizards, check boxes, and dialogs.
• These tools can never be as flexible as raw analytics code. At best they will provide a “code component” in which you end up writing analytics code anyway.
These tools undoubtedly have their usefulness. However, they are not flexible enough for a Guerrilla Analytics environment.
7.12.2. This is Too Much; I Just Want to Write My Code!
The value of these simple code conventions becomes apparent to team members in two scenarios.
• When work needs to be handed over between team members: Have you ever seen situations where one analyst is on leave and the person covering for them needs to get up to speed? They spend most of their time trying to unravel spaghetti code files, versions of outputs, and datasets scattered throughout the DME. This is inefficient and looks bad in front of a customer. The simple conventions in this chapter avoid the major pain points in coordinating code between team members.
• When you introduce peer review in the team: If every code handover requires sitting down together with a detailed walk through, it quickly becomes a frustrating waste of time for team members. Having simple conventions that everybody follows will dramatically reduce this overhead. As far as possible, you want a team who can easily jump into one another’s work with minimal overhead and documentation.
7.13. Wrap up
This chapter covered the Analytics stage of the Guerrilla Analytics workflow, focusing on tips for producing reproducible and traceable analytics code files. In particular, you learned the following.
• The typical activities that take place in Guerrilla Analytics coding.
• The challenges to writing Guerrilla Analytics code that is traceable and reproducible.
• The pitfalls and risks of coding in a Guerrilla Analytics environment.
• Several tips that help your team produce high-quality code with minimal overhead that addresses the risks inherent in the Guerrilla Analytics environment.
• How to address the most common challenges to the tips presented in this chapter.
..................Content has been hidden....................
You can't read the all page of ebook, please click here login for view all page.