
Chapter 2
Guerrilla Analytics: Challenges and Risks
Summary
In this chapter, we describe Guerrilla Analytics projects in more detail. We will discuss the typical workflow and challenges encountered in Guerrilla Analytics projects. These challenges bring risks. We will discuss the risks inherent in a Guerrilla Analytics project and the effects and consequences of not managing these risks.
Keywords
Risks
Challenges
Management
Risk Mitigation
2.1. The Guerrilla Analytics workflow
We introduced Guerrilla Analytics in the previous chapter. Recall that Guerrilla Analytics projects are characterized as having some or all of the following.
• Highly dynamic data
• Highly dynamic requirements
• Highly dynamic resourcing
The project requirements and constraints are such that:
• There is limited time
• There are limited toolsets
• Results must be reproducible
• Results must be transparent and traceable
What does the analytics workflow look like in these types of projects? At a high level, data is received and work is done to understand it, prepare it, and produce analyses. This is no different from the workflow followed in many methodologies such as CRISP-DM (Chapman et al., 2000; Shearer, 2000) that is reproduced in Figure 3.
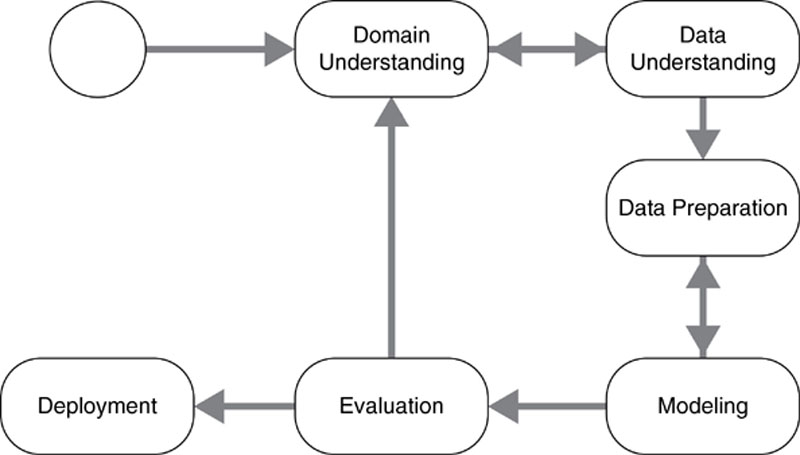
Figure 3 The CRISP-DM reference model (Jensen, 2012)
Not surprisingly, given what we now know about Guerrilla Analytics, its reference model is more iterative. It is as if somebody keeps moving the goalposts on us. We have to accommodate these disruptions while producing testable, reproducible analytics. Figure 4 summarizes the reality of data analytics in a Guerrilla Analytics project. Overall, data goes through the same lifecycle. Data is extracted from some source system and loaded into the team’s Data Manipulation Environment (DME). It is then analyzed and perhaps consolidated before being issued in a formal report or smaller work product.
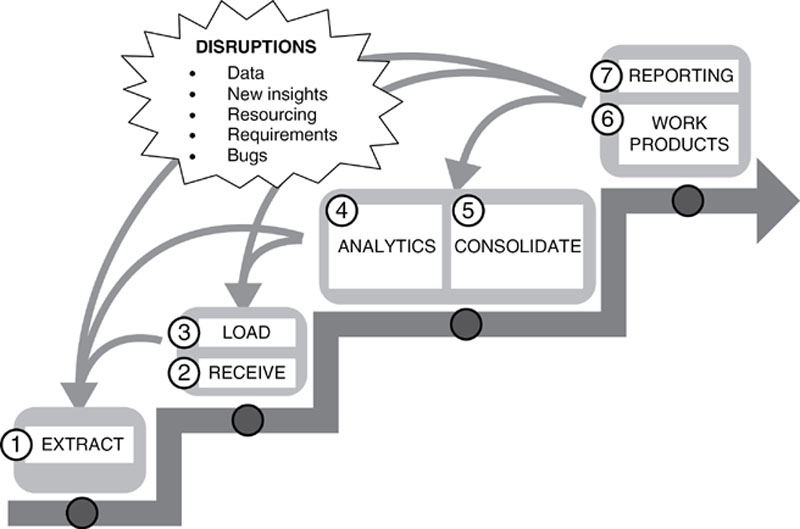
Figure 4 The Guerrilla Analytics workflow
Some characteristics of this process immediately stand out.
• Highly iterative: Because the project data is poorly understood initially, it is necessary to commence analysis with the available data and the current understanding of that data. Because the customer is typically working very closely with the analytics team there is frequent feedback and requests for changes to the analyses. This changes the reporting and work product requirements, which then drives new analytics or even requests for new data. Such change requests typically happen at any point in the Guerrilla Analytics workflow.
• People are involved: People are closely involved in the review of outputs and in data generation. Spreadsheets are often an unavoidable element of these projects as team members or customers mark up and modify outputs, which must then be fed back into the data environment.
• Dynamic data: These projects often have to begin and demonstrate progress before a definitive and verifiably correct dataset is available to the team. This means that the data is always changing. It is delivered piecemeal, replaced, and updated throughout the project. New data must feed into the analyses, but old data must also be preserved so that the impact on existing work products and understanding can be assessed. Guerrilla Analysts have to cope with this.
Despite these dynamics, Guerrilla Analytics projects often demand the following.
• Testing of analyses: Evidence of checking and testing of analyses is usually required. At the very least, the analytics work should be amenable to review and audit.
• Reproduction of analyses: Despite disruptions such as moving data and requirements, the team need to be able to preserve and reproduce any analysis.
At this point you are probably thinking this seems impossible. How can you possibly maintain visibility of your workings and reproducibility of your analyses with these constraints and disruptions and still get any work done?
This book aims to answer these questions. Before doing so, we will examine what specifically makes Guerrilla Analytics particularly difficult.
2.2. Challenges of managing analytics projects
We have seen how complex Guerrilla Analytics projects can become. This complexity can lead to the project team becoming overwhelmed. If the result is not a failure of the project it is at least a very stressful and chaotic experience for the team. To manage this, you need to first understand what makes Guerrilla Analytics projects so challenging. This section identifies and describes the following challenges. The way to address these challenges will be the subject of Part 2 of this book.
In terms of data, the challenges include:
• Tracking multiple data inputs
• Versioning multiple data inputs
• Tracking multiple data work products
• Working with data generated by people
• External data sources
Analysis done on this kind of data presents its own challenges.
• Version control of analytics
• Creating analytics that is reproducible
• Testing and reviewing analytics
• Foreign data environment
Managing a team in this environment involves:
• Upskilling a team quickly
• Reskilling a team quickly
The subsequent sections now examine these topics.
2.2.1. Tracking Multiple Data Inputs
Your team is receiving data from a variety of sources. These sources could be some or all of the following.
• Relational database extracts of database tables. These may arrive as refreshes of existing data every couple of weeks. There may be both additions to and corrections of existing data tables.
• Front-end reports from a variety of systems. Even a simple report can be produced with a variety of report generation options. Consider the simple act of printing an office document. You can adjust page sizes, optionally include comments, and optionally hide certain parts of the document.
• Web-scraped data. This must be tracked to a particular date and time of extraction because web pages are dynamic and can often change by the hour.
• Spreadsheets. Being spreadsheets, they have no clear version control apart from their file names, may contain embedded text boxes and images, and probably contain several sheets within a given workbook file. If spreadsheets are reviewed and marked up by an end user for inclusion in your team’s data, then you have additional problems of data quality and version tracking.
• Large numbers of unstructured data sources. Example includes email archives or document archives where documents are in a variety of file formats such as Microsoft Office and Adobe PDF.
The challenge is how to store and log receipt of these data sources and where to load them in the data environment so that their origins are easily identifiable. How can all of this be easily communicated to the team so that everybody can quickly find the right data with a minimum of documentation overhead?
2.2.2. Versioning Multiple Data Inputs
It is unavoidable that multiple versions of data will be issued to the team. Systems are live and so data needs to be updated during the course of the project. When mistakes are made in data deliveries, the data needs to be reissued with corrections. This is complicated when data can only be provided piecemeal because of resource constraints or the need to secure data release approvals. Meanwhile, spreadsheets of analyses are ongoing and need to be incorporated back into your DME at each revision.
How should these data versions be distinguished from one another? How should the team maintain older work products based on previous versions of the data but incorporate the new data into subsequent work products? Version control of data can get very complex. Which system is lightweight enough to deal with this complexity, but easy for a team to pick up and understand?
2.2.3. Tracking Multiple Data Work Products
Very early in the project, the analytics team will begin producing work products and issuing them to customers. Because Guerrilla Analytics projects are very dynamic, many work products will go through several iterations with the customer. During the course of these iterations, the underlying data itself can change for the reasons already discussed.
How should the team track these work products their iterations, the changes introduced in each iteration, and the impact of those changes? When a work product is returned to the team for discussion, modification, or correction, can the team easily and quickly determine how that work product was created, and where it is stored in their DME?
2.2.4. Data Generated by People
In a typical Guerrilla Analytics project, there will be data inputs from business users, accountants, analysts, and others. These people are not data analysts by trade, they do not benefit from the use of data analytics tools, and do not understand the complex nature of data.
Should this type of data be treated differently to data from warehouses and databases that have better controls? What additional checks should be put in place? How can you improve the interface between these team members and the DME?
2.2.5. External Data
The team will sometimes need to source external data. This could be data scraped from websites or it could be data from a third-party provider such as customer credit scores. These data sources present their own challenges because you are not working directly with the data provider in the same way as you are working with your customer. Websites change. External data providers have their own data formats and conventions that you must work with when you purchase their data.
How do you track and control such data sources? What do you do to maintain an efficient interface between these sources and your team’s own data work?
2.2.6. Version Control of Analytics
A key challenge for an analytics project is how to produce reproducible work products against moving data sources and changing business rules and requirements. Some type of version control is required so you can say that a particular work product was produced against a particular version of the data with a particular version of business rules and team understanding.
How do you implement sufficient version control against both program code and data without swamping the analytics team in cumbersome process and administrative overhead? What is a basic process you can implement in the event that version control software is not available to you? Do you archive away data or keep everything available for the lifetime of the project?
2.2.7. Creating Analytics that is Reproducible
All the team’s work products should be reproducible. That means you must know which versions of data, analytics code, analytics libraries, common custom code, and programming languages were combined to produce a version of a given work product. How do you do this in a lightweight manner that a team can understand and remember? Do you need to produce documentation with every work product? What about outputs such as spreadsheets, presentations, and reports? How do you maintain a link between a chart in a presentation and all the underlying code and data that created that particular chart? More difficult still, how do you do this for a single number that is quoted in a paragraph of text?
2.2.8. Testing and Reviewing Analytics
Even if a piece of analytics work can be reproduced, the work can typically involve many steps and the use of several tools. A team that has not worked together before will have different coding styles. There is much variety in the modularity with which data can be manipulated. You could have one analyst who uses one large piece of code, while another may break down the analysis into several smaller steps.
Is it clear what steps were taken in the analytics code? Can a reviewer of the work see the impact of analysis steps like filtering, deriving data fields, and removing records such as duplicates? How do you have confidence that the data has been correctly interpreted? How much modularity of the work is enough and how much is a burden on the team?
2.2.9. Foreign Data Environment
Very often, a Guerrilla Analytics team will find itself in a foreign data environment. By this I mean that their work will have to be done away from their home data lab on systems that belong to the customer. This is particularly true in forensic work, pre-sales work, and work with certain types of sensitive data such as employee and customer data. The customer will not want the data to leave their systems and so the analytics team must go to the data. Now the challenge is to produce analytics outside the team’s comfort zone of their familiar data environment. Perhaps version control software is not available. Perhaps workflow tracking software is not available. Perhaps the DME itself is from a vendor that the team are unfamiliar with.
In these circumstances, how does a team do the best it can to deliver? What are the minimum lightweight tools and processes it needs so that the team can get up and running quickly, and start demonstrating value add for the customer?
2.2.10. Upskilling a Team Quickly
Because resourcing is dynamic, it is quite likely that many of the team have not worked together before. Furthermore, even when you establish a team, you may find that some team members leave or are replaced during the course of the project. Teams are often of mixed skills including data scientists and statisticians, database developers, and web developers to name a few.
Assuming you can create a process and team rules to cover all of the aforementioned challenges, are these processes and rules easy for the team’s new joiners to pick up? How do you get to a minimal set of team guidelines so that the team can quickly upskill itself and remain agile and independent in the face of the challenges of the project environment?
2.2.11. Reskilling a Team Quickly
It is one thing to get a new team member up to speed quickly or have a handover of work run smoothly. However, on a busy and very dynamic project, even established team members’ knowledge of the project can go out of date. New data is arriving frequently. New interpretations of that data are being agreed and implemented in the DME. Other team members may be working on similar analyses.
How do you set up sufficient communication channels so that team members are kept abreast of these changes and updates? Where do you store this evolving knowledge?
2.3. Risks
Project risk is an uncertain event or condition that, if it occurs, has a positive or negative effect on one or more project objectives such as scope, schedule, cost, and quality.
Given the challenges of analytics projects just described, it is not surprising that so many are chaotic and stressful. These challenges introduce risks to delivery, the mitigation of which will be discussed in the rest of the book. These risks include the following.
• Losing the link between data received and its storage location
• Losing the link between raw data and data derived from raw during the analyst’s work
• Inability to reproduce work products because the original source datasets cannot be found or have been modified
• Inability to easily navigate the analytics environment because it is cluttered with stray files and datasets or is overly complex
• Conflicting changes to datasets
• Changes to raw data
• Out of date documentation misleads the team
• Failure to communicate updates to team knowledge
• Multiple copies of files and work products
• Fragmented code that cannot easily be executed without the author’s oversight
• Inability to identify the source of a dataset
• Lack of clarity around derivation of an analysis
• Multiple versions of tools and libraries in use but no way to know when a particular version was used
The next sections will elaborate on these risks and their effects, which you will hopefully recognize from your own project experiences and lessons learned.
2.3.1. Losing the Link Between Data Received and its Storage Location
This risk arises when data is stored in a variety of locations on the file system and imported into a variety of locations in the DME. This may happen because of time pressures, a lack of agreed guidelines, overwhelmingly complex guidelines, or simply laziness.
Figure 5 illustrates a folder structure that arises when a team is not managing this risk. There is no way to easily identify the sources of the datasets. Furthermore, data from various data sources has been mixed together. There are orphaned files and potentially duplicate files. Mapping this received data into the DME would be challenging.
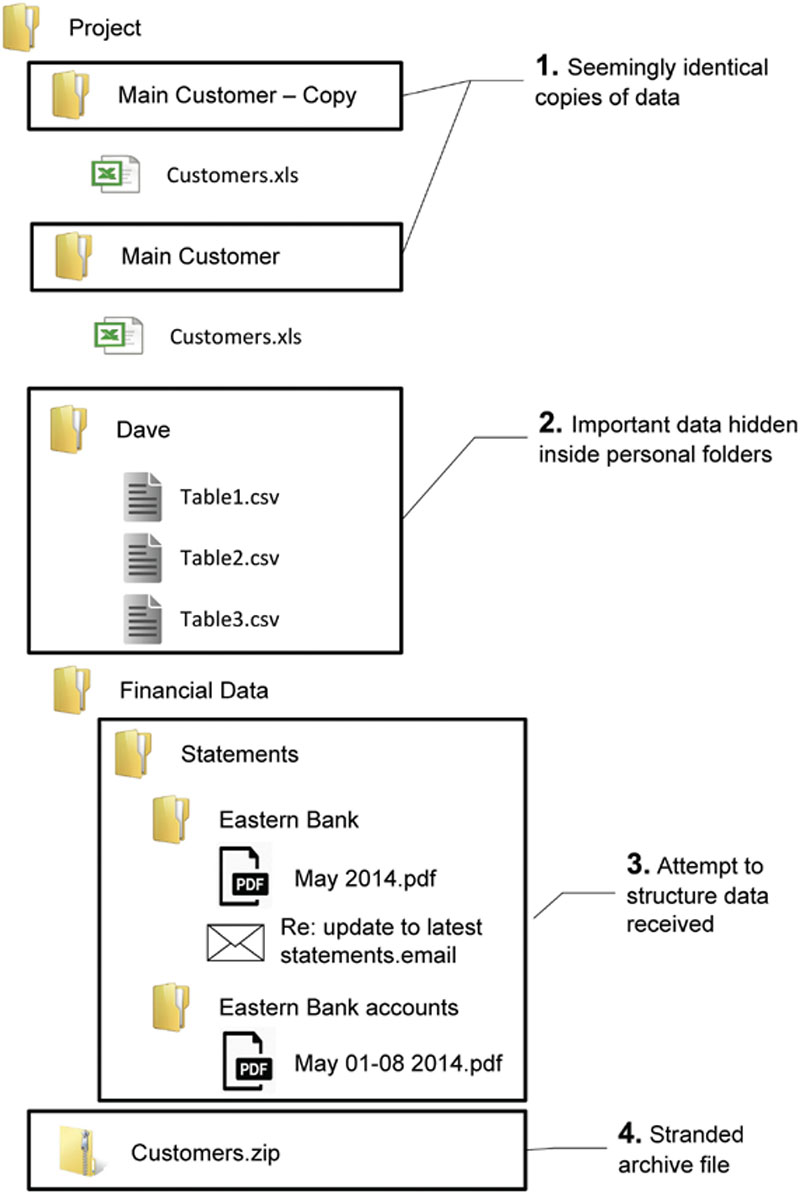
Figure 5 Losing the link between data received and its storage location
Effect: Source data cannot be identified and so any derived analyses are not fully traceable.
2.3.2. Losing the Link Between Raw Data and Derived Data
Your team will clean and manipulate raw data to produce “derived” data for every work product they create. This risk arises when the team cannot identify how derived data was created from raw data. In the typical project, lots of code is quickly written to get to a clean dataset with the required characteristics for analysis. The team then eagerly moves on to working out and delivering the analysis. However, during this process, the code files to clean and prepare the data are scattered and even lost.
Effect: Results cannot be easily reproduced and the team cannot confidently say whether a required business rule was applied.
2.3.3. Inability to Reproduce Work Products Because Source Datasets have Disappeared or been Modified
Time and again, teams move datasets after they have been imported into the DME. The reasons given are usually something to do with archiving away a result, making space for a data refresh, or replacement of an incorrect dataset.
Effect: Any modification or movement of a dataset has the potential to break an unknown number of data processes and work products that may already depend on that data source. These breakages may not be discovered until somebody tries to re-run code to reproduce a work product.
2.3.4. Inability to Easily Navigate the Analytics Environment
This risk arises because of a lack of discipline in where data and analyses are stored on the file system and in the DME.
Figure 6 shows a project structure you often encounter. The creators of this project folder structure meant well. They thought about everything that was happening in the project, they classified the activities, and then they implemented this classification in the project folder structure. However, the dynamic nature of a Guerrilla Analytics project means that there will never be one stable classification of project activities. Work streams that once looked separate will later merge. New tools will be introduced as a project need arises so a separation of “SQL analysis” does not make sense. Separation of data cleaning and data analytics means you cannot easily execute the end-to-end data flow. Finally, because data folders are not sensibly time-stamped it is difficult to determine the order in which data arrived with the team. The problems go on.
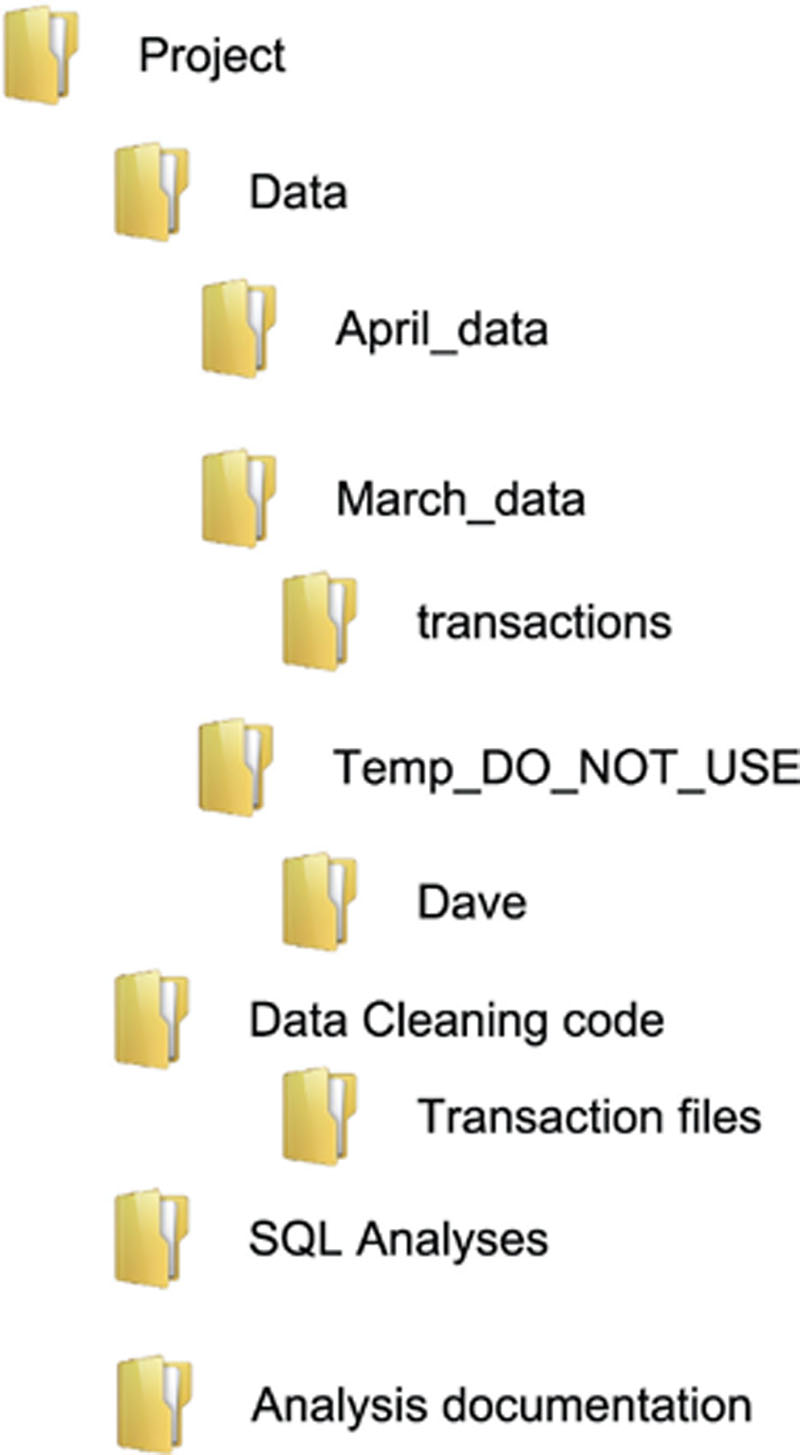
Figure 6 A complex project folder structure
Effect: An overly complex environment overwhelms analysts and defeats the purpose for which the complexity was introduced – being able to easily locate the data and analyses associated with a work product.
2.3.5. Conflicting Changes to Datasets
This risk arises when several analysts are working on the same datasets. One team member is producing a dataset that is to be used by other team members. This could be an analysis that the rest of the team are depending on or a convenience dataset that the analyst is providing to the rest of the team.
Effect: Without a clear process to separate datasets that are in development from datasets that have been released to the team, it is inevitable that users of these datasets are repeatedly interrupted. Users find that the dataset they need is either not available because it is being rebuilt, or its contents are in flux because its creator is in the middle of developing the dataset.
2.3.6. Changing of Raw Data
There is often a temptation to modify raw data when working under tight timelines. Typically this happens when a flaw is spotted in the data and it is considered quicker to edit a minor fix in the raw data rather than applying a data flow to repair the flaw. It is important to realize that all analyses derive from the raw data received by the team.
Effect: Changes to the raw data can break any number of work products based on that raw data in ways that may not be discovered for quite a while.
2.3.7. Out of Date Documentation Misleads the Team
One way that teams attempt to minimize the types of risks discussed so far is to better document their code and analytics. This is a good thing to aim for but is rarely practical. In a very dynamic environment it is quite likely that documentation will go out of date. Keeping pace with the fast-moving project introduces a significant administrative overhead on the team. The result is that documentation takes second priority to delivery.
Effect: Documentation rapidly goes out of data and actually misleads the team rather than helping them.
2.3.8. Failure to Communicate Updates to Team Knowledge
As the project progresses, there will be breakthroughs in understanding the data. New business rules will be discussed with the customer and implemented by the team. Fixes or modifications will be requested to existing analyses.
Effect: If these changes and requests are not communicated within the analytics team, work products may not be up to date with the latest knowledge and so are incorrect or contradictory. It reflects very poorly on a team that delivers two different interpretations of the same data.
2.3.9. Multiple Copies of Files and Work Products
It is natural for a work product to go through several iterations and versions. It is also common for a work product to have several components such as a report, analytics code, and perhaps a presentation to communicate the report’s findings. As each of these components is iterated, a workspace can quickly become cluttered with older and redundant files.
Figure 7 may look familiar. There are multiple copies of the same file or at least files with similar names. There seems to have been several occasions when a “final” version of a file was produced. An attempt was made at an overly complex version number of some of the analysis files. The work product folder sits in the root of the project alongside other similarly named folders.
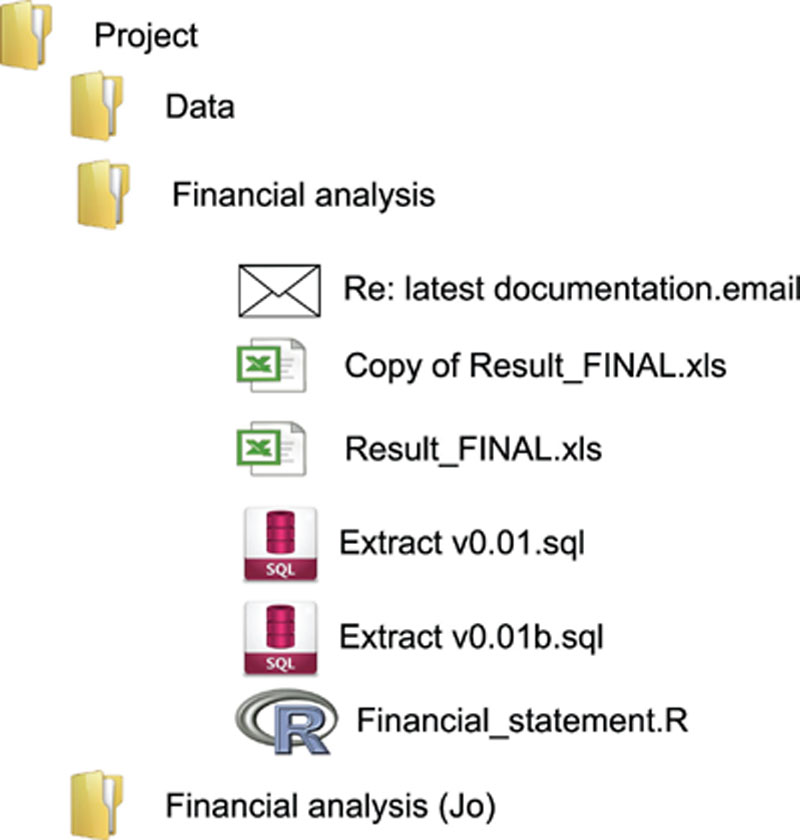
Figure 7 A confusing work product folder structure
Effect: Reviewers and anybody who inherits the work product will struggle to know which versions of which files are relevant to the delivered analysis.
2.3.10. Fragmented Code that Cannot be Executed Without the Author’s Input
Program code should execute from start to finish without interruption. This happens every time program code executes behind the scenes in the applications you use on your mobile device, desktop, etc. You do not need to be involved in what the program is doing. Analytics code often ends up different. Code files are written that must be executed under the supervision of a user, step by step, avoiding some steps and adjusting others. It is perhaps due to the nature of analytics coding, which involves summarizing and profiling data to understand how best to analyze it. It may also be due to a lack of analytics coding tools to allow easy refactoring and testing of code.
Whatever the reason, the result is a file of program code snippets, some of which are relevant to a work product and some of which are the analyst’s experimentations and learning about the data during the course of the work product’s development.
Effect: Fragmented analyses are time consuming to review and reproduce. The code cannot be executed without the guidance of the original author. If the author leaves the project, the specific knowledge of how to execute and reproduce the work product is lost.
2.3.11. Inability to Identify the Source of a Dataset
In traditional software engineering, it is relatively easy to jump between units of program code using a modern development environment. You can easily tell which piece of code calls another piece of code and navigate this “call hierarchy” through the code base. Analytics code is different. Analytics code is tightly coupled to the data because it changes the data it operates on. But code is usually held completely separately from the data. This makes it time consuming to investigate how a piece of data was created by one or more pieces of code. Keeping the link between data and the code that generated the data is critical.
Effect: The DME becomes cluttered with datasets of unknown origin that the team is afraid to delete. These make it difficult to navigate to the datasets that actually matter in the project.
2.3.12. Lack of Clarity Around Derivation of an Analysis
This risk arises when a data flow does not have a clear breakdown of the critical data manipulations into modular steps. It occurs for two main reasons.
The first is that much analytics involves the use of multiple tools. You may have to manipulate some data with a language like SQL, for example. You may then have to visualize this data in a spreadsheet. Finally you may produce a number that appears in the text of a written report. Without a clear connection between these components of the analysis, it is difficult to find where a particular data manipulation occurred or a filter was applied.
The second source of this risk is that analysts often try to do too much too quickly. That is, several data steps are combined into a single big data step. The reason given is to save storage space in the data environment or to improve the efficiency of analytics code and save time. The challenge here is to balance the need for space and speed with the clarity of the steps taken to produce an analysis.
Effect: If more time is spent trying to unravel and understand an analysis, then it would have made more sense to break down that analysis into manageable data steps in the first instance.
2.3.13. Multiple Versions of Tools and Libraries
There are various factors that influence an analytics output including the version of raw data, version of program code, and the application of business rules. A factor that is often overlooked is the tools and libraries that are used by the analytics code. Perhaps the analytics code uses version 2.7 of a language in combination with version 8.1 of a third-party library. If a team is working in a dynamic environment and is under pressure to solve problems, they will likely need various versions of languages and libraries.
Effect: Not being clear on which versions of a language and a helper program library are being used in an analytics work product can result in a work product that cannot be reproduced.
2.4. Impact of failure to address analytics risks
The failure to address some or all of these analytics risks has many adverse effects on the analytics project.
With any of these risks you increase the likelihood that the team’s analytics outputs are incorrect, contradictory, or inconsistent. There is also a detrimental effect on team efficiency. The team spends a disproportionate amount of time trying to communicate their work to one another, find their own data, and reproduce their own analyses. In terms of reviewing, managers and reviewers require a detailed description of a work product from its author before they can begin. Team members struggle to handover work and so rolling off and onto the project is unnecessarily difficult. Team members can get left behind in terms of the latest changes in the DME because new versions of data knowledge are not communicated effectively.
Failure to address these risks leads to environment inefficiency. If there is no confidence in the source of datasets and no identification of raw data, then datasets are generally kept lying around in case they are needed in the future. This eventually leads to a cluttered environment that everybody is afraid to modify and struggles to navigate.
Overall, stress and frustration ensue. The team is working hard and doing their best for the customer, but appear to be forever chasing their own tail trying to understand and trace their own data and their own work products.
If you are to deliver a Guerrilla Analytics project successfully and minimize unnecessary stress and chaos, you need a way to mitigate these risks. This is where you need the Guerrilla Analytics Principles.
2.5. Wrap up
In this chapter you learnt about the challenges of a Guerrilla Analytics project and the risks introduced by these challenges. This chapter has covered the following.
• We described the Guerrilla Analytics workflow and distinguished it from the analytics workflow described by CRISP-DM.
• We saw how at every stage of the Guerrilla Analytics workflow, data provenance is threatened by the dynamic nature of the Guerrilla Analytics project and the constraints placed on the team.
• We described the typical challenges involved in managing Guerrilla Analytics projects.
• We looked at the risks to the project that arise because of those challenges.
• We finished by describing the detrimental impact of failing to manage a Guerrilla Analytics project’s risks.
..................Content has been hidden....................
You can't read the all page of ebook, please click here login for view all page.