
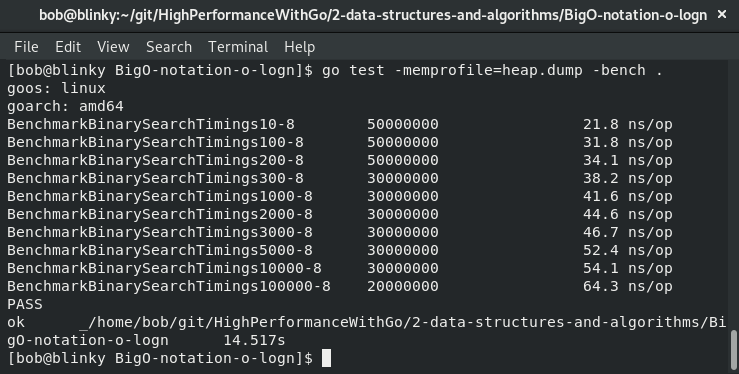
We can perform similar actions to the CPU testing that we did in the previous section with memory. Let's take a look at another method to handle profiling, using the testing functionality. Let's use an example that we created back in Chapter 2, Data Structures and Algorithms—the o-logn function. We can use the benchmark that we have already created for this particular function and add some memory profiling to this particular test. We can execute the go test -memprofile=heap.dump -bench command.
We will see a similar output to what we saw in Chapter 2, Data Structures and Algorithms:
The only difference is that now we'll have the heap profile from this test. If we view it with the profiler, we'll see data about the heap usage rather than the CPU usage. We'll also be able to see the memory allocation for each of our functions in that program. The following diagram illustrates this:
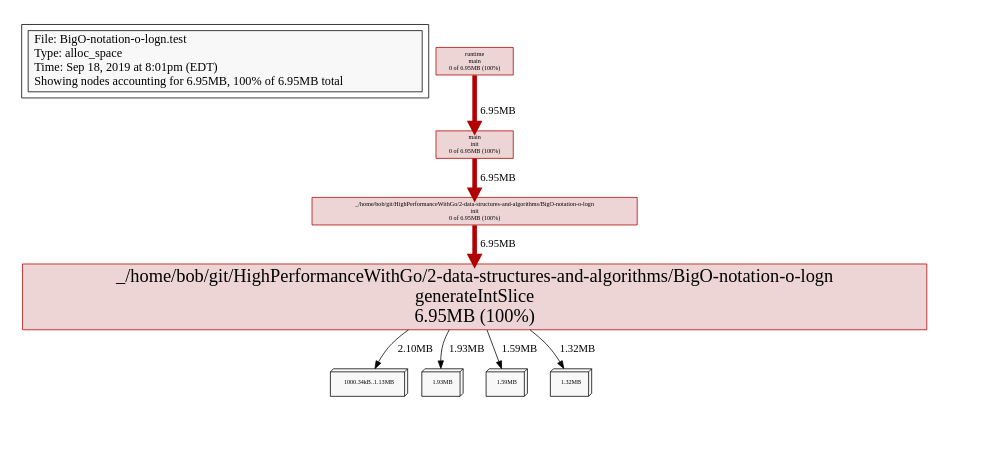
This is helpful, as it enables us to see the generated heap sizes for each of the parts of this code. We can also take a look at the top cumulative memory allocations:

As our programs grow more complex, being able to understand the state of the memory utilization becomes more and more important. In the next section, we will discuss how to extend our profiling capabilities with upstream pprof.