
As discussed in the Memory object allocation section of Chapter 8, Memory Management in Go, we have a myriad of tools at our disposal to view the current memory statistics for our currently executing program. In this chapter, we will also learn about profiling using the pprof tool. One of the more common Go memory leaks is the unbounded creation of goroutines. This happens frequently when you overload an unbuffered channel or you have an abstraction with a lot of concurrency spawning new goroutines that don't finish. Goroutines have a very small footprint and systems can often spawn a very large number of them, but they eventually have an upper bound that becomes taxing to find when trying to troubleshoot your program in a production environment.
In the following example, we are going to look at an unbuffered channel that has a leaky abstraction:
- We start by initializing our package and importing our necessary dependencies:
package main

import (
 "fmt"
 "net/http"

 _ "net/http/pprof"
 "runtime"
 "time"
)
- In our main function, we handle HTTP listening to and serving the leakyAbstraction function. We are serving this over HTTP in order to make it simple to see the number of goroutines grow:
func main() {
 http.HandleFunc("/leak", leakyAbstraction)
 http.ListenAndServe("localhost:6060", nil)
}
- In our leakyAbstraction function, we first initialize an unbuffered string channel. We then endlessly iterate through a for loop, writing the number of goroutines to the HTTP response writer and writing the result of our wait() function to the channel:
func leakyAbstraction(w http.ResponseWriter, r *http.Request) {
 ch := make(chan string)

 for {
   fmt.Fprintln(w, "Number of Goroutines: ", runtime.NumGoroutine())
   go func() { ch <- wait() }()
 }
}
- Our wait() function sleeps for five microseconds and returns a string:
func wait() string {
 time.Sleep(5 * time.Microsecond)
 return "Hello Gophers!"
}
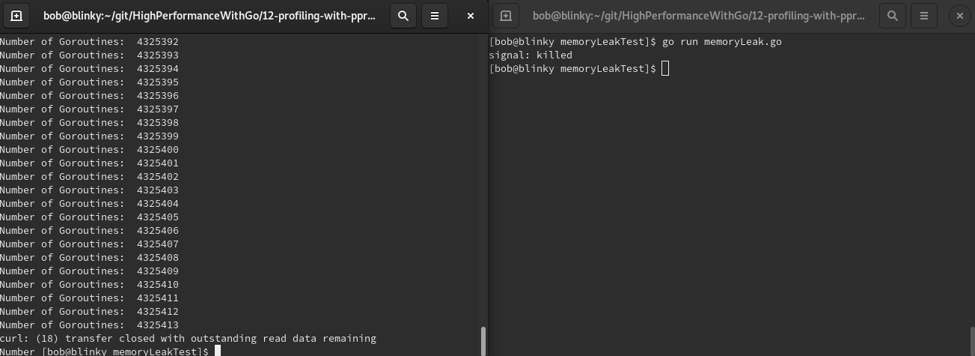
These functions together will spawn goroutines until the runtime is no longer able to do so and dies. We can test this by running our server by executing the following command:
go run memoryLeak.go
After the server is running, in a separate Terminal window, we can make a request to our server with the following command:
curl localhost:6060/leak
The curl command will print the number of goroutines generated until the server is killed:
Using the techniques we learn in this chapter, we will be able to further debug memory issues like this one with pprof, but understanding the underlying problems will help us to avoid memory issues.
This example was written in order to explicitly show a memory leak, but if we wanted to make this executable not leak goroutines, we'd have to fix two things:
- Our unbounded for loop should most likely have a bound
- We could add a buffered channel in order to make sure we have the ability to process all the spawned goroutines that come in through the channel