
Using the classic WASD movement keys (inspired by lots of first-person role-playing video games), we can move around the trace. The movement keys are described as follows:
- The W key zooms into the trace's timing window.
- The S key zooms out.
- The A key goes backward in time.
- The D key moves forward in time. We can also go backward and forward in time by clicking and dragging the mouse.
Using the mouse pointer selector or clicking on the number keys allows us to manipulate timing information. The keypad changes are listed in the following bullet points:
- The 1 key lets us select the part of the trace that we'd like to inspect
- The 2 key allows us to pan
- The 3 key invokes the zoom functionality
- The 4 key allows us to select a specific timing
We can now use the / key to search through the trace and the Enter key to step through the results.
We also have file-size stats, metrics, frame data, and input latency windows that are available on the right-hand side of the screen. When clicked, these buttons will open a popup that will tell you more details about each of these particular statistics within the trace.
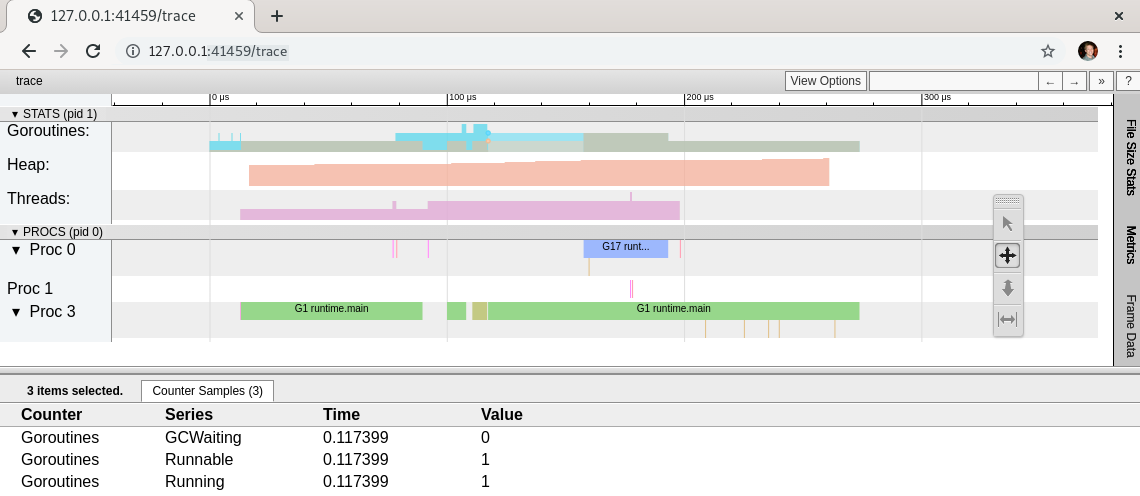
If we click on the blue area in the goroutines row in the trace, we can take a look at some of the available stats we have for our goroutines:
- The GCWaiting, which is the amount of garbage collection runs that are waiting (currently with a value of 0)
- The number of runnable goroutines (currently with a value of 1)
- The number of running goroutines (currently with a value of 1)
We can see a sampling of the available stats for our goroutines in the following screenshot:
The goroutine information can be helpful for the end user debugging the program. Watching goroutines in the Go trace tool can help us to determine when a goroutine is fighting for contention. It may be waiting on a channel to clear, it might be blocked by a syscall, or it might be blocked by the scheduler. If there are many goroutines in a waiting state, that means the program might be creating too many goroutines. This could cause the scheduler to be overallocated. Having access to all of this information can help us to make an informed decision on how to better write our program to utilize goroutines more effectively.
Clicking on the orange bar in the Heap row will display the heap information:
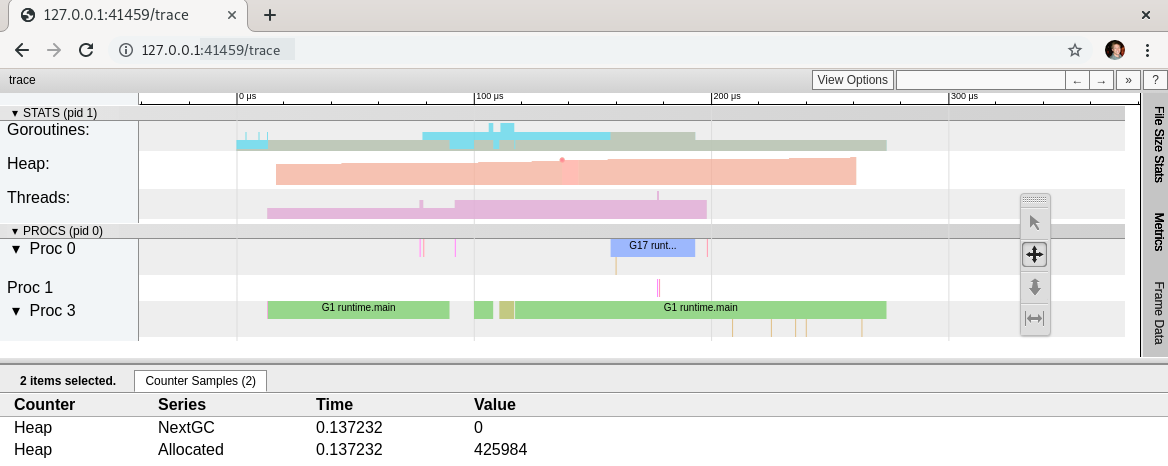
At the time selected (0.137232), we can see that we have 425984 bytes, or approximately 425 KB, allocated to the heap. Knowing the amount of memory currently allocated to the heap can tell us whether or not we have memory contention in our program. Profiling (as we learned in Chapter 12, Profiling Go Code) is usually a better methodology for looking at heap information, but having a general understanding of the allocation within the trace context can often be helpful.
We can look at the thread information next. Clicking on an active thread (the magenta block in the Threads row of the trace) will show you the number of threads in InSyscall and Running states:
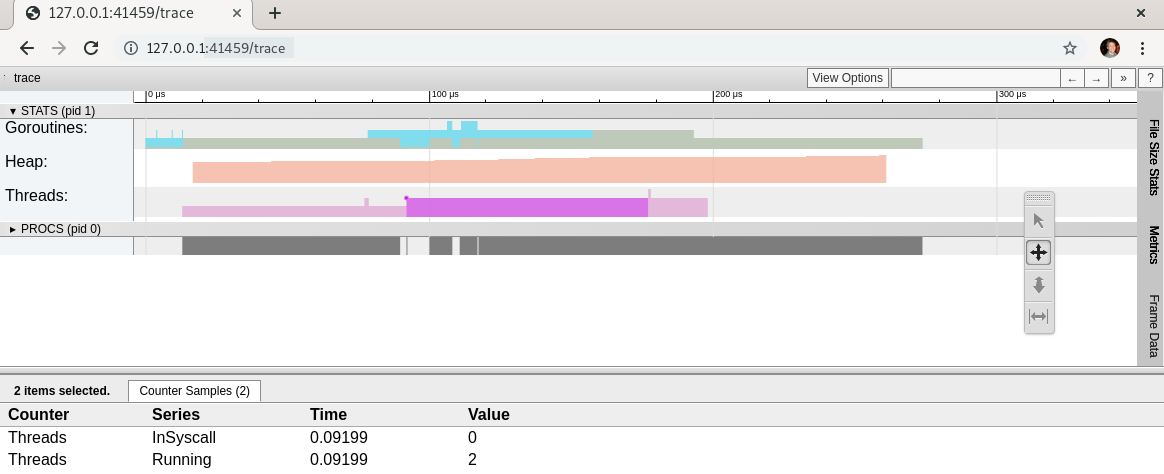
It can be helpful to know the number of OS threads that are running and how many are currently being blocked by syscalls.
Next, we can take a look at each of the individual processes running. Clicking on the process will tell you all of the details that are shown in the following screenshot. If you hover over one of the events at the bottom pane of the trace, you will be able to see how the processes are tied together, denoted by the red arrow in the following screenshot:
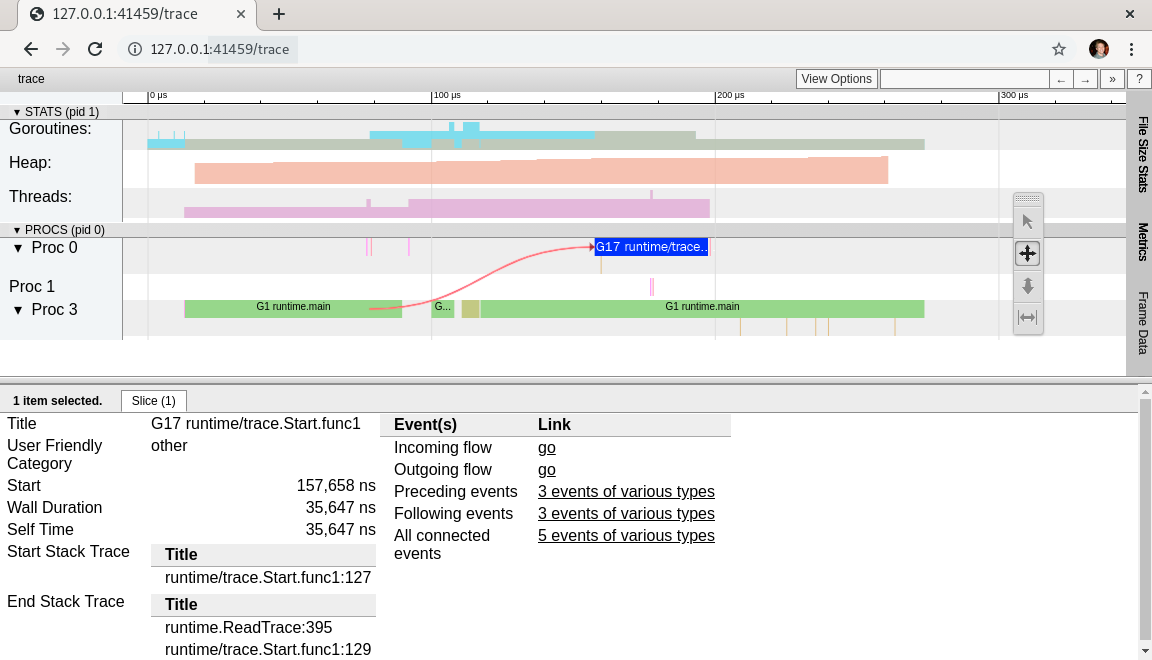
Knowing the end-to-end flow of your processes can often help you diagnose problem processes. In the next section, we'll learn how to explore pprof-like traces.