
Chapter 20: Scene Performance Optimization
Welcome to the third part of this book—I am glad you have reached this part as it means that you have almost completed a full game! In this chapter, we are going to discuss optimization techniques to review your game's performance and improve it, as having a good and constant frame rate is vital to any game. Performance is a broad topic that requires a deep understanding of several Unity systems and could span several books. We are going to look at how to measure performance and explore the effects of our changes to systems to learn how they work through testing.
In this chapter, we will examine the following performance concepts:
- Optimizing graphics
- Optimizing processing
- Optimizing memory
By the end of this chapter, you will be able to gather performance data on the three main pieces of hardware that run your game—the GPU, CPU, and RAM. You will be able to analyze that data to detect possible performance issues and understand how to solve the most common ones.
Optimizing graphics
The most common cause of performance issues is related to the misuse of assets, especially on the graphics side, due to not having enough knowledge of how Unity's graphic engines work. We are going to explore how a GPU works at a high level and how to improve its usage.
In this section, we will examine the following graphics optimization concepts:
- Introduction to graphic engines
- Using the Frame Debugger
- Using batching
- Other optimizations
We will start by looking at a high-level overview of how graphics are rendered to better understand the performance data that we will gather later in the Frame Debugger. Based on the debugger's results, we are going to identify the areas that we can apply batching to (which is a technique to combine the rendering process of several objects, reducing its cost), along with other common optimizations to keep in mind.
Introduction to graphic engines
Nowadays, every gaming device, whether it is a computer, a mobile device, or a console, has a video card—a set of hardware that specializes in graphics processing. It differs from a CPU in a subtle but important way. Graphics processing involves the processing of thousands of mesh vertices and the rendering of millions of pixels, so the GPU is designed to run short programs for a massive length of time, while the CPU can handle programs of any length but with limited parallelization capabilities. The reason for having those processing units is so that our program can use each one when needed.
The problem here is that graphics don't just rely on the GPU. The CPU is also involved in the process, making calculations and issuing commands to the GPU, so they must work together. For that to happen, both processing units need to communicate, and because they are (usually) physically separated, they need another piece of hardware to allow this—a bus, the most common type being the Peripheral Component Interconnect Express (PCI Express) bus.
PCI Express is a type of connection that allows massive amounts of data to be moved between the GPU and CPU, but the problem is that even though it's very fast, the communication time can be noticeable if you issue a lot of commands between both units. So, the key concept here is that graphics performance is improved mainly by reducing the communications between the GPU and CPU:
2

Figure 20.1 – CPU/GPU communication through a PCI Express bus
Important note
Nowadays, new hardware architecture allows the CPU and GPU to coexist in the same chipset, reducing communication time and even sharing memory. Sadly, that architecture doesn't allow the necessary processing power needed for video games. It is possible that we will only see it applied to high-end gaming, but not in the near future, or even ever.
The basic algorithm of a graphics engine is to determine which objects are visible using culling algorithms, sorting and grouping them according to their similarities, and then issuing drawing commands to the GPU to render those groups of objects, sometimes more than once (as in Chapter 8, Lighting Using the Universal Render Pipeline). Here, the main form of communication is those drawing commands, usually called draw calls, and our main task when optimizing graphics is to reduce them as much as we can. The problem is that there are several sources of draw calls that need to be considered, such as the lighting, the scale of objects to see whether they are static or not, and so on. Studying every single one of them would take a long time, and even so, new versions of Unity can introduce new graphic features with their own draw calls. Instead, we will explore a way to discover these draw calls using the Frame Debugger.
Using the Frame Debugger
The Frame Debugger is a tool that allows us to see a list of all the drawing commands or draw calls that the Unity rendering engine sends to the GPU. It not only lists them but also provides information about each draw call, including the data needed to detect optimization opportunities. By using the Frame Debugger, we can see how our changes modify the number of draw calls, giving us immediate feedback on our efforts.
Important Note
Note that reducing draw calls is sometimes not enough to improve performance, as each draw call can have different processing times; but usually, that difference is not big enough to consider. Also, in certain special rendering techniques, such as ray tracing or ray marching, a single draw call can drain all of our GPU power. This won't be the case in our game, so we won't take that into account right now.
Let's use the Frame Debugger to analyze the rendering process of our game by doing the following:
- Open the Frame Debugger (Window | Analysis | Frame Debugger).
- Play the game and if you want to analyze the performance, click the Enable button in the top-left corner of the window (press Esc to regain control of the mouse while playing):

Figure 20.2 – Enabling the Frame Debugger
- Click on the Game tab to open the Game view.
Important note:
Sometimes, it is useful to have both the Scene and Game panels in sight, which you can accomplish by dragging one of them to the bottom of Unity to have them separated and visible.
- Drag the slider to the right of the Disable button slowly from left to right to see how the scene is rendered. Each step is a draw call that is executed in the CPU for that given game frame. You can also observe how the list in the left part of the window highlights the name of the executed draw call at that moment:

Figure 20.3 – Analyzing our frame's draw calls
- Click on any draw call from the list and observe the details in the right part of the window.
Most of them can be confusing to you if you are not used to code engines or shaders, but you can see that some of them have a human-readable part called Why this draw call can't be batched with the previous one, which tells you why two objects weren't drawn together in a single draw call. We will examine those reasons later:

Figure 20.4 – The batching break reasons in the Frame Debugger
- With the window open in Play mode, disable the terrain and see how the amount of draw calls changes immediately. Sometimes, just turning objects on and off can be enough to detect what is causing performance issues. Also, try disabling postprocessing and other graphics-related objects, such as particles.
Even if we are not fully aware of where each one of these draw calls came from, we can at least start by modifying the settings throughout Unity to see the impact of those changes. There's no better way of discovering how something as massive as Unity works than going through every toggle and seeing the impact of those changes through a measuring tool.
Now, let's discuss the basic techniques for reducing draw calls and see their effects in the Frame Debugger.
Using batching
We discussed several optimization techniques in previous chapters, with lighting being the most important one. If you measure the draw calls as you implement the techniques, you will notice the impact of those actions on the draw call count. However, in this section, we will focus on another graphics optimization technique, known as batching. Batching is the process of grouping several objects to draw them together in a single draw call. You may be wondering why we can't just draw everything in a single draw call, and while that is technically possible, there is a set of conditions that need to be met in order to combine two objects, the usual case being combining materials.
Remember that materials are assets that act as graphic profiles, specifying a Material mode or Shader and a set of parameters to customize the aspect of our objects, and remember that we can use the same material in several objects. If Unity has to draw an object with a different material than the previous one, a SetPass call needs to be called before issuing its draw call, which is another form of CPU/GPU communication used to set the Material properties in the GPU, such as its textures and colors. If two objects use the same materials, this step can be skipped. The SetPass call from the first object is reused by the second, and that opens the opportunity to batch the objects. If they share the same settings, Unity can combine the meshes into a single one in the CPU, and then send the combined mesh in a single draw call to the GPU.
There are several ways to reduce the number of materials, such as removing duplicates, but the most effective way is through a concept called texture atlasing. This means merging textures from different objects into a single one. This way, several objects can use the same material due to the fact that the texture used there can be applied to several objects and an object that has its own texture requires its own material. Sadly, there's no automatic system in Unity to combine the textures of three-dimensional objects, such as the Texture Atlas object we used in 2D. There are probably some systems in the Asset Store, but automatic systems can have several side effects. This work is usually done by an artist, so just keep this technique in mind when working with a dedicated 3D artist (or if you are your own artist):
Figure 20.5 – Pieces of different metallic objects
Let's explore batching with Frame Debugger by doing the following:
- Search for the Render Pipeline asset that we currently want to use (Edit | Project Settings | Graphics | Scriptable Render Settings):
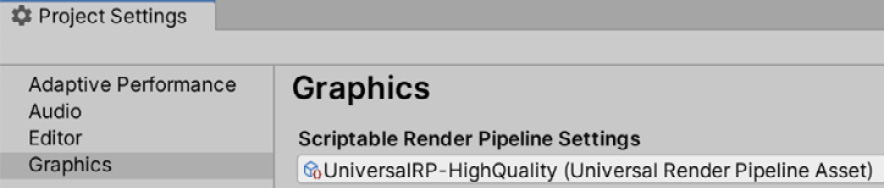
Figure 20.6 – Scriptable Render Pipeline settings
- Uncheck SRP Batcher in the Advanced section and check Dynamic Batching. We will discuss this later:
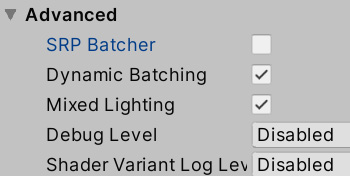
Figure 20.7 – Disabling SRP Batcher
- Create a new empty scene for testing (File | New Scene).
- Create two materials of different colors.
- Create two cubes and put one material into the first and the other into the second.
- Open the Frame Debugger and click Enable to see the call list for the draw calls of our cubes:

Figure 20.8 – The draw calls for the cubes
- Select the second Draw Mesh Cube call and look at the batch-breaking reason. It should say that the objects have different materials.
- Use one of the materials on both cubes and look at the list again. You will notice that now we just have one Draw Mesh Cube call. You might need to disable and enable the Frame Debugger again for it to refresh properly.
Now, I challenge you to try the same steps but to create spheres instead of cubes. If you do that, you will probably notice that even with the same materials, the spheres are not batched! Here is where we need to introduce the concept of dynamic batching.
Remember that GameObjects have a Static checkbox, which serves to notify several Unity systems that the object won't move so that they can apply several optimizations. Objects that don't have this checkbox checked are considered dynamic. So far, the cubes and spheres we used for our tests have been dynamic, so Unity needed to combine them in every frame because they can move and combining is not "free." Its cost is associated directly with the number of vertexes in the model. You can get the exact numbers and all the required considerations from the Unity manual, which will appear if you search Unity Batching. However, it is enough to say that if the number of vertexes of an object is big enough, that object won't be batched, and doing so would require more than issuing two draw calls. That's why our spheres weren't batched; a sphere has too many vertices.
Now, things are different if we have static objects because they use a second batching system—the static batcher. The concept of this is the same: merge objects to render them in one draw call, and again these objects need to share the same material. The main difference is that this batcher will batch more objects than the dynamic batcher because the merging is done once, at the time that the scene loads, and is then saved in memory to use in the next frames, costing memory but saving lots of processing time each frame. You can use the same approach we used to test the dynamic batcher to test the static version just by checking the Static checkbox of the spheres this time and seeing the result in Play mode; in Edition mode (when it is not playing), the static batcher won't work:
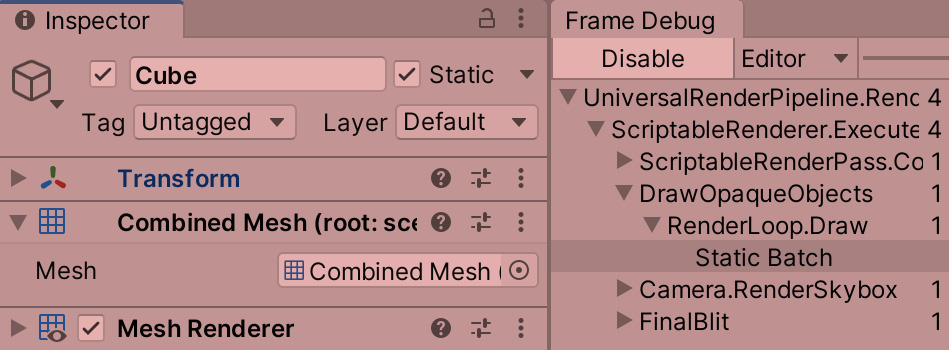
Figure 20.9 – A static sphere and its static batch
Before moving on, let's discuss why we disabled SRP Batcher and how that changes what we just discussed. In its 2020 edition, Unity introduced the URP (Universal Render Pipeline), a new Render Pipeline. Along with several improvements, one that is relevant right now is SRP Batcher, a new batcher that works on dynamic objects with no vertex or material limits (but with other limits). Instead of relying on sharing the same material with batch objects, SRP Batcher can have a batch of objects with materials that use the same Shader, meaning we can have, for example, 100 objects with 100 different materials for each one, and they will be batched regardless of the number of vertexes, as long as the materials use the same Shader and Variant:

Figure 20.10 – GPU data persistence for materials, which allows SRP Batcher to exist
One Shader can have several versions or Variants, and the selected Variant is chosen based on the settings. We can have a Shader that doesn't use normal mapping and a Variant that doesn't calculate normals will be used, so that can affect SRP Batcher. So, there's basically no drawback to using SRP Batcher, so go ahead and turn it on again. Try creating lots of spheres with as many materials as you can and check the number of batches it will generate in the Frame Debugger. Just consider that if you need to work on a project done in a pre-URP era, this won't be available, so you will need to know the proper batching strategy to use.
Other optimizations
As mentioned before, there are lots of possible graphics optimizations, so let's discuss briefly the basic ones, starting with Level of Detail (LOD). LOD is the process of changing the mesh of an object based on its distance from the camera. This can reduce draw calls if you replace, for example, a house with several parts and pieces with a single combined mesh with reduced detail when the house is far away. Another benefit of using LOD is that you reduce the cost of a draw call because of the reduction in the vertex count.
To use this feature, do the following:
- Create an empty object and parent the two versions of the model. You need to use models that have several versions with different levels of detail, but for now, we are just going to test this feature using a cube and a sphere:

Figure 20.11 – A single object with two LOD meshes
- Add an LOD group component to the parent.
- The default LOD group is prepared to support three LOD mesh groups, but as we only have two, right-click on one and click Delete. You can also select Insert Before to add more LOD groups:
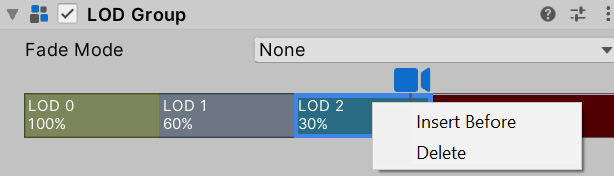
Figure 20.12 – Removing an LOD group
- Select LOD 0, the highest-detail LOD group, and click on the Add button in the Renderers list below this to add the sphere to that group. You can add as many mesh renderers as you want.
- Select LOD 1 and add the cube:
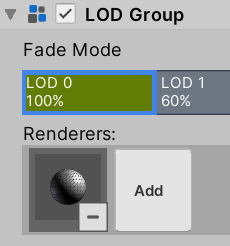
Figure 20.13 – Adding renderers to LOD groups
- Drag the line between the two groups to control the distance range that each group will occupy. As you drag it, you will see a preview of how far the camera needs to be to switch groups. Also, you have the culled group, which is the distance from where the camera will not render any group.
- Just move the camera around in Edit mode to see how the meshes are swapped.
- Something to consider here is that the colliders of the objects won't be disabled, so just have the renderers in the LOD sub-objects. Put the collider with the shape of the LOD 0 in the parent object, or just remove the colliders from the LOD group objects, except group 0.
Another optimization to consider is frustum culling. By default, Unity will render any object that falls into the view area or frustum of the camera, skipping the ones that don't. The algorithm is cheap enough to always use, and there's no way to disable it. However, it does have a flaw. If we have a wall hiding all the objects behind it, even if they are occluded, they fall inside the frustum, so they will be rendered anyway. Detecting whether every pixel of a mesh occludes every pixel of the other mesh is almost impossible to do in real time, but luckily, we have a workaround: occlusion culling.
Occlusion culling is a process that analyzes a scene and determines which objects can be seen in different parts of the scene, dividing them into sectors and analyzing each one. As this process can take quite a long time, it is done in the editor, as is done with lightmapping. As you can imagine, it only works on static objects. To use it, do the following:
- Mark the objects that shouldn't move as static, or if you only want this object to be considered static for the occlusion culling system, check the Occluder Static and Ocludee Static checkboxes of the arrow to the right of the Static checkbox.
- Open the Occlusion Culling window (Window | Rendering | Occlusion Culling).
- Save the scene and hit the Bake button at the bottom of the window, and then wait for the baking process. If you don't save the scene before the baking process, it won't be executed.
- Select the Visualization tab in the Occlusion Culling window.
- With the Occlusion Culling window visible, select the camera and drag it around, seeing how objects are occluded as the camera moves:

Figure 20.14 – On the left is the normal scene and on the right is the scene with occlusion culling
Take into account that if you move the camera outside the calculated area, the process won't take place, and Unity will only calculate areas near the static objects. You can extend the calculation area by creating an empty object and adding an Occlusion Area component, setting its position and size to cover the area that the camera will reach, and finally, rebaking the culling. Try to be sensible with the size of the cube. The larger the area to calculate, the larger the space needed in your disk to store the generated data. You can use several of these areas to be more precise—for example, in an L-shaped scene, you can use two of them:
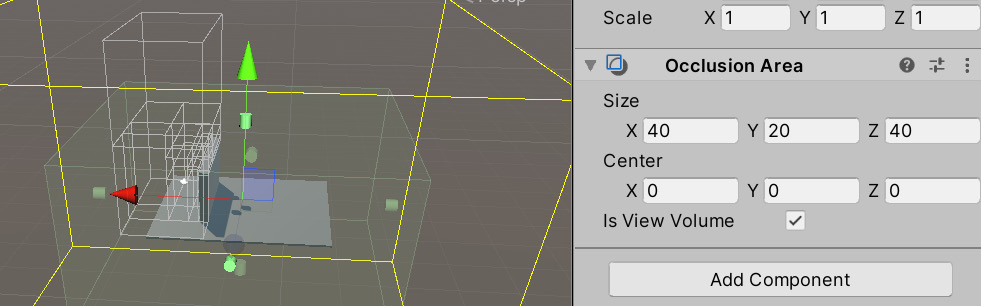
Figure 20.15 – Occlusion Area
If you see that the objects are not being occluded, it could be that the occluder object (the wall in this case) is not big enough to be considered. You can increase the size of the object or reduce the Smallest Occluder setting in the Bake tab of the window. Doing that will subdivide the scene further to detect small occluders, but that will take more space in the disk to store more data. So again, be sensible with this setting.
There are still some more techniques that we can apply to our game, but the ones we have discussed are enough for our game. So, in this section, we learned about the process of rendering graphics in a video card, the concept of batch, how to profile them to know exactly how many of them we have and what they are doing, and finally, how to reduce them as much as we can. Now, let's start discussing other optimization areas, such as the processing area.
Optimizing processing
While graphics usually take up most of the time that a frame needs to be generated, we should never underestimate the cost of badly optimized code and scenes. There are several parts of the game that are still calculated in the CPU, including part of the graphics process (such as the batching calculations), Unity Physics, audio, and our code. Here, we have a lot more causes of performance issues than on the graphics side, so again, instead of discussing every optimization, let's learn how to discover them.
In this section, we will examine the following CPU optimization concepts:
- Detecting CPU- and GPU-bound
- Using the CPU Usage Profiler
- General CPU optimization techniques
We will start by discussing the concepts of CPU and GPU bound, which focus on the optimization process, determining whether a problem is GPU or CPU related. Later, as with the GPU optimization process, we will look at how to gather the performance data of the CPU and interpret it to detect possible optimization techniques to be applied.
Detecting CPU- and GPU-bound
As with the Frame Debugger, the Unity Profiler allows us to gather data about the performance of our game through a series of Profiler modules, each one designed to gather data about different Unity systems per frame, such as Physics, audio, and most importantly, CPU usage. This last module allows us to see every single function that Unity called to process the frame—that is, from our script's executed functions to other systems, such as Physics and graphics.
Before exploring the CPU usage, one important bit of data that we can gather in this module is whether we are CPU or GPU bound. As explained before, a frame is processed using both the CPU and GPU, and those pieces of hardware can work in parallel. While the GPU is executing drawing commands, the CPU can execute Physics and our scripts in a very efficient way. But now, let's say that the CPU finishes its work while the GPU is still working. Can the CPU start to work on the next frame? The answer is no. This would lead to de-synchronization, so in this scenario, the CPU would need to wait. This is known as being CPU bound, and we have also the opposite case, GPU bound, when the GPU finishes earlier than the CPU.
Important note:
It is worth mentioning that on mobile devices, it is sometimes preferable to reduce the framerate of our game to reduce battery consumption, making the game idle for a moment between frames, but that could lead to a slower response in our commands and input. To solve that, Unity has created a package that adds the ability to skip the rendering process after a configurable number of frames, which keeps the processing working but skips rendering. So, naturally, those frames will be CPU bound only.
It is important to concentrate our optimization efforts, so if we detect that our game is GPU bound, we will focus on GPU graphics optimization, and if it is CPU bound, then we will focus on the rest of the systems and the CPU side of graphics processing. To detect whether our game is one or the other, do the following:
- Open Profiler (Window | Analysis | Profiler).
- In the Profiler Modules dropdown in the top-left corner, check GPU Usage to enable the GPU profiler:
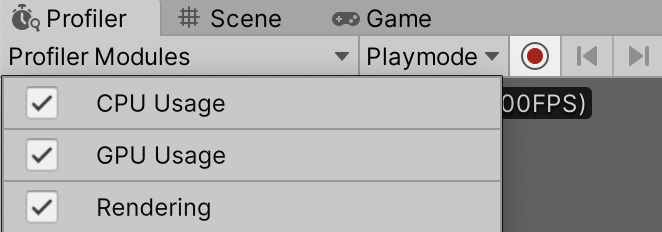
Figure 20.16 – Enabling the GPU profiler
- Play the game and select the CPU Usage profiler, clicking on its name in the left part of the Profiler window.
- Click the Last Frame button – the one with the double arrow pointing to the right, to always display the info of the last frame being rendered:

Figure 20.17 – The last frame button (double arrow to the right)
- Also click the Live button to enable the Live mode, which allows you to see the results of profiling in real time. This can have an impact on performance, so you can disable it later:

Figure 20.18 – Enabling Live mode
- Observe the bar with the CPU and GPU labels in the middle of the window. It should say how many milliseconds are being consumed by the CPU and GPU. The one with the higher number will be the one that is limiting our framerate and will determine whether we are GPU or CPU bound:

Figure 20.19 – Determining whether we are CPU or GPU bound
- There is a chance that when you try to open the GPU profiler, you will see a not supported message, and this can happen in certain cases (such as on Mac devices that use the Metal graphics API). In that scenario, another way to see whether we are GPU bound is by searching waitforpresent in the search bar right next to the CPU/GPU labels while selecting the CPU Usage profiler:

Figure 20.20 – Searching waitforpresent
- Here, you can see how long the CPU has been waiting for the GPU. Check the Time ms column to get the number. If you see 0.00, it is because the CPU is not waiting for the GPU, meaning we are not GPU bound. In the preceding screenshot, you can see that my screen displays 0.00 while the CPU is taking 9.41ms and the GPU is taking 6.73ms. So, my device is CPU bound, but consider that your device and project might give different results.
Now that we can detect whether we are CPU or GPU bound, we can focus our optimization efforts. So far, we have discussed how to profile and optimize part of the GPU process. Now, if we detect that we are CPU bound, let's see how to profile the CPU.
Using the CPU Usage Profiler
Profiling the CPU is done in a similar way to profiling the GPU. We need to get a list of actions the CPU executes and try to reduce them, and here is where the CPU Usage Profiler module comes in—a tool that allows us to see all the instructions that the CPU executed in one frame. The main difference is that the GPU mostly executes draw calls, and we have a few types of them, while the CPU can have hundreds of different instructions to execute, and sometimes some of them cannot be deleted, such as a Physics Update or audio processing. In these scenarios, we are looking to reduce the cost of these functions if they are consuming too much time. So, again, an important note here is to detect which function is taking too much time and then reduce its cost or remove it, which requires a deeper understanding of the underlying system. Let's start detecting the function first.
When you play the game with the Profiler tab opened, you will see a series of graphics showing the performance of our game, and in the CPU Usage Profiler, you will see that the graphic is split into different colors, each one referring to different parts of frame processing. You can check the information to the left of the Profiler to see what each color means, but let's discuss the most important ones. In the following screenshot, you can see how the graphic should look:

Figure 20.21 – Analyzing the CPU Usage graph
If you check the graphic, you will probably assume that the dark-green part of the graph is taking up most of the performance time, and while that is true, you can also see from the legend that dark green means Others, and that's because we are profiling the game in the editor. The editor won't behave exactly like the final game. In order for it to run, it has to do lots of extra processing that won't be executed in the game, so the best you can do is profile directly in the build of the game. There, you will gather more accurate data. We are going to discuss how to do builds in the next chapter, so for now, we can ignore that area. What we can do now is simply click on the colored square to the left of the Others label to disable that measurement from the graph in order to clean it up a little bit. If you also see a large section of yellow, it is referring to VSync, which is basically the time spent waiting for our processing to match the monitor's refresh rate. This is also something that we can ignore, so you should also disable it. In the next screenshot, you can check the graphic color categories and disable them:

Figure 20.22 – Disabling VSync and Others from the Profiler
Now that we have cleaned up the graph, we can get a good idea of our game's potential framerate by looking at the line with the ms label (in our case, 5ms (200 FPS)), which indicates that frames below that line have more than 200 FPS, and frames above that line have less. In my case, I have excellent performance, but remember, I am testing this on a powerful machine. The best way to profile is not only in the build of the game (as an executable) but also in the target device, which should be the lowest spec hardware we intend our game to run on. Our target device depends a lot on the target audience of the game. If we are making a casual game, we are probably targeting mobile devices, so we should test the game on the lowest spec phone we can, but if we are targeting hardcore gamers, they will probably have a powerful machine to run our game on.
Important note:
If you are targeting hardcore gamers, of course, this doesn't mean that we can just make a very unoptimized game because of that, but it will give us enough processing space to add more detail. Anyway, I strongly recommend you avoid those kinds of games if you are a beginner as they are more difficult to develop, which you will probably realize. Stick to simple games to begin with.
Looking at the graphics colors, you can observe the cost on the CPU side of rendering in light green, which the graph shows is taking up a significant portion of the processing time, which is actually normal. Then, in blue, we can see the cost of our scripts' execution, which is also taking up a significant portion, but again, this is quite normal. Also, we can observe a little bit of orange, which is Physics, and also a little bit of light blue, which is Animation. Remember to check the colored labels in the Profiler to remember which color refers to what.
Now, those colored bars represent a group of operations, so if we consider the Rendering bar to be representing 10 operations, how do we know which operations that includes? Also, how do we know which of these operations is taking up the most performance time? Out of those 10 operations, a single one could be causing these issues. Here is where the bottom part of the profiler is useful. It shows a list of all the functions being called in the frame. To use it, do the following:
- Clear the search bar we used earlier. It will filter function calls by name, and we want to see them all.
- Click on the Time ms column until you see an arrow pointing downward. This will order the calls by cost in descending order.
- Click on a frame that is catching your attention in the graph—probably one of the ones with the highest height that consumes more processing time. This will make the Profiler stop the game straight away and show you information about that frame.
Important Note
There are two things to consider when looking at the graph. If you see peaks that are significantly higher than the rest of the frames, that can cause a hiccup in your game—a very brief moment where the game is frozen—which can break the performance. Also, you can look for a long series of frames with higher time consumption. Try to reduce them as well. Even if this is only temporary, the impact of it will easily be perceived by the player.
- PlayerLoop will probably appear as the most time-consuming frame, but that's not very informative. You can explore it further by expanding it by clicking on the arrow to its left.
- Click on each function to highlight it in the graph. Functions with higher processing times will be highlighted with thicker bars, and those are the ones we will focus on:

Figure 20.23 – The Render Camera function highlighted in the graph
- You can keep clicking on the arrows to further explore the functions until you hit a limit. If you want to go deeper, enable the Deep Profiler mode in the top bar of the Profiler. This will give you more details but take into account that this process is expensive and will make the game go slower, altering the time shown in the graph, making it appear much greater than the real time. Here, ignore the numbers and look at how much of the process a function is taking up based on the graph. You will need to stop, enable Deep Profile, and play it again to make it work:

Figure 20.24 – Enabling Deep Profile
With this knowledge, we can start improving our game's performance (if it's below the target framerate), but each function is called by the CPU and will need to be improved in its own unique way, which requires a greater knowledge about Unity's internal workings. That could span several books, and anyway, the internals change on a version-to-version basis. Instead, you could study how each function works by looking up data about that specific system on the internet, or again, by just disabling and enabling objects or parts of our code to explore the impact of our actions, as we did with the Frame Debugger. Profiling requires creativity and inference to interpret and react accordingly to the data obtained, so you will need some patience here.
Now that we have discussed how to get profiling data relating to the CPU, let's discuss some common ways to reduce CPU usage.
General CPU optimization techniques
In terms of CPU optimizations, there are lots of possible causes of high performance, including the abuse of Unity's features, a large number of Physics or audio objects, improper asset/object configurations, and so on. Our scripts can also be coded in an unoptimized way, abusing or misusing expensive Unity API functions. So far, we have discussed several good practices for using Unity Systems, such as audio configurations, texture sizes, batching, and finding functions such as GameObject.Find and replacing them with managers. So, let's discuss some specific details about common cases.
Let's start by seeing how a large amount of objects impacts our performance. Here, you can just create lots of objects with Rigidbody configured in Dynamic Profile, and observe the results in the Profiler. You will notice, in the following screenshot, how the orange part of the profiler just got bigger and that the Physics.Processing function is responsible for this increase:
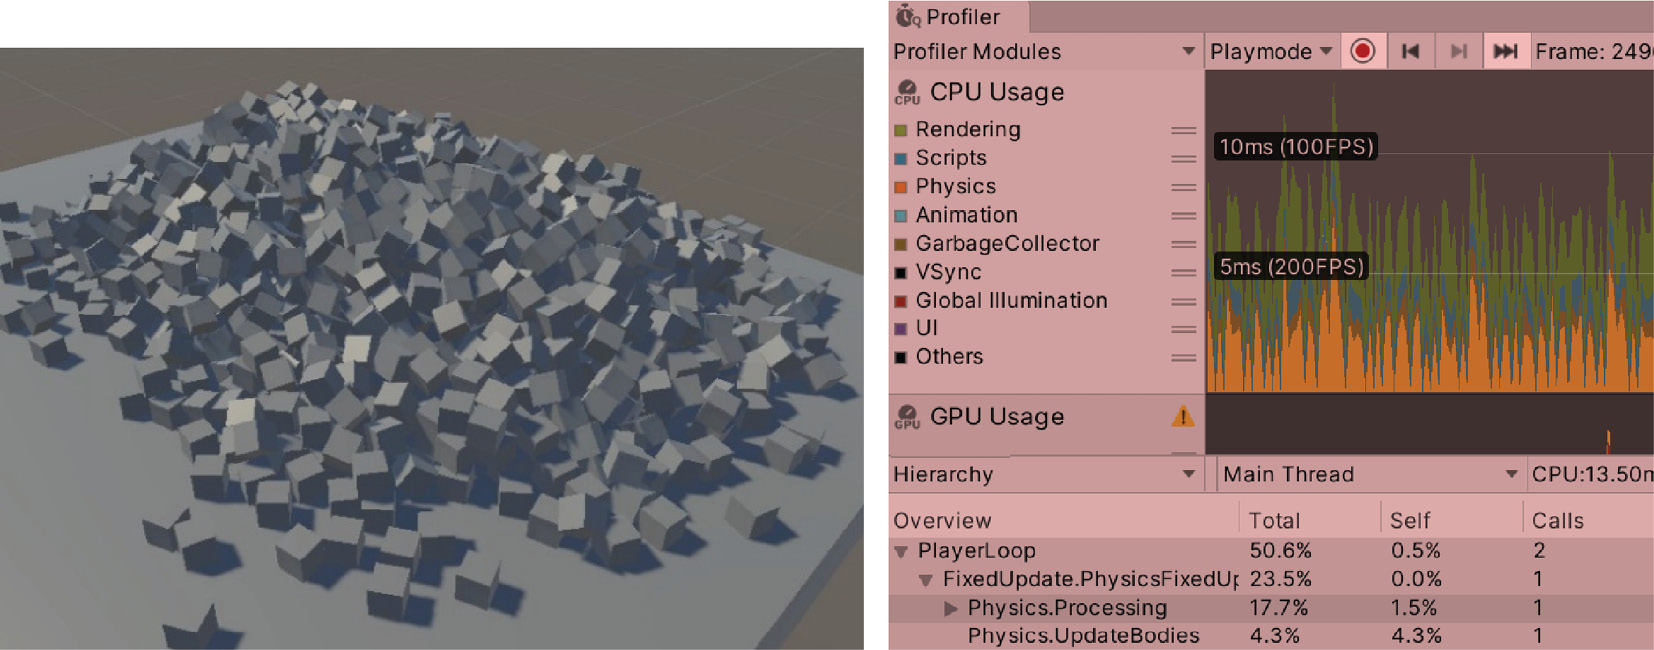
Figure 20.25 – The Physics processing of several objects
Another test to see the impact of several objects could be creating lots of audio sources. In the following screenshot, you can see that we needed to re-enable Others because audio processing comes under that category. We mentioned earlier that Others belongs to the editor, but it can encompass other processes as well, so keep that in mind:
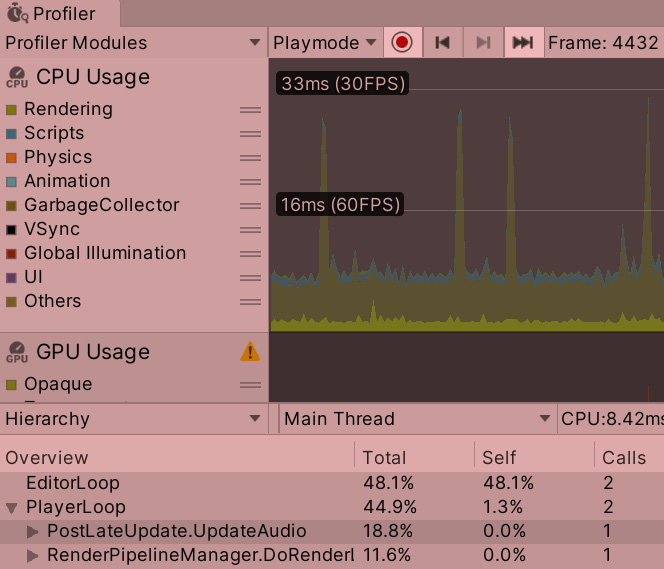
Figure 20.26 – The Physics processing of several objects
So, to discover these kinds of problems, you can just start disabling and enabling objects and see whether they increase the time or not. A final test is on particles. Create a system that spawns a big enough number of particles to affect our framerate and check the Profiler. In the following screenshot, you can check how the particle processing function is highlighted in the graph, showing that it takes a large amount of time:
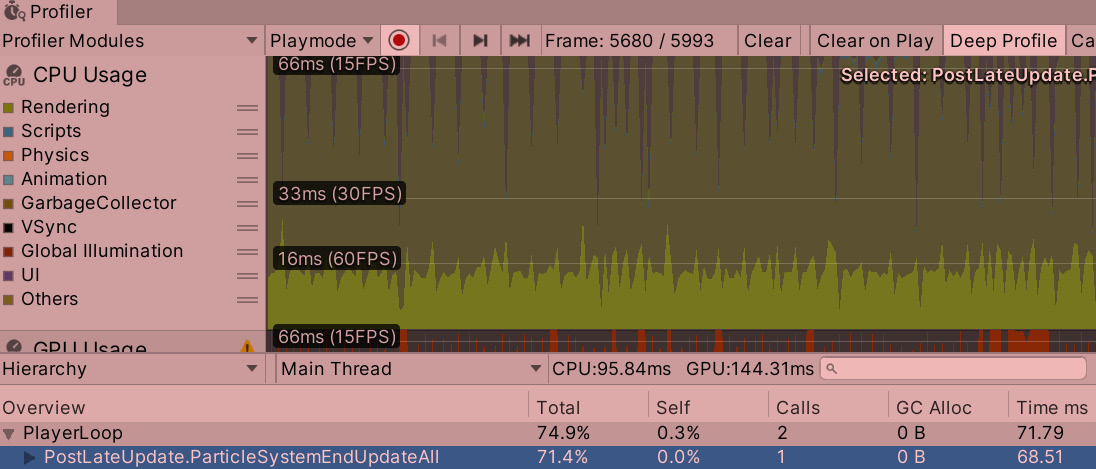
Figure 20.27 – Particle processing
Then, on the scripting side, we have other kinds of things to consider, some of which are common to all programming languages and platforms, such as iterating long lists of objects, the misuse of data structures, and deep recursion. However, in this section, I will mainly be discussing Unity-specific APIs, starting with print or Debug.Log.
This function is useful to get debugging information in the console, but it can also be costly because all logs are written onto the disk immediately to avoid losing valuable information if our game crashes. Of course, we want to keep those valuable logs in the game, but we don't want it to affect the performance, so what can we do?
One possible approach is to keep those messages but disable the non-essential ones in the final build, such as informative messages, keeping the error-reporting function active. One way to do this is through compiler directives, such as the ones used in the following screenshot. Remember that this kind of if statement is executed by the compiler and can exclude entire portions of code when compiling if its conditions are not met:

Figure 20.28 – Disabling code
In the preceding screenshot, you can see how we are asking whether this code is being compiled by the editor or for a development build, which is a special kind of build intended to be used for testing (more on that in the next chapter). You can also create your own kind of logging system with functions with the compiler directives, so you don't need to use them in every log that you want to exclude.
In this section, we learned about the tasks a CPU faces when processing a video game, how to profile them to see which ones are not necessary, and how to reduce the impact of those processes. There are a few other script aspects that can affect performance not only on the processing side but also on the memory side, so let's discuss them in the next section.
Optimizing memory
We discussed how to profile and optimize two pieces of hardware—the CPU and GPU—but there is another piece of hardware that plays a key role in our game—RAM. This is the place where we put all of our game's data. Games can be memory-intensive applications, and unlike several other applications, they are constantly executing code, so we need to be especially careful about that.
In this section, we will examine the following memory optimization concepts:
- Memory allocation and the garbage collector
- Using the Memory Profiler
Let's start by discussing how memory allocation works and what role garbage collection plays here.
Memory allocation and the garbage collector
Each time we instantiate an object, we are allocating memory in RAM, and in a game, we will be allocating memory constantly. In other programming languages, aside from allocating memory, you need to manually deallocate it, but C# has a garbage collector, which is a system that tracks unused memory and cleans it. This system works with a reference counter, which tracks how many references to an object exist, and when that counter reaches 0, it means all references have become null and the object can be deallocated. This deallocation process can be triggered in several situations, the most common situation being when we reach the maximum assigned memory and we want to allocate a new object. In that scenario, we can release enough memory to allocate our object, and if that is not possible, the memory is expanded.
In any game, you will probably be allocating and deallocating memory constantly, which can lead to memory fragmentation, meaning there are small spaces between alive object memory blocks that are mostly useless because they aren't big enough to allocate an object, or maybe the sum of the spaces is big enough but we need continuous memory space to allocate our objects. In the following diagram, you can see a classic example of trying to fit a big chunk of memory into the little gaps generated by fragmentation:
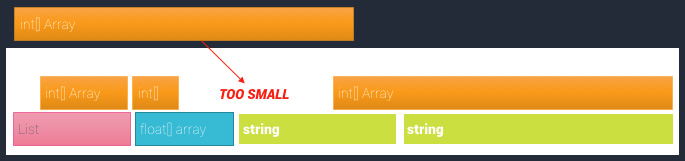
Figure 20.29 – Trying to instantiate an object in fragmented memory space
Some types of garbage collection systems, such as the one in regular C#, are generational, meaning memory is split into generation buckets according to the "age" of the memory. Newer memory will be placed in the first bucket, and this memory tends to be allocated and deallocated frequently. Because this bucket is small, working within it is fast. The second bucket has the memory that survived a previous deallocation sweep process in the first bucket. That memory is moved to the second bucket to prevent it from being checked constantly if it survived the process, and it is possible that that memory will last the length of our program's lifetime. The third bucket is just another layer of bucket two. The idea is that most of the time, the allocation and deallocation system will be working in bucket one, and as it is small enough, it is quick to allocate, deallocate, and compact memory in a continuous fashion.
The problem here is that Unity uses its own version of the garbage collection system, and that version is non-generational and non-compacting, meaning memory is not split into buckets and memory won't be moved to fill the gaps. This suggests that allocating and deallocating memory in Unity will still result in the fragmentation problem, and if you don't regulate your memory allocation, you might end up with an expensive garbage collection system being executed very often, producing hiccups in our game, which you can see in the Profiler CPU Usage module as a pale-yellow color.
One way to deal with this is by preventing memory allocation as much as you can, avoiding it when is not necessary. There are a few tweaks here and there that you can do to prevent memory allocation, but before looking at those, again, it is important to first get data about the problem before starting to fix things that may not be an issue. This advice applies to any type of optimization process. Here, we can still use the CPU Usage Profiler to see how much memory is allocated to each function call that the CPU executes in each frame, and that is simply done by looking at the GC Alloc column, which indicates the amount of memory that the function allocated:
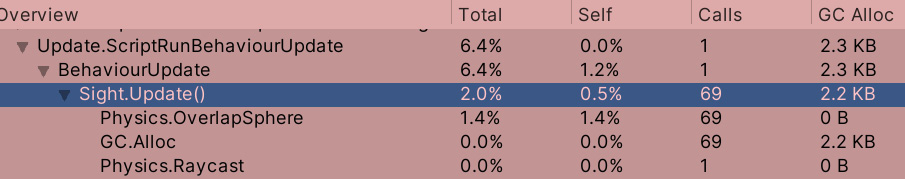
Figure 20.30 – The memory allocation of the Update event function of Sight
In the preceding screenshot, we can see how our function is allocating too much memory, which is produced because there are many enemies in the scene. But that's no excuse; we are allocating that much RAM at every frame, so we need to improve this. There are several things that can contribute to our memory being claimed by allocations, so let's discuss the basic ones, starting with array-returning functions.
If we review the Sight code, we can see that the only moment where we are allocating memory is in the call to Physics.OverlapSphere, and that is evident because it is an array-returning function, which is a function that returns a varying amount of data. To do this, it needs to allocate an array and return that array to us. This needs to be done on the side that created the function, Unity, but in this case, Unity gives us two versions of the function—the one that we are using and the NonAlloc version. It is usually recommended to use the second version, but Unity uses the other one to make coding simpler for beginners. The NonAlloc version looks as in the following screenshot:

Figure 20.31 – Memory allocation of the Update event function of Sight
This version requires us to allocate an array with enough space to save the largest amount of colliders our OverlapSphere variable can find and pass it as the third parameter. This allows us to allocate the array just once and reuse it on every occasion that we need it. In the preceding screenshot, you can see how the array is static, which means it is shared between all the Sight variables as they won't execute in parallel (no Update function will). This will work fine. Keep in mind that the function will return the number of objects that were detected, so we just iterate on that count. The array can have previous results stored within it.
Now, check your Profiler and notice how the amount of memory allocated has been reduced greatly. There might be some remaining memory allocation within our function, but sometimes there is no way to keep it at 0. However, you can try to look at the reasons for this using deep profiling or by commenting some code and seeing which comment removes the allocation. I challenge you to try this. Also, OverlapSphere is not the only case where this could occur. You have others, such as the GetComponents function family, which, unlike GetComponent, finds all the components of a given type, not just the first one, so pay attention to any array-returning function of Unity and try to replace it with a non-allocating version, if there is one.
Another common source of memory allocation is string concatenation. Remember that strings are immutable, meaning they cannot change if you concatenate two strings. A third one needs to be generated with enough space to hold the first ones. If you need to concatenate a large number of times, consider using string.Format if you are just replacing placeholders in a template string, such as putting the name of the player and the score they got in a message or using StringBuilder, a class that just holds all the strings to be concatenated in a list and, when necessary, concatenates them together, instead of concatenating them one by one as the + operator does. Also, consider using the new string interpolation functionality of C#. You can see some examples in the following screenshot:

Figure 20.32 – String management in C#
Finally, a classic technique to consider is object pooling, which is suitable in cases where you need to instantiate and destroy objects constantly, such as with bullets or effects. In that scenario, the use of regular Instantiate and Destroy functions will lead to memory fragmentation, but object pooling fixes that by allocating the maximum amount of required objects possible. It replaces Instantiate by taking one of the preallocated functions and it replaces Destroy by returning the object to the pool. A simple pool can be seen in the following screenshot:

Figure 20.33 – A simple object pool
There are several ways to improve this pool, but it is fine as it is for now. Note that objects need to be reinitialized when they are taken out of the pool, and you can do that with the OnEnable event function or by creating a custom function to inform the object to do so.
Now that we have explored some basic memory allocation reduction techniques, let's look at the new Memory Profiler tool, introduced in the latest version of Unity, to explore memory in greater detail.
Using the Memory Profiler
With this Profiler, we can detect memory allocated on a frame-by-frame basis, but it won't show the total memory allocated so far, which would be useful to study how we are using our memory. This is where the Memory Profiler can help us. This relatively new Unity package allows us to take memory snapshots of every single object allocated both on the native and managed side—native meaning the internal C++ Unity code and managed meaning anything that belongs to the C# side (that is, both our code and Unity's C# engine code). We can explore snapshots with a visual tool and rapidly see which type of object is consuming the most RAM and how they are referenced by other objects.
To start using the Memory Profiler, do the following:
- Open Package Manager (Window | Package Manager) and enable preview packages (Wheel Icon | Advanced Project Settings | Enable Pre-release Packages):

Figure 20.34 – Enabling preview packages
- Click the Plus (+) button and select Add package from git URL…:

Figure 20.35 – Installing packages from git URLs
- In the dialog box, enter com.unity.memoryprofiler and click Add. We need to add the package this way as it's still an experimental one:

Figure 20.36 – Installing the Memory Profiler
- Once installed, open the Memory Profiler in Window | Analysis | Memory Profiler.
- Play the game and click on the Capture button in the Memory Profiler window:
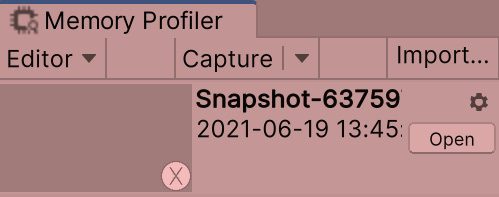
Figure 20.37 – Capturing a snapshot
- Click on the Open button next to the snapshot that was captured to open the tree view, where you can see the memory split into blocks by type. It can take a while so be patient:

Figure 20.38 – Memory blocks
- In our case, we can see that RenderTexture uses up the most memory, which belongs to the image that is displayed in the scene, as well as some textures used by postprocessing effects. Try to disable the PPVolume object and take another snapshot to detect the difference.
- In my case, that dropped off 130 MB. There are other textures needed for other effects, such as HDR. If you want to explore where those remaining MBs came from, click on the block to subdivide it into its objects and take your own guesses based on the names of the textures:
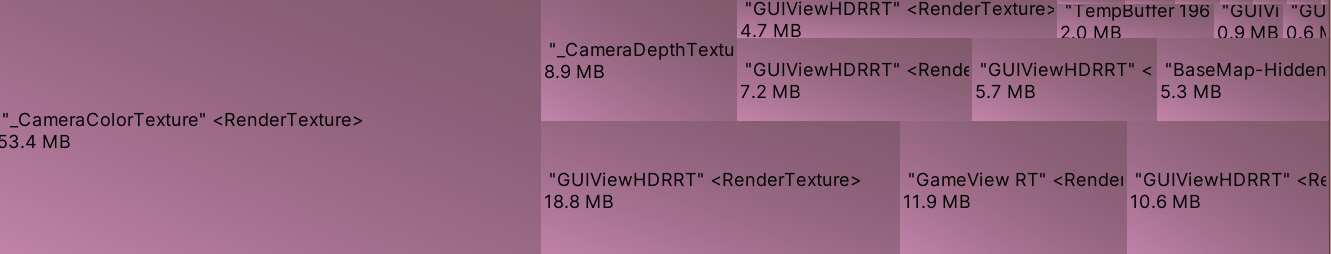
Figure 20.39 – Memory blocks in detail
- You can repeat the same process in the Texture2D block type, which belongs to the textures used in the materials of our models. You can look at the biggest one and detect its usage—maybe it is a big texture that is never seen close enough to justify its size. Then, we can reduce its size using the Max Size of the Texture import settings.
Important note
As with any profiler, it is always useful to carry out the profiling directly in the build (more on that in the next chapter) because taking snapshots in the editor will capture lots of memory that is used by the editor and will not be used in the build. An example of this is the loading of unnecessary textures because the editor probably loaded them when you clicked them to see their previews in the Inspector window.
Take into account that due to the Memory Profiler being a package, its UI can change often, but its basic idea will remain. You can use this tool to detect whether you are using the memory in unexpected ways. Something useful to consider here is how Unity loads assets when loading a scene, which consists of loading all assets referenced in the scene at load time. This means that you can have, as an example, an array of prefabs that have references to materials that have references to textures, and even if you don't instantiate a single instance of them, the prefabs must be loaded in memory, causing them to occupy space. In this scenario, I recommend that you explore the use of addressables, which provide a way to load assets dynamically. But let's keep things simple for now.
You can do more with the Profiler, such as access a list view of all objects and observe every field of it and its references to see which objects are using it (from the main menu, go to TreeMap | Table | All objects), but for beginners, I found that view a little bit confusing. A good alternative to the Memory Profiler reference navigation system is using the Memory module of the Profiler. This is a basic version of the Memory Profiler that won't show you the memory with a nice tree view or in the amount of detail that the Memory Profiler can provide, but provides a simpler version of a reference navigator, which can be enough most of the time.
To use it, do the following:
- Open the Profiler (Window | Analysis | Profiler).
- While in play mode, scroll down through the list of Profiler modules and select Memory.
- With the Gather object references toggle turned on, click on Take Sample Playmode.
- Explore the list that pops up, open the categories, and select an asset. In the following screenshot, you can see that I have selected the texture and on the right panel, I can explore the references. This texture is used by a material named base color, which is referenced by a mesh renderer in a GameObject called floor_1_LOD0. You can even click on an item in the reference list to highlight the referencer object:

Figure 20.40 – Memory Profiler module
As you can see, both the Memory Profiler and the Memory module in the Profiler do similar things. They can take snapshots of memory for you to analyze them. I believe that with time, Unity will unify those tools, but for now, use one or the other based on their strong and weak points, such as the ability of the Memory Profiler to compare two snapshots to analyze differences, or its ability to explore low-level data of the memory, such as seeing which managed object is using which native object (which is pretty advanced and most times unnecessary). You can use the Memory module to analyze references to see which object is using which texture and why.
Summary
Optimizing a game is not an easy task, especially if you are not familiar with the internals of how each Unity system works. Sadly, this is a titanic task, and no one knows every single system down to its finest details, but with the tools learned in this chapter, we have a way to explore how changes affect systems through exploration. We learned how to profile the CPU, GPU, and RAM and what the key hardware in any game is, and also covered some common good practices to avoid abusing them.
Now, you are able to diagnose performance issues in your game, gathering data about the performance of the three main pieces of hardware—the CPU, GPU, and RAM—and then use that data to focus your optimization efforts on applying the correct optimization technique. Performance is important as your game needs to run smoothly to give your users a pleasant experience.
In the next chapter, we are going to see how to create a build of our game to share with other people, without needing to install Unity. This is also very useful for profiling, given that profiling builds gives us more accurate data than profiling in an editor.