
Chapter 21: Building the Project
So, we have reached a point where the game is mature enough that we can test it with real people. The problem is that we can't pretend people will install Unity, open a project, and hit Play. They will want to receive a nice executable file to double-click and play right away. In this chapter, we are going to discuss how we can convert our project into an easy-to-share executable format. Then, we will learn how to apply the profiling and debugging techniques we learned about in Chapter 20, Scene Performance Optimization, but this time on the build. After reading this chapter, you will be able to detect potential performance bottlenecks and know how to tackle the most common ones, leading to an increase in your game's framerate.
In this chapter, we will cover the following Build concepts:
- Building a project
- Debugging the Build
Building a project
In software development (including video games), the result of taking the source files of our project and converting them into an executable format is called a Build. The generated executable files are optimized to get the maximum performance possible. We can't get performance while editing the game due to the ever-changing nature of a project. It would be time-consuming to prepare the assets so that they're in their final form while editing the game. Also, the generated files are in a difficult-to-read format. They won't have the textures, audios, and source code files just there for the user to look at. They will be formatted in custom file structures, so in a way, they are protected from users stealing them.
Important Note
Actually, there are several tools we can use to extract source files from video games, especially from a widely used engine such as Unity. You can extract assets such as textures and 3D models, and there are even programs that extract those assets directly from the VRAM, so we cannot guarantee that the assets won't be used outside the game. In the end, users have the data of those assets on their disks.
The Build process is pretty simple when you target desktop platforms such as PC, Mac, or Linux, but there are a few settings we need to keep in mind before building. The first configuration we are going to see is the scenes list. We have already discussed this, but now is a good time to remember that it is important to set the first element of this list to the scene that will be loaded first. Remember, you can do this by going to File -> Build Settings and dragging your desired starter scene to the top of the list. In our case, we defined the Game scene as the first scene, but in a real game, it would be ideal to create a Main Menu scene using the UI and some graphics:
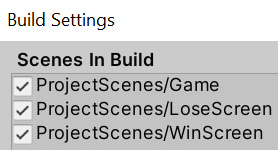
Figure 21.1 – The Scene's list order
Another setting you can change here is the target platform; that is, the target operating system that the build will be created for. Usually, this is set for the same operating system you are developing on, but in case you are, for example, developing on a Mac, and you want to build for Windows, just set the Target Platform setting to Windows. That way, the result will be exe instead of app. You may see Android and iOS as other target platforms, but making mobile games requires that we make other considerations that we are not going to discuss in this book:

Figure 21.2 – Target Platform
In the same window, you can click the Player Settings button at the bottom left, or just open the Edit | Project Settings window and click on the Player category to access the rest of the Build Settings. Unity calls the generated executable files the game's "Player." Here, we have a set of configurations that will affect how the Build or Player behaves, and here is a list of the basic ones:
- Product Name: This is the name of the game in the window title bar and executable file.
- Company Name: This is the name of the company that developed the game, which is used by Unity to create certain file paths and will be included in the executable information.
- Default Icon: Here, you can select a texture to act as the executable icon.
- Default Cursor: You can set a texture to replace the regular system cursor. If you do that, remember to set the Cursor Hotspot property to the pixel of the image you want the cursor to do the clicks for.
- Resolution and Presentation: There are settings regarding how our game's resolution is going to be handled.
- Resolution and Presentation | Default is Native Resolution: With this checked and when the game is running in full-screen mode, the resolution that's currently being used by the system will be the one that's used by Unity. You can uncheck this and set your desired resolution.
- Splash Image: This provides settings about the splash image the game will show after loading for the first time.
- Splash Image | Show Splash Screen: This will enable a Unity splash screen that will display logos as an introduction to the game. If you have the Unity Pro License, you can uncheck this to create your custom splash screen, if you want to.
- Splash Image | Logos List: Here, you can add a set of images that Unity will display when launching the game. If you are using the free version of Unity, you are forced to have the Unity logo displayed in this list.
- Splash Image | Draw Mode: You can set this to All Sequential to show each logo, one after the other, or to Unity logo Below to show your custom introductory logos with the Unity logo always present below yours:
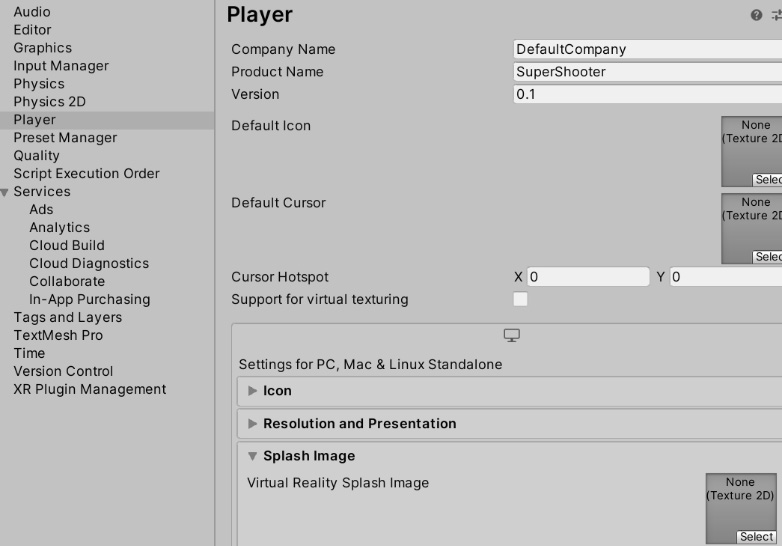
Figure 21.3 – Player settings
After configuring these settings as you wish, the next step is to do the actual Build, which can be accomplished by hitting the Build button in the File | Build Settings window. This will ask you to set where you want the Build files to be created. I recommend that you create an empty folder on your desktop so that you have easy access to the result. Be patient – this process can take a while based on the size of the project:
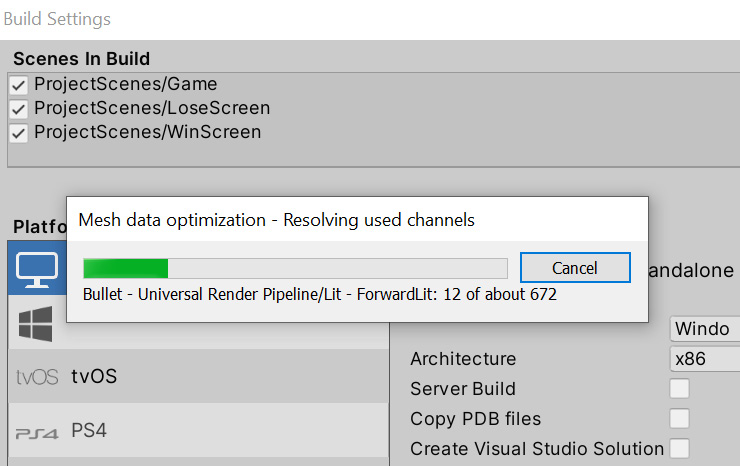
Figure 21.4 – Building the game
Something that can fail here is having non-build compatible scripts – scripts that are intended to be executed only in the Editor window, mostly Editor extensions. We haven't created any of those, so if you receive an error message in the console after building, similar to what's shown in the following screenshot, this can happen because of a script in an Asset Store package. In that case, just delete the files that are shown in the console before the Build Error message. If, by any chance, there is one of your scripts there, ensure you don't have the using UnityEditor; line in any of your scripts. This line will try to use the Editor namespace, the one that is not included in the Build compilation, to save space on the disk:
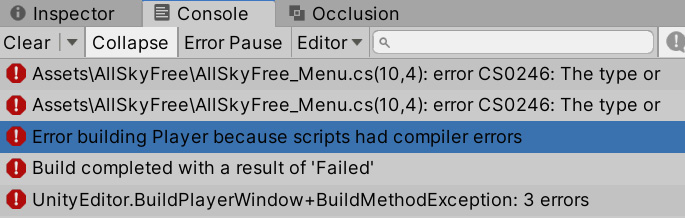
Figure 21.5 – Build errors
And that's pretty much everything you need to know. With that, you have generated your game! Something to take into account is that every file that was created in the folder that you specified when building must be shared, not just the executable file. The Data folder contains all the necessary assets and it is important to include when sharing the game in the case of Windows Builds. For Linux and Mac Builds, just one file is generated (x86/x86_64 and app packages, respectively):

Figure 21.6 – A Windows-generated folder
Now that we have the build, you can test it by double-clicking the executable file. Now that you have tried your build, we will discuss how to use the same Debugging and Profiling tools we used in the Editor to test our build.
Debugging the Build
In an ideal world, the Editor and the build will behave the same, but sadly, that isn't true. The Editor is prepared to work in fast-iteration mode. Code and assets go through minimal processing before being used to make changes often and fast, so we can test our game easily. When the game is built, a series of optimizations and differences from the Editor project will be applied to ensure the best performance we can get, but those differences can cause certain parts of the game to behave differently, making the profiling data of the player differ from the Editor. That's why we are going to explore how we can debug and profile our game in the Build.
In this section, we will examine the following Build Debugging concepts:
- Debugging Code
- Profiling Performance
Let's start by discussing how to debug the code of a Build.
Debugging Code
As Player code is compiled differently, we can get errors in the Build that didn't happen in the Editor, and we need to debug them somehow. We have two main ways to debug – by printing messages and by using breakpoints. So, let's start with the first one, messages. If you ran your executable file, you may have noticed that there's no console available. It's just the Game view in full screen, which makes sense; we don't want to distract the user with annoying testing messages. Luckily, the messages are still being printed, but in a file, so we can just go to that file and look for them.
The location varies based on the operating system. In this list, you can find the possible locations of this file:
- Linux: ~/.config/unity3d/CompanyName/ProductName/Player.log
- Mac: ~/Library/Logs/Company Name/Product Name/Player.log
- Windows: C:UsersusernameAppDataLocalLowCompanyNameProductNamePlayer.log
In these paths, you must change CompanyName and ProductName and use the values of the properties in the Player settings we set previously, which have the same names; that is, Company and Product Name. In Windows, you must replace username with the name of the Windows account you are executing the game in. Consider that the folders might be hidden, so enable the option to show hidden files on your operating system:

Figure 21.7 – Showing hidden files
Inside that folder, you will find a file called Player; you can open it with any text editor and look at the messages. In this case, I have used Windows, so the directory path looks like this:

Figure 21.8 – Debugging directory
Aside from downloading a custom package from the Asset Store, there is a way to see the messages of the console directly in the game –the error messages, at least – and that is by creating a development build. This is a special Build that provides extended debugging and profiling capabilities in exchange for not fully optimizing the code like the final Build does, but it will be enough for general debugging. You can create this kind of Build by just checking the Development Build checkbox in the File | Build Settings window:
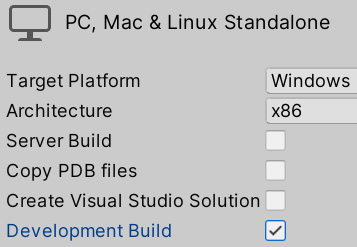
Figure 21.9 – The Development Build checkbox
Remember that just the error messages will be displayed here, so a little trick you can do is replace the print and Debug.Log function calls with Debug.LogError, which will also print the message in the console but with a red icon. Note that this is not a good practice, so limit the usage of this kind of message for temporal debugging. For permanent logging, use the log file or find a custom debugging console for runtime in the Asset Store.
One little trick we performed is that we enabled Development Build – pay attention to the Script Build Only checkbox in the Build window. If you only changed your code and want to test that change, check it and do the build. This will make the process go faster than a regular build. Just remember to uncheck this option if you have changed anything else in the Editor because those changes won't be included if you have it checked. Also, remember that this won't work for Release builds (non-development builds).
Remember that for Development Build to work, you need to build the game again; luckily, the first build is the one that takes the most time, and the next will be faster. This time, you can just click the Build and Run button to do the Build in the folder where you did the previous Build:
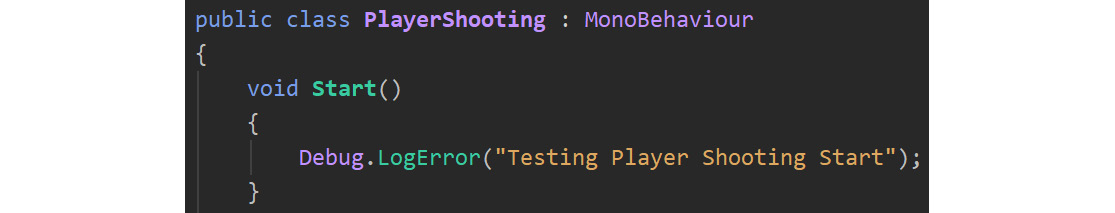
Figure 21.10 – Debugging error messages
Something interesting regarding Development Builds is that, unlike regular builds, the error messages are displayed directly in the build, allowing you to properly debug your project. In the following screenshot, you can see the error message being displayed in the runtime:
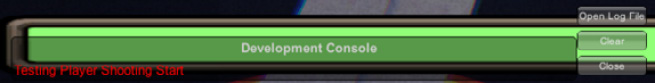
Figure 21.11 – Error messages in a development Build
Note that aside from showing the error message, there's an Open Log File button on the right, allowing you to view the log file. This is a text file containing detailed information regarding all the messages and logs that occurred in this run of the game to pinpoint the issue. Essentially, this is the same information that the Console panel shows in the editor.
Also, you can use regular breakpoints in the same way as we explained in Chapter 14, Introduction to C# and Visual Scripting. Upon attaching the IDE to the Player, it will show up in the list of targets. But for that to work, you must not only check Development Build in the Build window but also Script Debugging. Here, you have an additional option that, when checked, allows you to pause the entire game until a debugger is attached. This is called Wait for Managed Debugger. This is useful if you want to test something that happens immediately at the beginning and doesn't give you enough time to attach the debugger:

Figure 21.12 – Enabling script debugging
We have another way to view these messages, but that will require the Profiler to work, so let's use this as an excuse to also discuss how to profile the Editor.
Profiling performance
We are going to use the same tools we looked at in the previous chapter, but to profile the Player this time. Luckily, the difference is minimal. As we did in the previous section, you need to build the Player in Development mode by checking the Development Build checkbox in the Build window. Upon doing this, the profilers should automatically detect it.
Let's start using the Profiler on the Build by doing the following:
- Play the game through the Build.
- Switch to Unity using Alt + Tab (Cmd + Tab on Mac).
- Open the Profiler.
- Click the menu that says Playmode and select the item that contains Player in it. Because I have used Windows, it says WindowsPlayer:

Figure 21.13 – Profiling the Player
Notice that when you click a frame, the game won't stop like it does in the Editor window. If you want to focus your attention on the frames at a specific moment, you can click the record button (the red circle) to make the Profiler stop capturing data so that you can analyze the frames that have been captured so far.
Also, you can see that when the Profiler is attached to the Player, the console will also be attached, so you can see the logs directly in Unity. Note that this version requires Unity to be open, and we cannot expect our friends who are testing our game to have it. You might need to click on the Player button that appears in the Console window and check Player Logging for this to work:
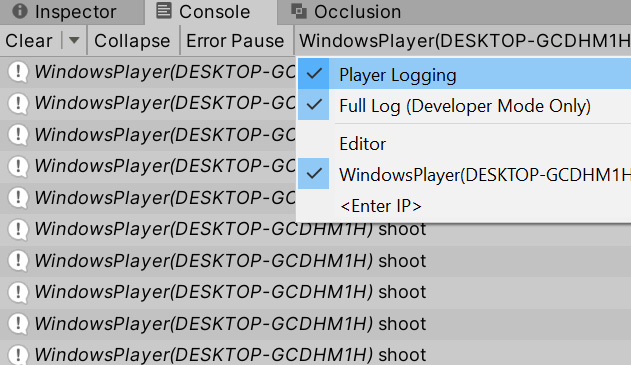
Figure 21.14 – Enabling Player Logging after attaching the Profiler
Frame Debugger must also be enabled to work with the Player. Here, you need to click the Editor button in Frame Debugger. Again, you will see the player in the list of possible debugging targets; after selecting it, hit Enable as usual. Consider that the preview of the Draw Calls won't be seen in the Game view but in the Build itself. If you are running the game in full-screen mode, you might need to switch back and forth between Unity and the Build:
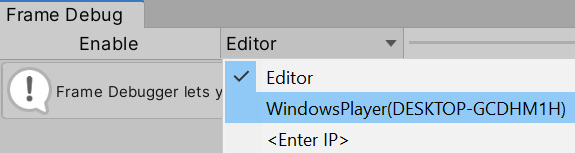
Figure 21.15 – Debugging the frames of our game's Player
You may also wish to run the game in Windowed mode, which you can do by setting the Fullscreen Mode property in the Player settings to Windowed, as well as establish a default resolution that is smaller than your desktop resolution to have both Unity and the Player visible:
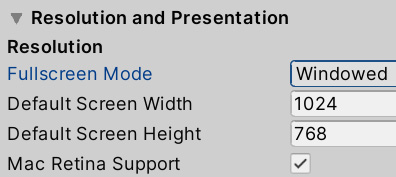
Figure 21.16 – Enabling Windowed mode
Finally, Memory Profiler also supports profiling the Player. As you might have guessed, you can just select the Player from the list that is displayed when you click the first button shown in the top bar of the window, and then click Capture Player:
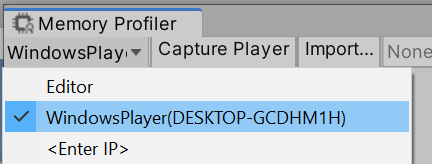
Figure 21.17 Taking memory snapshots of the Player
And that is it. As you can see, Unity Profilers are designed to be easily integrated with the Player. If you start to take data from them, you will see the difference compared to Editor profiling, especially in Memory Profiler.
Summary
In this chapter, we learned how to create an executable version of the game and configure it properly so that you can share it with not only your friends but potentially the world! We also discussed how to profile our Build; remember that doing that will give us more accurate data than profiling the Editor, so we can improve the performance of our game even more.
But before we do that, we must discuss some final details. These are not Unity-related details, but game-related ones – things you need to consider before and after showing your game to people other than yourself or any person that saw your game while it was being developed. In the next chapter, we will briefly discuss the non-technical aspects of game development, and what you should do before and after finishing your game.