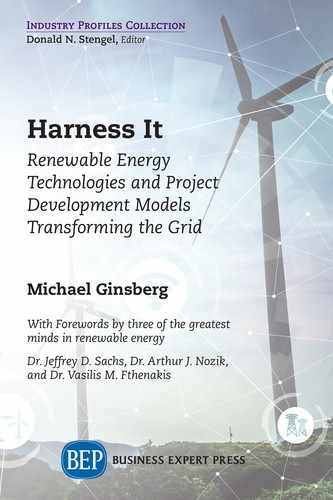
Model 1: Grid-Scale Renewable Energy
Now that we have explored our existing energy system and how renewable energy works, we move into the financial, political, technical and environmental considerations for developing renewable energy projects. In this chapter, we discuss the first “model” of renewable energy production and interconnection—grid-scale. It is a “model” because the financing and interconnection requirements for large-scale projects represent a distinct “regime,” or ecosystem of project, different from those at other size scales. In this chapter, the model will be illustrated through two case studies—solar energy in Curacao, and hydropower in Lebanon.
In Chapters 4 and 5, we discuss two additional models—on-site generation, and community-scale/microgrid renewable energy. These chapters will equip the reader with the tools to analyze and implement renewable energy projects of all types.
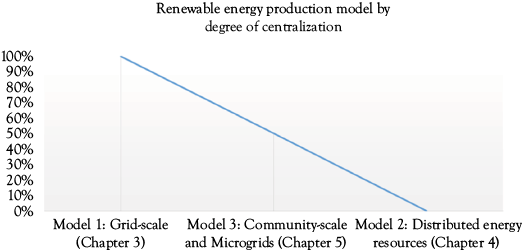
Figure 3.1 Renewable energy production model by degree of centralization. The more centralized the farther from the end user. Grid-scale systems are the most traditional centralized systems that send power over great distances to customers. Community-scale and microgrids are closer to users, and distributed energy resources are at the site of consumption.
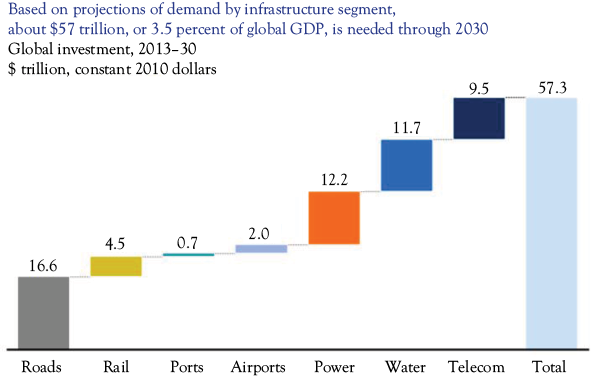
Figure 3.2 Investment required to meet global infrastructure demand by infrastructure segments through 2030.
Source: Exhibit from “Infrastructure productivity: How to save $1 trillion a year,” January 2013, McKinsey Global Institute, www.mckinsey.com. Copyright (c) 2018 McKinsey & Company. All rights reserved. Reprinted by permission.
Investment in Infrastructure: Competing for Coveted Capital
There is a significant global demand for infrastructure investment. According to the McKinsey Global Institute, $57 Trillion in infrastructure investment, or 3.5 percent of global Gross Domestic Product (GDP), will be needed by 2030, 21 percent of which will be for power.1
In the U.S., the 2016–2025 cumulative investment gap for electricity infrastructure is estimated to be $177 Billion, a figure that includes generation, and transmission and distribution (T&D).
The American Society of Civil Engineers periodically grades the U.S. on the state of its infrastructure. In 2017, the U.S. received cumulative infrastructure and energy grades of D+.2 In 2017, there were 3,571 power outages lasting an average of 49 minutes. Clearly, the majority of America’s electrical infrastructure is at or beyond its expected life.
Widespread national electrification occurred on the heels of the westward expansion of the 1800s. By 1930, about 70 percent of households were electrified, and electricity quickly became a public commodity. Most of the T&D lines that make up America’s grid were constructed in the 1950s and 1960s and are now beyond their predicted 50-year life.

Figure 3.3 2017 Score card for US Infrastructure, as awarded by infrastructurereportcard.org.
So, what is delaying an infrastructure upgrade? The barrier to accessing capital is structural. While investor-owned utilities (IOUs) make up only 6 percent of electricity providers in the U.S., they serve 68 percent of customers. Like other private entities, they are driven by short-term financial gain. This means that investment in T&D infrastructure must be economically justifiable. Electricity, however, is a public commodity, and rates are capped by regulators, making it difficult to justify investment. In addition, excess supply both from baseload and distributed renewable energy makes it challenging to raise rates.
As a rule of thumb:
- Where demand > supply, pricing is high, investment is justified
- Where demand < supply, pricing is low, investment is constrained
In the U.S., energy is generated and sold by a complex network of large and small public and privately-owned utilities, each subject to their own governance structures and energy pricing regulations.3 The interactions between these entities are managed by regional transmission organizations and independent system operators.
- Investor-Owned Utilities (IOUs): These companies hark back to the early days of Edison and Westinghouse, where energy was provided by companies held by shareholders and investors. The aim of a privately-owned company is to optimize profits and maximize the returns to its investors. However, IOUs are subject to regulation by local public entities that prevent them from raising energy rates as high as they would like (by issuing price caps via a public process).
- Publicly-Owned Utilities (POUs): These utilities are owned and managed by local authorities or even by the customers themselves, if the POU is a cooperative. The aim of the POU is to provide the best possible energy rates for its customers, within the framework of managing overheads and debt. The organization’s board (or depending on legal structure, the city council) agrees on energy rates within a public forum.
For both privately- and publicly-owned structures, maximizing returns to investors or customers takes precedence over costly long-term investments in infrastructure.
Developing Renewable Energy Projects
The first step for a developer is to make a case for capital. The National Renewable Energy Laboratory (NREL) describes the steps in this process as Baseline, Economic, Policy, Technology, and Consensus (BEPTC).4

Figure 3.4 The National Renewable Energy Laboratory BEPTC framework.5
- Baseline
The first step, the Baseline, requires the developer to outline a simple project motivation, for example to “reduce reliance on fossil fuels.”
- Economic
Next, the Economic rationale must be clearly established, and a positive return on investment demonstrated.
Since money has the potential to earn interest and the price of goods increases over time (inflation), a dollar you have today is worth more than a dollar in the future. Net Present Value (NPV) is commonly used to assess the value of a project by returning the values of all future project earnings in today’s dollars and subtracting the present value of all project costs. It is defined as the difference between the present value of an investment’s future cash flows and the project’s present and future costs.*
NPV = Present Value of Future Cash Flows - Present Value of Project Costs
If the project’s worth today, or NPV, is positive, then the project makes financial sense. However, the economic analysis must include risk. The risk—reward relationship is directly proportional—the higher the risk, the greater the reward. We use the Minimum Acceptable Rate of Return (MARR) to capture an investor’s risk—reward profile—a high MARR indicates high risk and thus high expected returns.
If you were investing money in the stock market, what rate of return would you accept before putting your money into another investment? Corporate MARRs are very specific to the institution but generally vary from 10 to 20 percent. Investors have multiple options for their money so will direct their money to the most attractive investment.
Let’s take an example. Say a new utility-scale solar PV system has a capacity of 1 MW and at $0.50/watt will cost $500,000 (1 MW * 1,000,000 watts/MW * $0.50). The array will produce 1,551 MWh (1 MW * 365 days * 5 peak sun hours * 0.85) and with an offtake agreement of $50/MWh, produce an annual value of $77,550 for 25 years (1,551 MWh * $50/MWh). Assuming a discount rate of 10 percent (reflecting a corporate MARR of 10 percent), the present value of the annual revenue over 25 years will be $703,924.45.
Therefore:
NPV = $703,924.45 − $500,000
= $203,924.45
The NPV is positive and would be considered a good investment.
Another way to look at it is through a Benefit-Cost Ratio, which is simply the present value of the benefits divided by the present value of the costs. Many firms consider the investment only worthwhile if the benefits are at least two times greater than the costs. In this case:
$703,924.45 / $500,000
= 1.41
If the threshold were to double your investment, it would not be worthwhile.
Neglecting interest and inflation for a quick analysis, the simple payback period would be:
Payback (years) = Total Cost/Annual Revenue
= $500,000/$77,550
= 6.4 years
The Return on Investment would be:
ROI = Annual Revenue/Total Cost
= $77,550/$500,000
= 0.16 * 100
= 16 percent ROI
A final note—a comprehensive financial assessment must include a comparison of other investment options to determine the best investment of funds.
Large-scale renewable energy developers take advantage of private capital to realize their projects. Debt Financing in the form of loans is most commonly used. Equity Financing is more expensive, but investors are paid only after revenue is generated. Innovative delivery options exist to fund and manage public infrastructure through private capital. Known as Public Private Partnerships (P3 or PPP), these agreements share risks, benefits, and expertise between government agencies and private entities.
Unlike conventional Design Bid or Design Bid Build contracts where all design, operations and maintenance risks remain with the public through taxes, P3 structures transfer risk to the private sector in exchange for more ownership and returns. These approaches are often piloted in emerging economies, such as India, China, Turkey and Lebanon, where governments leverage private capital to finance the massive infrastructure investments required for a burgeoning middle class.
An important element of the economic analysis is determining how the development project will generate income once the construction phase is complete. As previously discussed, energy project developers use power purchase agreements (PPAs) to sell their energy at a specified rate (cents/kWh) to offtakers, IOUs, or POUs under a Build Own Operate (BOO) or Build Own Operate Transfer (BOOT) contract. Feed-in-Tariffs (FiTs) of a set amount per kWh fed into the grid guarantee developers a high rate for renewable energy, and are a way for governments to stimulate renewable energy production without any upfront investment.
For instance, In 2009, the Government of Ontario, Canada implemented a FiT program as part of its Green Energy Plan. With the FiT, producers of energy from wind, solar, hydro and biomass/biogas were able to sign long-term contracts to supply power to the grid for prices up to 40 times the existing market value per kWh. (for residential PV under 10 kW the FiT was 80.2 cents per kWh for 20 years.) The program was “one of North America’s first comprehensive guaranteed pricing structures for renewable electricity production” 6 and caused a boom in renewable energy production within the province. Some critics claim, however, that the high tariffs promised to green energy producers have contributed to Ontario’s high energy prices for consumers. The program’s final round of applications closed in 2016.7
Policy
Policy is particularly important for renewable energy projects. It takes into account existing stakeholders and government incentives or disincentives. Policy stakeholders span the spectrum from scientists involved in the design and fabrication of novel technology to government agencies that provide funding and regulatory structures. Research universities and laboratories house subject matter experts, such as physicists, chemists and engineers, who leverage their specific domains of expertise into practical technologies. In the U.S., the government can fund and regulate renewable energy at three levels: Federal, State and Local. The role of the Federal Government is to incentivize renewable energy deployment through incentives, and support innovation through funding R&D, through vehicles such as Renewable Energy Credits (RECs), non-tangible energy commodities that can be traded or sold. The Federal Government can also disincentive fossil fuels through a carbon tax or a cap and trade system.
State governments can similarly incentivize the development and adoption of green energy production through a Renewable Portfolio Standard (RPS) and carve-outs. Solar carve-outs, for instance, are a component of an RPS, and require a percentage of a state’s energy mix to come from solar by a certain date. Solar carve-outs include rules for solar energy interconnection and inter- and intra-state trading through Independent System Operators.
At the local level, Authorities Having Jurisdiction (AHJs) set the rules for electrical, structural and mechanical design, and make the final permitting determinations.
At all levels, the utility is a central stakeholder. Utilities either secure PPAs from developers, own their own plants, or have off-take agreements, such as Net Energy Metering, with distributed generators. Other stakeholders include the community colleges that train technicians, manufacturers, distributors, testing and accreditation bodies such as Underwriters Laboratories (UL), the North American Board of Certified Practitioners (NABCEP), and the designers of software and tools used by engineers and technicians.
The electricity market itself is a stakeholder, since it affects renewable energy adoption. The electricity market includes both competitors and potential detractors, such as coal, oil and natural gas providers, complementary energy sources such as wind, and energy storage solutions like pumped hydro and batteries.
Finally, energy industry professionals are an important stakeholder. They are involved in the practical design, finance and installation of renewable energy systems. Financial entities, including renewable energy developers, lending institutions, and the stock market, can significantly hasten or slow the spread of renewable energy.
- Technology
The next stage of the BEPTC framework is to conduct a technology assessment. This involves a preliminary analysis of the resource and its economic potential, using the techniques outlined in Chapter 2.
- Consensus
Table 3.1 Types of public private partnership (P3) contracts and associated risks.
|
Types of public private partnership (P3) contracts |
Risk transfer |
|
|
Design Bid Build (DBB) |
Separate contracts for design and construction |
Public Private |
|
Design Build (DB) |
One contract for design and construction |
Public Private |
|
Design Build Operate Maintain (DBOM) |
One contractor for design, construction, and O+M in exchange for fees from end users (common for highways and public transportation) |
Public Private |
|
Design Build Finance Operate (DBFO) |
Same as DBOM except contractor finances O+M under a long-term lease (common for highways and public transportation) |
Public Private |
|
Build Own Operate (BOO), Build Own Operate Transfer (BOOT) |
Contractor either owns or leases facility, provides financing and sells output (common in power sector) |
Public Private |
|
Scientists |
Government Agencies |
Industry |
Electricity Market |
|||
|
• Research Universities • Professors • Physicists • Material Scientists • Electrical Engineers • Chemists • Chemical Engineers • Mechanical Engineers |
• US Department of Energy • NASA • Federal Energy Regulatory Commission (FERC) • State Energy Commissions • Independent System Operators (ISO) • Local Authorities Having Jurisdiction |
• Utilities • Community Colleges • Module Manufacturers • Inverter Manufacturers • Battery Manufacturers • Balance of Systems • Wholesale Distributors • International Organization for Standardization (ISO) • UL Certification • NABCEP • Design Software • Design Tools |
• Energy Prices (cents/kWh) • Natural Gas Prices • Natural Gas Peaker Facilities • Pumped Hydro Facilities • Utility-Scale Batteries • Renewable Energy Industry |
|||
|
Industry Professionals |
Financial |
Users |
Environment |
|||
|
• Trainers • Renewable Energy Installers/Electricians • Architects • Urban Designers • Chemical Engineers • Electrical Engineers • Civil Engineers • Mechanical Engineers • Software Engineers |
• Renewable Energy Developers • Lending Institutions • Stock Market |
• Humanity • Residential, Commercial and Industrial Buildings • Building Owners • Utility PPAs • Land Owners & Eminent Domain |
• Human Welfare • Environmental Impact • Climate Change Mitigation |
Figure 3.5 Key stakeholder groups and factors affecting the development and adoption of renewable energy.
Figure 3.6 Stakeholder engagement matrix indicating the level of engagement required based on stakeholder influence and/or interest.
Before moving on to the construction phase, the developers must reach Consensus on the results of the Baseline, Economic, Policy and Technology analyses. Best practice is to engage with all project stakeholders listed above, including the host community. To create a Stakeholder Engagement strategy, the developer should map stakeholders on a Stakeholder Engagement Matrix according to their level of interest and influence, and engage with them accordingly throughout project development, construction, plant operation, and closeout.
But why is consensus so important? On the one hand, for fairness, and on the other hand, for good business. All too often, a large investment in an energy infrastructure project will be developed to be Technically Feasible, Financially Viable and Environmentally Sustainable, with the relevant governmental, financial, technical and other stakeholders on board. But these projects fail to ensure that the local, or host communities, most impacted by the project, are also on board. Whether their landscapes and farmlands will be impacted by the view of and noise from a large wind farm,8 or flooded by a dam for a new hydropower plant,9 or even if the local community will experience short-term disruption from the construction of a large solar array, these local stakeholders must be consulted and their views taken into account during the project development phase; the project must be Socially Acceptable.
Taken together, this concept is known as Smart Business.10 Without this level of consideration of host communities, interested and concerned protest and advocacy groups can cause serious delays to the construction of the project, costing thousands of dollars, and can even affect the political climate making the investment possible.
Constructing and Financing Renewable Energy Projects
Once consensus amongst all stakeholders is reached, the project can move on to the development phase, securing the Site, Resource, Off-take, Permits, Technology, Team and Capital (SROPTTC).
Securing the Site for the project involves obtaining property rights and fully understanding its physical properties. An Investment-Grade assessment is conducted, building on the preliminary Resource assessment done during the development phase. To do this, the resource needs to be fully understood, using detailed hourly data and computer modeling. The Off-take, or contracting method, for energy sales, must also be established.
![]()
Figure 3.7 SROPTTC Framework (National Renewable Energy Laboratory).11
Following Environmental Assessments (EA) , permits must be secured. As mentioned, one type of permit that cannot be formally applied for and is often overlooked is known as the Social License to Operate (SOL). As renewable energy projects can take up significant land and water resources and make an obvious impact on the landscape, it is important to secure and maintain a SOL through stakeholder engagement with affected parties before and during the construction phase, and through project closeout and operation.
Developers must make Technological selections to determine the project’s primary components, and assemble a Team with complementary technical, financial, and project management skills. Then, Capital must be secured from investors, based on a proposal including all of the assessments completed.
Surmounting the Valley of Death
The challenge of securing funding for a new clean technology enterprise can seem insurmountable. The old adage “banks will always be the first in line to finance your second project” speaks to the challenge of attracting investment in innovative sectors. Developers need to not only secure capital for the start-up phase of the project (BEPTC and then SROPTT), but must also carefully manage the investment to avoid a cash flow crisis, known as Death Valley. This is the uncertain period between a venture’s infancy and young adulthood in which initial R&D funding runs out, but revenue is not yet being generated.
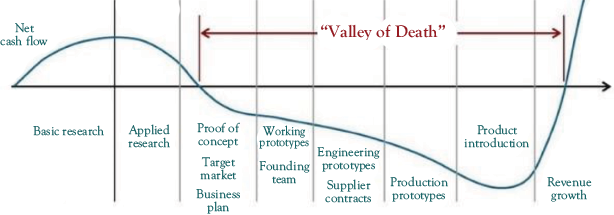
Figure 3.8 The “Valley of Death”—a period in which a new venture runs out of seed funding and before it generates revenue.
Source: https://www.go-gba.org/bridging-the-valley-of-death-and-crossing-death-valley/
New ventures follow a lifecycle called an S Curve. The shape comes from the three stages a product goes through toward successful commercialization: Innovation (“Startup”), Growth, (“Expansion”) and Maturity (“Mature”). In the Innovation stage, efforts are focused on technological breakthroughs and market penetration is below 10 percent. During the Growth phase, market penetration and profit margins grow. Finally, in the Maturity stage, the product has reached above 90 percent penetration. During this stage, the market is saturated with the product, which lowers the cost and reduces profit margins. Typically, at this late stage companies have achieved significant Economies of Scale, the cost advantage from higher levels of production, which reduces manufacturing costs and mitigates decreased profit margins.

Figure 3.9 Business Life Cycle S-Curve.
Case Study 1: Curacao Stage One Utility-Scale Solar PV Assessment
The following case study illustrates a sample preliminary assessment for the development of a utility-scale solar energy project in Curaçao, an island off the coast of Venezuela in the former Kingdom of the Netherlands.
Brief
Curaçao is an autonomous constituent nation of the Kingdom of the Netherlands. A 444 km2 island off the coast of Venezuela,12 Curaçao’s utility provider Aqualectra meets 70 percent of its 968,000 MWh (2008 estimate) needs through steam and gas turbines and diesel engines, and 30 percent through four wind turbine farms with a total rated power capacity of 60 MW.13
As of December 1, 2016, residential electricity rates ranged from $0.26 to $0.35/kWh14,15 Given rising fuel costs, the island’s abundant solar resource (5.5–6.2 peak sun hours, or 2,000–2,250 kWh/m2 of annual solar radiation),16 and decreasing solar PV costs ($1.50/watt for utility scale), Aqualectra should examine the business case for utility-scale solar PV.
This initial study examines potential sites that could contribute 30 percent of total demand (290,400 MWh) from solar PV and provide a MARR above 10 percent, reducing fossil fuel consumption to 40 percent. Given that wind and solar energy are complementary producers, with wind contributing more at night and solar more during the day, the introduction of solar PV would have a smoothing effect on power supply. Two sites were selected as each being capable of meeting this goal.
Assumptions
Production: To meet 30 percent of the island’s needs, approximately 171 MW of installed PV capacity would need to be installed.17
Financial: The 171 MW system would cost approximately $256,500,000.18 With an annual income of $81,312,00019 the project would have a simple payback period of 3.2 years.20 The net present value of the system with a life of 25 years and 10 percent discount rate would be $481,572,278 with a rate of return of 32 percent and an optimal benefit-cost ratio of 2.9.21,22,23,24
Methodology
Two sites were selected through factoring out the following factors: (1) low irradiance, (2) densely-populated areas, (3) uneven terrain, and (4) occupied land or land zoned for development or conservation (that is, natural parks). Two sites with the following optimal characteristics were thus selected: high irradiance, sparse population, even terrain, and unoccupied land.25
Site Selection
- Irradiance
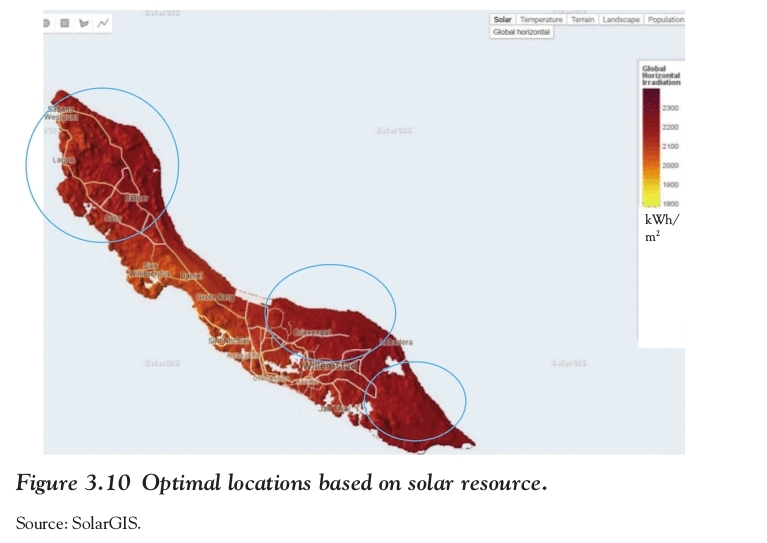
To achieve the 5.5 daily peak sun hours, optimal sites include locations with >2,100 kWh/m2/year, as shown in the circles.
- Population Density

Examining population density narrowed site selection to three potential areas where there are less than five inhabitants/km2, as shown.
- Terrain

The highest point in Curacao is Mt. Christoffel at only 1,227 feet above sea level. Areas with the most even terrain were visibly selected on the map above, identified by the two circles above. Further site inspection is necessary to confirm optimal selection.
- Land Status (Zoning/Ownership)
- Site 1’s ownership and zoning status is currently unknown. The author observed the subject lot is vacant.
- Site 2 is privately owned by an individual.
Site Production Estimates
Based on a system size of 171 MW and a capacity of 350 watts per module (high efficiency), the total number of modules needed is 488,572.26 Given that the average module is 2 m2 plus 0.5 m2 for spacing, the total area needed is 1.22 km2.27
Site 1—Northeast (Labadera/Santa Catharina)
Total area is 1.22 km2, which can contain 488,571.43 modules and provide 171 MW. This site backs up to the Santa Catharina neighborhood. Consultation is likely necessary.
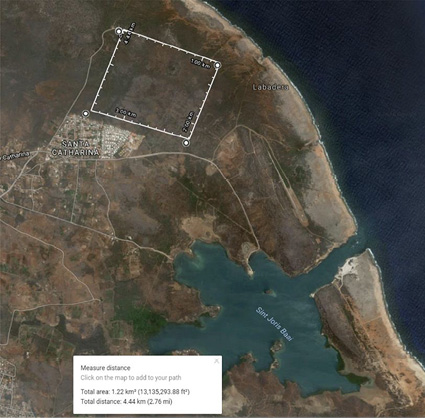
Figure 3.13 Site 1.
Source: Courtesy of Google Maps.
Site 2—East End
Total area is 1.22 km2, which can contain 488,571.43 modules and provide 171 MW. This site is privately owned and undeveloped.
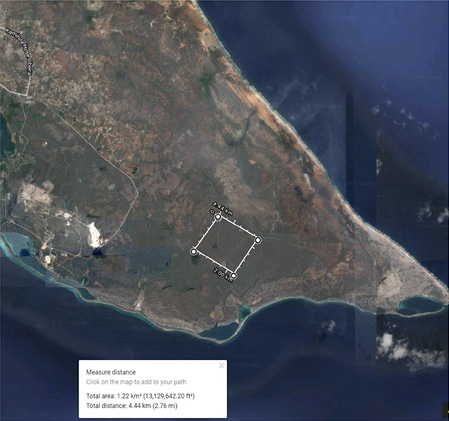
Figure 3.14 Site 2.
Source: Courtesy of Google Maps.
Next Steps
- Investigation of property ownership for selected areas.
- Physical inspection of sites to confirm optimal selection, including shading. Verify through NREL’s System Advisor Model (SAM).
- Comprehensive estimate for solar PV system cost, including grid upgrades required.
- Consideration of upgrades to grid needed to accommodate solar PV system: battery storage (for when production exceeds demand), transmission infrastructure, voltage regulation, and so on.
- Comprehensive financial model to incorporate discount rates. Verify through NREL’s SAM.
- Consideration of PPA and BOOT (build, own, operate, and transfer) mechanisms.
Case Study 2: Public Private Partnerships Enabling Hydropower Development in Lebanon
Elie Kallab, Fellow, UN Sustainable Development Solutions Network Youth Initiative
In light of Lebanon’s 2020 goal of 12 percent renewable energy and recent legislation on public private partnerships (PPP), this case study examines the potential for further hydropower development in Lebanon through a PPP structure.
The Potential for PPP to Facilitate Hydropower Development in Lebanon
The rehabilitation and development of the hydropower sector in Lebanon requires extensive investment. In 2017, the Lebanese Parliament adopted PPP legislation, known as Law 48. The law ensures private sector establishments will be granted ownership of the land required for hydropower plants.28,29 Prior to Law 48, the private sector was forbidden from owning hydropower plants, aside from small off-grid installations.
History of Hydro Power in Lebanon
Prior to the 1960s, Lebanon produced more than 60 percent of its energy from hydropower. Due to rising demand and increased generation from combined cycle gas-fired power plants, the hydropower capacity in Lebanon today is approximately 282 MW, only 8.7 percent of the country’s total energy mix.31 The state-run electric utility, Electricité du Liban (EDL), operates seven thermal plants fueled by gasoil, fuel oil, natural gas, and six hydropower plants.

Figure 3.15 Chart showing energy mix in Lebanon, based on figures from the Lebanese Republic Ministry of Energy and Water, 2014.30
Source: Data from Karim Osseiran, Ministry of Energy and Water Resources, Lebanese Republic. https://www.slideshare.net/KarimOsseiran/geothermal-energy-potential-for-lebanon
Hydropower Potential in Lebanon
Lebanon is known for its seasonal changes. During the winter season, cyclonic depressions cause heavy rain and snowfall in the coastline and mountains of Lebanon. The summers are often without precipitation.
Lebanon has 17 major rivers, three of which are well-known: Nahr El Kebir, Nahr El Assi and Nahr El Hasbani. Lebanese Rivers experience fluctuating patterns of hydrologic flows due to the country’s seasonal variability. Low flow periods occur from July to November and the high period runs from January to May.32
According to the World Bank, the demand for electricity in the country reached over 4,000 MW in 2015. Since the establishment of two combined cycle power plants in 1998, no new power plants have been added to meet rising demand. Current hydropower plants contribute approximately 282 MW of capacity. Of that capacity, the Markabi, Awali and Joun plant stations on the Litani Watani River Station contribute the most capacity, 199 MW.33
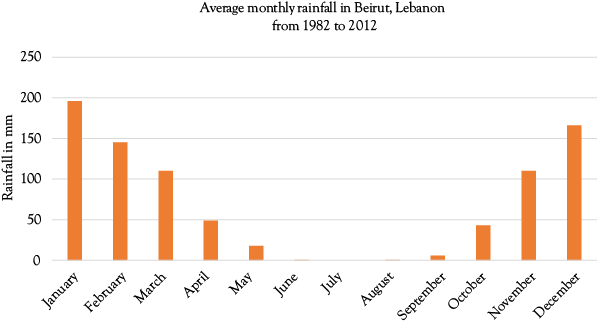
Figure 3.16 Monthly variability of rainfall in Lebanon.
Source: Climate-Data.org. https://en.climate-data.org/asia/lebanon/beirut/beirut-3572/
Conclusion
The private sector has the potential to rehabilitate existing publicly-owned hydropower plants and develop new river and non-river sources. According to the UNDP, private sector investment in hydropower would significantly increase power output at existing plants to 95.4 percent, hastening Lebanon’s 2020 goal of 12 percent renewable energy.34
Chapter 3 Questions
- What are the steps in renewable energy project development? Which step do you think is the most difficult to complete? How would you handle gaining community approval or a “social license to operate”? Debate in groups.
- Which project delivery mechanism transfers the most risk to the private sector? Find an example of this mechanism being used for a renewable energy project and discuss its structure and implementation in groups. Do you think this mechanism is more common in certain countries? Why or why not?
- A new utility-scale solar PV system has a capacity of 50 MW with a total installed cost of $0.50/watt. Assume 5 peak sun hours in your location, an offtake agreement of $50/MWh, a discount rate of 10 percent, and a system life of 25 years. What is the simple payback of your system?
- For question 3, what is the net present value? What is the benefits-cost ratio? Is it a good investment?
- Define the “S Curve.” Research a renewable energy project development firm or technology firm. At which stage is the firm in the “S Curve”?
- Brainstorm and research some strategies for overcoming the “Death Valley.” Discuss in groups.
Chapter 3 Glossary
Authorities Having Jurisdiction (AHJ): an entity responsible for enforcing a code, or ensuring the standard of equipment, materials, installations and procedures.
BEPTC: The National Renewable Energy Laboratory framework for project development in the renewable energy sector, consisting of: Baseline, Economic, Policy, Technology and Consensus steps.
Cap and Trade System: also known as emissions trading, this system empowers emissions producers to manage their own response to national policy either through reducing their emissions and selling the remaining capacity to other producers, or maintaining emissions at the same rate and buying capacity from others.
Death Valley: an uncertain period in which a start-up runs out of initial R&D funding and revenue is not yet being generated from sales.
Debt Financing: Borrowing money from a bank or another company to finance a project in the form of a loan.
Environmental Assessments (EA): also known as Environmental Impact Assessments (EIAs), it is a thorough assessment of the environmental impact, both positive and negative, of a proposed project, as required by a local or national jurisdiction. EAs should include a level of public participation and decision-making.
Equity Financing: Raising money for a project by selling shares in it.
Feed-in-Tariffs: Guaranteed high offtake rates for renewable energy to spur investment.
Government Incentive: financial assistance (actual or in-kind) offered to private enterprise to promote a certain action. Includes tax breaks, grants, infrastructure sharing, and other resources.
Host Community: those who live close to and will be impacted by the energy generation plant, that is, a large PV installation, wind farm, or hydropower plant.
Independent System Operator: an entity responsible for managing a regional energy grid, as authorized by the Federal Energy Regulatory Commission (FERC).
Investment-Grade Audit / Assessment: a thorough examination of an energy resource or a facility’s energy consumption to determine projects that will reap the greatest economic return.
Minimum Acceptable Rate of Return (MARR): An economic term defining an investor’s risk tolerance. Generally, the greater the MARR, the more exposure to risk.
Net Energy Metering: an incentive similar to a feed-in-tariff, whereby small energy producers with grid-tie systems sell excess energy to the grid at the same retail electricity price at which they buy it.
Net Present Value (NPV): An economic term used to determine the profitability of an investment or project, describing the present value of a project’s return on investment, minus the initial cost of the investment.
Offtaker: A party buying a product or service (in this case, energy).
Public Private Partnership (PPP): Long-term partnership between local authorities and private enterprise to deliver a project.
Renewable Energy Credit (REC): a tradable commodity that represents renewable energy production separate from the sale or use of the energy itself.
Renewable Portfolio Standard (RPS): a government regulation requiring a percentage of energy production come from renewable sources.
Site, Resource, Off-take, Permits, Technology, Team and Capital (SROPTTC): A framework for managing the physical construction of a renewable energy project, developed by the National Renewable Energy Laboratory.
Social License to Operate (SLO): The ongoing positive perception and approval of a project, its business practices and operations by its host community and employees. When a project is no longer perceived as positive, it may experience protests, boycotts, and applications for official permits to be removed. It can be very costly to restore a SLO once it has been lost.
Stakeholder: an individual or group with an interest, or “stake”, in the matter at hand.
References
1. Dobbs, R., H. Pohl, D.Y. Lin, J. Mischke, N. Garemo, J. Hexter, S. Matzinger, R. Palter, and R. Nanavatty. 2013. Infrastructure Productivity: How to save $1 Trillion a Year. Publication. McKinsey Global Institute. https://mckinsey.com/~/media/McKinsey/Industries/Capital Projects and Infrastructure/Our Insights/Infrastructure productivity/MGI Infrastructure_Executive summary_ Jan 2013.ashx (accessed September 15, 2018).
2. Infrastructure Report Card 2017. “Publication. Infrastructure Report Card.” https://infrastructurereportcard.org/wp-content/uploads/2017/01/Energy-Final.pdf (accessed September 15, 2018).
3. California Energy Commission. 2018. “Differences Between Publicly and Investor-Owned Utilities.” http://energy.ca.gov/pou_reporting/background/difference_pou_iou.html (accessed September 15, 2018).
6. “FIT Overview.” Ieso.ca, http://ieso.ca/sector-participants/feed-in-tariff-program/overview
7. Hill, B. February 24, 2017. “Ontario Energy Minister Admits Mistake with Green Energy Program.” Global News, https://globalnews.ca/news/3272095/ontario-energy-minister-admits-mistake-with-green-energy-program (accessed September 15, 2018).
8. Fleming, D. February 02, 2014. “Ireland’s Rural Protests Over Wind Energy.” BBC News, https://bbc.com/news/world-europe-25966198 (accessed December 03, 2018).
9. Bacchi, U. June 04, 2018. “Threatening Wilderness, Dams Fuel Protests in the Balkans.” Reuters, https://reuters.com/article/us-bosnia-environment-dams/threatening-wilderness-dams-fuel-protests-in-the-balkans-idUSKCN1J0007 (accessed December 03, 2018).
10. SMART Business Tools|AstonEco Management. 2018. “SMART Business Tools.” https://astoneco.com/en/resources/smart-business-tools
11. Springer, R. 2013. “A Framework for Project Development in the Renewable Energy Sector.” Technical paper no. NREL/TP-7140-57963. National Renewable Energy Laboratory. Golden, Colorado: National Renewable Energy Laboratory. https://nrel.gov/docs/fy13osti/57963.pdf (accessed September 15, 2018).
12. “The World Factbook: CURACAO.” Central Intelligence Agency, https://cia.gov/library/publications/the-world-factbook/geos/cc.html (accessed December 10, 2016).
13. Aqualectra. 2016. “Can We Live with Wind Energy?” http://aqualectra.com/files/PDF/fly_energia_bientu_eng.pdf (accessed December 10, 2016).
14. Aqualectra. 2016. “Aqualectra Tariffs.” http://aqualectra.com/files/Tarieven_2016/Dec_Valid_Tariffs_as_per_december_01_2016.pdf (accessed December 1, 2016).
16. Solar Gis Maps. 2016. “Solargis.” Satellite-derived Irradiance Database http://solargis.info/imaps/#c=12.145325,-68.85915&z=11 (accessed December 10, 2016).
18. Assuming a conservative $1.50/watt installed cost, $1.50/watt * 171,000,000 watts = $256,500,000.
19. 290,400,000 kWh production per year * $.28/kWh average charge to residential, commercial and industrial consumers = $81,312,000.
20. $256,500,000/$81,312,000 = 3.15 years.
21. NPV = PV of Annual Revenues – PV of Cost. PV of Annual Revenues of $81,312,000 over 25 years at 10 percent discount rate = $738,072,277.96. PV of Cost = $256,500,000. NPV = $738,072,278 - $256,500,000 = $481,572,278.
22. $81,312,000 income/$256,500,000 investment = .32 or 32 percent.
23. Analysis assumes vertical integration of investor-owned utility. PV plant will be owned and operated by Aqualectra. Analysis also assumes 100 percent utilization of power produced from PV system.
24. Benefit-cost ratio = PV of benefits/PV of costs = $738,072,278/$256,500,000 = 2.9.
25. A desert island, Curacao does not have to contend with heavily shaded areas. Therefore, this criterion was not taken into account. However, shading issues will be considered in the Stage Two Assessment.
26. 171,000,000 watts/350 watts = 488,571.43 modules.
27. 488,571.43 modules * 2.5m2 = 1,221,428.57 m2 /1,000,000 = 1.22143 km2.
28. Lebanese Parliament. September 9, 2017. “Official Journal.” Regulating Public Private Partnerships. Beirut : Official Journal.
29. Hydropower from Non-River Sources: The Potential in Lebanon. Report. The Ministry of Energy and Water. Beirut, Lebanon: United Nations Development Program, 2013.
30. Osseiran, K. 2015. “Geothermal Energy Potential for Lebanon.” LinkedIn SlideShare, June 01, 2015. https://slideshare.net/KarimOsseiran/geothermal-energy-potential-for-lebanon (accessed October 23, 2018).
32. Osseiran, K., S.M. Alaya, and V. Kabakian. 2013. Hydropower in Lebanon; History and Prospects. 4th ed. Report. CEDRO Exchange. Beirut, Lebanon: United Nations Development Program.
33. Hydropower from Non-River Sources: The Potential in Lebanon. Report. The Ministry of Energy and Water. Beirut, Lebanon: United Nations Development Program, 2013.
34. Lebanon targets 12% renewables in energy mix by 2020, https://aa.com.tr/en/energy/renewable/lebanon-targets-12-renewables-in-energy-mix-by-2020/8235
* See online resources for additional information on Time Value of Money calculations.