Model 2: Distributed Renewable Energy Resources
In the previous chapter, we explored the development of grid-scale renewable energy projects. These large-scale projects, however, are no longer the only option. Remember Edison’s original concept of decentralized generators? We may be coming around to his original plan in the second model of renewable energy development: On-site Power Generation.
Thanks to an increased interest in renewable energy production, and energy policies like the Public Utility Regulatory Policy Act (PURPA), energy systems at the site of consumption are rivaling the traditional monopoly of utilities.
PURPA passed in 1978 in the U.S. to reduce U.S. dependence on foreign oil and to promote domestic energy production. PURPA required utilities to buy energy from Non-Utility Generators (NUGs), disrupting their natural monopoly, and promoting alternative, renewable sources. In this framework, Distributed Energy Resources (DERs), such as the grid-tie and grid-tie battery backup solar systems described in Chapter 2, emerged and are now reshaping the U.S. energy landscape.
In addition, the rapidly declining cost of solar energy has led to a surge in rooftop solar systems. These buildings remain connected to the grid, but generate electricity on-site to reduce their demand. The cost of solar energy systems have declined dramatically since the early 2010s, as shown in Figure 4.1, finally reaching grid parity, or cost equivalence, with conventional fuels.
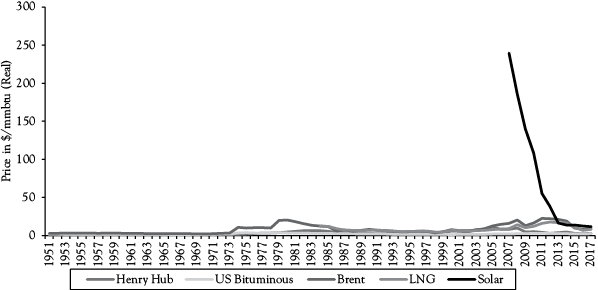
Figure 4.1 Price of energy production by energy type from 1949–2012, showing the rapid reduction in cost of solar energy production since the early 2010s.1
Source: Michael Parker and Flora Change, Bernstein; Data from EIA, CIA, and the World Bank
Basic research and improvements in the manufacturing process have greatly reduced costs, from $76/watt in 1976 to $0.36/watt crystalline silicon in 2018. Richard Swanson, founder of solar panel manufacturer SunPower Corporation, noticed that PV module prices drop 20 percent for every doubling of shipped volume. The trend is now called Swanson’s Law2 and is shown in Figure 4.2.
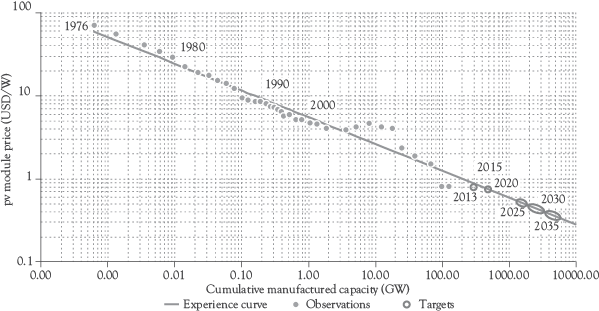
Figure 4.2 Swanson’s law.
Residential / On-Site Renewable Energy System Project Development
Interconnecting a grid-tie renewable energy system with the grid can be a complex process. In the U.S., permits are granted by local Authorities Having Jurisdiction (AHJs), each with their own requirements. With over 18,000 AHJs in the U.S., this lack of standardization significantly increases the soft costs, or non-hardware costs, of installing a system.
For most small-scale solar PV systems (<10–15 kW), there is a simplified permitting process. Thanks to the work of Bill Brooks and the U.S. Department of Energy, many developers use the “Expedited Permit Process for PV Systems” or Solar ABCs in developing their permit application package.3
Following installation, the developer or installer submits a site plan, electrical diagram, and specification sheets to the AHJ. The AHJ will review and, sometimes, perform an inspection to ensure the array is compliant with all structural and electrical rules. Next, an interconnection application is submitted to the utility along with the stamped permit. The utility checks that electrical protections (overcurrent protection devices-OCPDs, AKA circuit breakers) are in place to prevent energy export in the event of a grid outage, and to disconnect the system during a fault or short circuit. Once approved, the utility installs a bidirectional meter to determine net building consumption and the array may be “turned on,” meaning the grid-tie inverter may now connect with the grid. In the case study at the end of this chapter, the author details the solar PV permitting process for a residential client in California.
Small-scale wind energy systems (</=100 kW) follow a similar review and permitting process, though are more complex due to the high variability of wind, as discussed in Chapter 2, and must consider proximity to airports. The Midwest Renewable Energy Association (MREA) has developed an excellent template “Small Wind Site Assessment Report,” which details the standard requirements.*
Financing Distributed Renewable Energy Resources
Numerous financing options have emerged in recent years for small-scale renewable energy systems.
Small Scale Financing Options
Similar to purchasing a car, home or business, owners can purchase a solar or wind energy system through a zero-down lease or power purchase agreement (PPA). In the case of a lease, one pays a leasing company a fixed monthly fee based on the estimated production of the system. In the case of a PPA, the beneficiary hosts power generating equipment and pays a fixed price per kWh to the provider for the energy produced by the system. The business model, known as Solar as a Service (SaaS), was first introduced in 2007 by Sunrun. While this service offsets the steep initial cost, it essentially replaces the utility with a third-party service provider and costs more long term than if the user owned the system.
Commercial and Industrial Financing Options
Commercial and industrial energy projects involve more complex financing than residential installations. One technique used to attract debt or equity financing is warehousing, packaging multiple renewable energy projects together into one investment opportunity, which reduces risk to investors through diversification.4 To enter into a warehouse, an energy project must already have a long-term PPA in place, assuring the investor that there is a market for the energy that will be produced. Warehousing is a way of developing funding during the high-risk development and construction phase of an energy project. Once the asset is fully constructed and generating power, it is often transferred to a Yieldco.5
Yieldcos are funds of aggregated renewable energy projects with predictable, long-term PPAs. They allow investors to earn tax-free dividends from consistent cash flows, as a result of guaranteed income from the projects’ PPAs, and renewable energy subsidies. Yieldco expansion is made possible by regular absorption of new projects, often developed within a warehousing agreement, as part of a pipeline or drop-down schedule. In the U.S., yields are at about 7 percent, and, in the UK, 6 percent.6
As more homeowners seek to fully own their systems, asset-backed securitization is becoming more popular. Securitization is the process of valuing a portfolio of renewable energy assets based on their PPA cash flows and making them tradeable instruments with their own monetary value, or “securities.” You may remember the Great Recession of 2008, when sub-prime mortgages were securitized, and the “bubble burst” when home prices plummeted. Renewable energy projects are far less speculative as cash flows from kWh sales are assured.7
Another innovative finance method is the Energy Savings Performance Contract (ESPC) that allows organizations to make improvements to their energy usage/generation systems with no up-front costs, and to pay for their system over time through their energy savings. This funding mechanism is commonly employed in U.S. Government construction and renovation projects and begins with energy conservation measures, followed by on-site renewable energy systems to achieve net zero—a state in which a building’s energy consumption is 100 percent offset by all efficiency measures and renewable onsite production. The split varies by facility but is usually 75 percent demand reductions from energy efficiency and 25 percent generation from on-site renewable energy.
Combined, these financing mechanisms are helping to unlock the capital that is dramatically lowering the levelized cost of energy (LCOE), a method for comparing the relative cost of energy produced by different sources. LCOE shows the cost of every unit of energy in $/kWh. This is an important measure for understanding grid parity, renewable energy generating power at a price equivalent to or less than the price of purchasing power from the grid, assuming the grid is primarily from fossil fuels.
LCOE = Life Cycle Cost / Lifetime Energy Production8 9
Life Cycle Cost (LCC) = Project Cost – Investment Tax Credit (ITC)† + O&M + Loan Payments – Present Value of Performance Incentives‡
Let’s take an example of a house that consumes 10,000 kWh/year and has 5 peak sun hours, requiring a PV array of 6.5 kW. The system will produce 10,083 kWh/year. Over a 25-year life it will produce 252 MWh (See Chapter 2 for more detail on how to do these calculations). Assume the inverter will be replaced once in the system’s lifetime, which adds $0.40/watt to O&M. Assume the system is owned so there will be no loan payments, and that the owner receives $0.10/kWh for performance incentives. Also, assume a 10 percent discount rate.
Components of Lifecycle Cost
Project Cost = $19,500 ($3/watt * 6,500 watts).
ITC = $5,850 (30% of $19,500)
O&M = $2,600 ($0.40/watt * 6,500 watts)
Loan Payments = $0
Present Value of Performance Incentives = $9,152.38 (10,083 kWh per year * $0.10/kWh = $1,008.30/year over 25 years at 10 percent discount rate)
Without the performance incentives
Life Cycle Cost = $16,250
Levelized Cost of Energy = $16,250 / 252,000 kWh
= $0.06/kWh
With the performance incentives
Life Cycle Cost =$7,097.62
Levelized Cost of Energy = $7,097.62 / 252,000 kWh
= $0.03/kWh
Considering that the average cost of electricity in the U.S. is $0.12/kWh, this LCOE is well below grid parity!
As explored, greater access to capital is transforming the electrical grid from a centralized utility with distributed customers to a decentralized web of prosumers, former consumers who are now also contributing to the grid. In the next chapter, we will discuss the final and newest model of interconnection, characterized by prosumers aggregating into communities of shared local resources and networks called microgrids.
Case Study: Permit Process for Grid-Tie PV System in California
In 2016, the author designed a 6 kW grid-tie solar PV system for a residential client in Fairfield, CA, 50 miles east of San Francisco. From site assessment and design to permitting and interconnection, this case study illustrates the steps and complexities involved in the process of designing and interconnecting a residential grid-tie solar PV system.
Pre-permit Package
The first step was to perform a site assessment to determine the optimal location for a PV array. This involved identifying rooftop obstructions and running a shading simulation using Helioscope.§ Along with Helioscope, Aurora Solar is often used by solar energy designers.
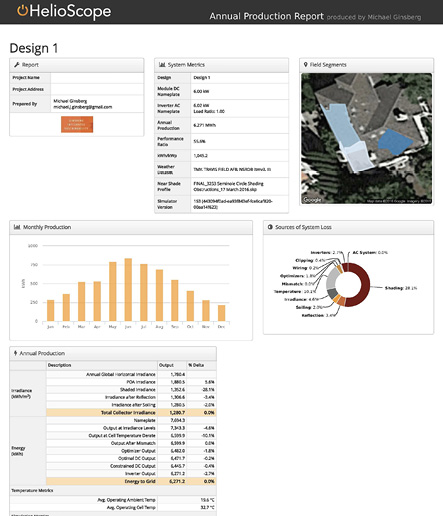
Figure 4.3 Draft design for a household PV system.
Source: Author and HelioScope
Next, the author developed a site plan, and demonstrated that the structural and electrical requirements met the AHJ’s standards. Equipment manufacturer specification sheets were provided in an appendix, with relevant information circled. The following are sections from the actual permit application.
Permit Package Section 1: Project Information
System Description: The array consists of a 6 kW DC roof-mounted PV power system operating in parallel with the utility grid. There are (24) 250-watt modules that run in series in two power optimizer strings to (1) 6 kW string inverter. The array is mounted to a roof comprised of concrete tile using the engineered racking solution from Everest with Flat Tile Roof Hooks-90 degrees from Solar Roof Hook.
System Specifications
- String Inverter—SolarEdge SE6000A-US (1)
- Modules—Boviet 250 Polycrystalline silver BVM6610P_09252015 (24)
- Power Optimizers (Module Add on)—SolarEdge Power Optimizer P300 (24)
- Railing
○ Everest CrossRail 48-S, 166” Mill (14pc)
○ Mounts(46 #17542) with screws
○ Mid clamps: 26pc
○ End clamps: 18pc
○ Rail splice: 8pc (with bolts)
○ MC4 connectors: 10 pack male/female
- Attachment System
○ Flat Tile Roof Hooks 90 Degree 38 mm and kit (20 hooks)
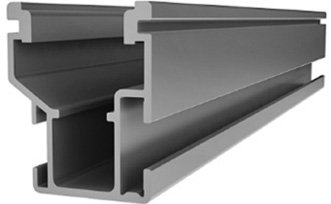
Figure 4.4 Railing: Everest Crossrail 48-S.
Permit Package Section 2: Structural
Figure 4.5 below shows the nearest climatological data for the region, including the daily average wind speed and gust, and maximum peak gust. At a minimum, the array must be designed to withstand maximum wind speeds greater than the maximum peak gust. Often, AHJs specify much higher gusts, as does the City of Fairfield.

Figure 4.5 Napa County Airport, CA Wind Speed Data (16 miles SW of Fairfield, CA 94534).10
Daily Mean Speed: 7.7 MPH; Maximum Peak Gust: 61 MPH (registered in August 2008)
Source: Courtesy of Western Regional Climate Center, Desert Research Institute.
Figure 4.6 shows the maximum span length across a roof pitched 0 to 7 degrees based on ultimate (maximum) wind speeds expected in the region and expected snow load in pounds per square feet (psf). Exposure C means open terrain with scattered obstructions having heights less than 30 feet. Using the information above, we know the ultimate wind speed is 61 MPH, which is less than the lowest category of 110 MPH. Also, the city of Fairfield states the wind design criteria is 110 MPH and Exposure C.11
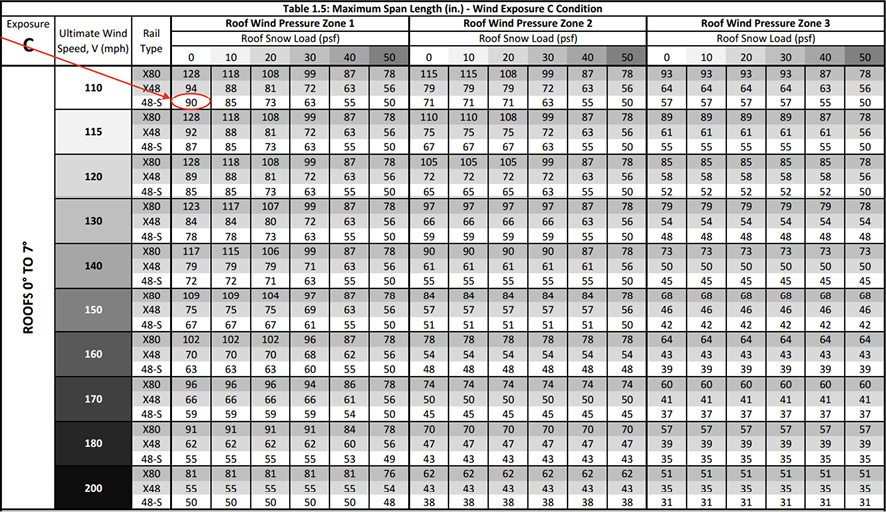
Figure 4.6 Diagram showing the maximum span length across a roof pitched 0 to 7 degrees based on ultimate (maximum) wind speeds expected in the region and expected snow load in pounds per square feet (psf).
Source: Kelley, Shawn P. Moment Engineering + Design for Everest Solar Systems LLC
The rail type is 48-S and, according to the National Oceanic and Atmospheric Administration (NOAA), the region has a roof snow load in pounds per square feet (psf) of 0.12
Roof Wind Pressure Zone refers to the area of the roof subjected to the wind load. As shown in Figure 4.7, Zone 1 is interior, and since it is the largest area, accounting for about 80 percent of the roof surface, it has the lowest load. Zone 2 are end zones, the roof perimeter, and account for 15 percent of the surface, and thus have a higher load. Zone 3 are corners, account for 5 percent of the surface, and have the highest load.

Figure 4.7 Roof types.
The author’s client has a Gable Roof of 0 to 7 degrees pitch and the site assessment revealed the array will be installed on the roof interior, Zone 1. As shown in Figure 4.6, there is an inversely proportional relationship between zone and maximum span length—as you increase the zone number from interior to corners, you decrease maximum span length. It should be noted the majority of PV systems are in Zone 1.
Therefore, consulting the maximum span length table (Figure 4.6), we can determine that the maximum span length is 90 inches, or 7.5 feet.
Attachment System: F-Tile Solar Roof Hook
The roof hooks shown in Figure 4.8 were used to attach the above railing to the client’s engineered composite roof. Spacing between hooks was followed as specified by the manufacturer.

Figure 4.8 Roof Hooks used to attach rail to engineered composite roof.*
* For specifications refer to: https://solarroofhook.com/sites/solarroofhook.com/files/reports/pdfFiles/17540spec_0.pdf
For installation guide refer to manual:https://solarroofhook.com/sites/solarroofhook.com/files/flat_tile_install_instructions_2-small.pdf
Or video: https://youtube.com/watch?time_continue=22&v=hSW7dFLrYls
Permit Package Section 3: Roof Plans (Showing 3’ Setbacks and Roof Attachment Points)
Fairfield, CA required detailed roof plans with dimensions. Three-foot setbacks, space from the ridge and one and a half feet from hips or valleys if modules are on both sides, were required to allow walking space for firefighters and other safety personnel to access the system. These setback rules are particular to CA. In 2018, the three-foot requirement was modified to one and a half feet to allow for more modules on the roof. This is an ongoing debate between the solar energy and fire protection communities.13
The author created a 3D roof plan using Google Maps, illustrating the placement of modules, rafters, hooks, and dimensions, shown in Figure 4.9.

Figure 4.9 3D roof plan illustrating the placement of PV modules, rafters and hooks. Details 1, 2 and 3 show the scaled placements of PV modules, rafters, hooks and attachments on each segment of the roof.

Figure 4.9 (Continued)
- 3D Roof Plan (not to scale)
- Detail 1 (scaled)
- Detail 2 (scaled)
- Detail 3 (scaled)
Permit Package Section 4: Electrical
Figure 4.10 shows the one line diagram and electrical details for the 24 module array using the SolarABCs template described above. The author sized the system using the string system maximum voltage sizing method detailed in Chapter 2.¶ Also, the author included electrical specifications of the modules and balance of systems (inverters and OCPDs).14
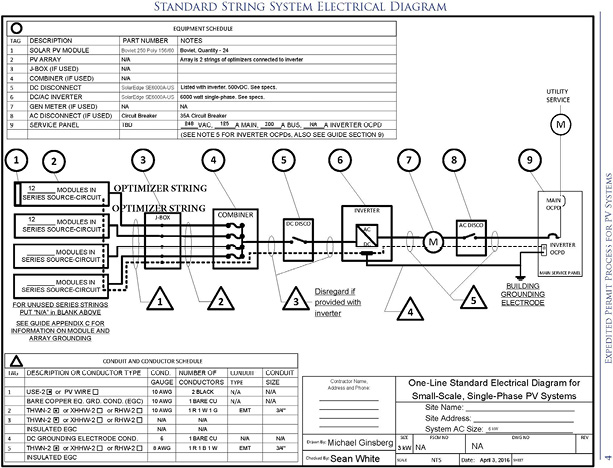

Figure 4.10 One line diagram and electrical details for a 24 module solar array.
Source: Author, Expedited Permitting Process, Solar ABCs http://www.solarabcs.org/about/publications/reports/expedited-permit/
Once the City of Fairfield Building and Fire Safety Division reviewed and stamped the package, an inspector visited the site and completed the construction and building inspection permit. Next, the author completed and submitted interconnection application forms to the utility, Pacific Gas & Electric (PG&E). These are shown in Figures 4.11 and 4.12. This form applies to systems of 30 kW or less interconnecting with the grid.
In Figure 4.11, the author stated the estimated annual production and usage in kWh to demonstrate net generation. Note, under the PG&E net energy metering (NEM) agreement, NEM systems must be sized less than 110 percent of the customer’s previous year’s kWh usage and account for projected future increases in demand, such as from an extension to the house or an electric vehicle. Essentially, PG&E wants to ensure the residence is not operating as a net energy exporter as the NEM agreement is meant just to offset consumption, or make the customer net zero on consumption. Here we see the customer still has a demand of 7,415 kWh based on the previous years’ kWh demand, which is acceptable to PG&E.

Figure 4.11 Net energy metering agreement and customer authorization.
A second form, Figure 4.12, was submitted to PG&E that described the array and its components. Most important to PG&E, it identified the AC disconnect was present so the utility knows it can shut off the system in the event of a fault or other issue.

Figure 4.12 Net energy metering application form.
Source: Pacific Gas and Electric

Figure 4.12 (Continued)
The author submitted the two forms, accompanied by the original approved permitting paperwork, to PG&E, which then performed an inspection of the system at the customer’s residence, installed a bidirectional meter, and connected it to the PV inverter.
From the submission of the paperwork to the City of Fairfield to PG&E’s approval took approximately three months. The system was interconnected and is now reducing the customer’s annual electric bill.
As you can see, the permitting process is highly site-specific and requirements vary by jurisdiction. Current efforts to harmonize permitting requirements across jurisdictions will go a long way toward reducing the soft costs of renewable energy system installations in the U.S. and other developed countries with centralized grids.
Chapter 4 Questions
- Use the Department of Energy’s PVWatts (https://pvwatts.nrel.gov/) to determine if a solar PV array makes economic sense on your or a family member’s roof. Use default settings. What is the annual energy (kWh/year) and economic value of your system?
- Find the climactic data for your region. Using the Exposure C table (Figure 4.6) in the case study, determine the maximum span length of a railing on your roof. Check your local permitting requirements and compare what you have determined against their requirements.
- Review the “Expedited Permit Process for PV Systems—Standard String System” in the online resources for this book and at http://www.solarabcs.org/about/publications/reports/expedited-permit/forms/index.html. Research online and find PV modules and inverter(s) you would want to use for your house. Using the methods described in Chapter 2, determine your house’s electrical consumption per year, the required power output in kW, and the optimal number of modules per string inverter. Draw a sample site plan.
- Determine the Levelized Cost of Energy (LCOE) of a solar PV system given the following information:
- PV array of 10 kW
- $3/watt installed cost
- 25 year system life
- 5 peak sun hours and 85 percent efficiency
- Assume no O&M costs or credits
- Repeat the calculation in Question 4 with a 30 percent ITC. What is the difference?
- What is the cost of electricity where you live? Has your PV system reached grid parity? Is it above or below?
- Review the MREA Small Wind Site Assessment template in the online resources for this book. Determine if your or a family’s house would be an ideal location for a small wind turbine.
Chapter 4 Glossary
Asset-backed Security: Cash-flow generating asset, from loans to PPA revenue, packaged together into a tradeable security.
Distributed Energy Resources (DER): Energy source generated close to where it is consumed.
Energy Savings Performance Contract (ESPC): Building owners pay zero upfront for energy efficiency and renewable energy systems. Contractor is paid through resulting energy savings.
Levelized Cost of Energy (LCOE): Method for comparing the value of energy production for diverse energy sources. The total lifetime costs of the asset (design, construction, and operation) divided by the lifetime revenue (income from energy produced).
Non-Utility Generators: Houses, small businesses, and other non-utility entities able to generate electrical power.
Prosumer: an individual or organization that both consumes from the grid and produces energy for the grid.
Public Utility Regulatory Policy Act (PURPA): Legislation passed by the U.S. Congress in 1978 in response to the global energy crisis, with the objective of reducing America’s dependence on foreign oil and encouraging renewable energy and energy conservation.
Solar as a Service (SaaS): Users host solar equipment owned and managed by a private company, and pay the company a set price for the resulting energy generated.
Variable Renewable Energy (VRE): Also known as intermittent power source, an energy source where the rate of production cannot be controlled by the generation facility, for example, solar and wind power.
Warehousing: A financing model packaging early-stage renewable energy projects into a single investment vehicle to mitigate risk.
Yieldcos: a high-yield fund made up of renewable energy projects with long-term PPAs.
References
1. Wile, R. April 10, 2014. “The Solar Industry Has Been Waiting 60 Years For This To Happen—And It Finally Just Did.” Business Insider, http://businessinsider.com/solar-price-terrordome-chart-2014-4 (accessed September 15, 2018).
2. The Economist. November 21, 2012. “Sunny Uplands.” https://economist.com/news/2012/11/21/sunny-uplands (accessed September 15, 2018).
3. Brooks, B. July 2012. “Expedited Permit Process for PV Systems.” http://solarabcs.org/about/publications/reports/expedited-permit/pdfs/Expermitprocess.pdf
4. Zipp, K., and R. Barrett. January 23, 2017. “Solar Financing Trends in 2017.” Solar Power World, https://solarpowerworldonline.com/2017/01/solar-financing-trends-2017/ (accessed September 15, 2018.)
5. “Renewable Energy Project Warehouse Facilities Are on the Rise | Insights | Skadden, Arps, Slate, Meagher & Flom LLP.” Overview|About|Skadden, Arps, Slate, Meagher & Flom LLP, https://skadden.com/insights/publications/2016/01/renewable-energy-project-warehouse-facilities-are(accessed September 15, 2018).
6. Stevenson, D.K. February 07, 2018. “Yieldcos—a Renewable Energy Option for Yield-hungry Investors.” Financial Times, https://ft.com/content/ca1641fc-0b37-11e8-bacb-2958fde95e5e (accessed September 15, 2018).
7. DNV, GL. 2018. “Securitization of Solar Projects.” https://dnvgl.com/cases/securitization-of-solar-projects-86650 (accessed September 15, 2018).
8. Bushong, Steven, Adriana Marcela, Joshua, Nathanael, Samuel, and Mukund. May 23, 2016. “How to Calculate Solar LCOE-and Understand Its Values.” Solar Power World, https://solarpowerworldonline.com/2016/05/calculate-solar-lcoe-understand-values/ (accessed December 04, 2018).
9. Freeman, J., and J. Simon. 2015. “Analysis of Aurora’s Performance Simulation Engine for Three Systems.” Technical Paper no.NREL/TP-7A40-64213. National Renewable Energy Laboratory. Golden, CO: National Renewable Energy Laboratory.
10. Courtesy of Western Regional Climate Center—Desert Research Institute. (accessed March 1, 2016). Direct link no longer available. Also go to NOAA for US Weather Data. https://www.ncdc.noaa.gov/climate-information.
11. “Structural Criteria for Residential Rooftop Solar Energy Installations.” PV Toolkit Document #5. City of Fairfield. https://fairfield.ca.gov/civicax/filebank/blobdload.aspx?BlobID=10850
12. “Travis Air Force Base, Fairfield CA Meteorological Data.” NOAA. ftp://ftp.ncdc.noaa.gov/pub/data/EngineeringWeatherData_CDROM/engwx/travis_ca.pdf
13. Farneth, I. 2018. “New California Setback Rules.” July 1st, www.renvu.com. https://www.renvu.com/Learn/New-California-Setback-Rules-July-1st-2018.
14. Included in the online resource for this book.
† The US ITC for residential PV will continue at 30 percent until 2020 when it will decline to 26 percent.
‡ Performance-Based Incentives vary by country, province and state. Generally they include Renewable Energy Credits and carbon credits. System owners can sell these products to firms seeking to support renewable energy or become carbon neutral.
§ See online resources for this book for shading simulation sample.
¶ Although the steps involved in determining all of the electrical specifications of a PV array are outside the scope of this book, the author has included several useful references on the online site for this book.