1. What Workers Want—The Big Picture
“Human capital will go where it is wanted, and it will stay where it is well treated. It cannot be driven; it can only be attracted.”
—Walter Wriston, Former Chairman, Citicorp/Citibank
An accurate understanding of motivation in the workplace is more than an academic pursuit. The effectiveness of critical business policies depends on the extent to which our assumptions about human motivation are accurate. If they are not accurate, they either have no impact at all, or worse, they boomerang and damage the organization. Accuracy depends not only on wisdom and experience, but on systematic research. Research protects us from personal bias, seeing what we want to see instead of what is there. Research also protects us from the lure of fads and fashions.
The problem with many theories in this field is not that they have nothing to say, but rather that they:
• Focus on just one aspiration as the central motivator (and, therefore, the central explanation) of employee morale and performance
• Claim that most people are frustrated with the achievement of that aspiration (the “sky is falling” scenario) and that dealing with that single frustration will solve all problems
• Typically assert that what the theorist has uncovered characterizes a “new generation” of workers and is therefore novel
It is helpful to review a few of the more prevalent motivational myths and fads—those involving generational differences and those about people’s attitudes toward work—before we review the results of systematic research.
Blame It on the Young
“Children today are tyrants. They contradict their parents, gobble their food, and tyrannize their teachers.”
—Socrates (470–399 B.C.)
For reasons that we will soon show are misguided, popular theories of what employees want change continually, and the change is often couched in terms of “new generations” of workers whose needs and expectations differ sharply from those of their predecessors. We are told that there are important differences between the “Baby Boomers” and “Generation X.” And, here come the “Millennials.” It is theorized that they all need to be dealt with differently because they are all different.
These seemingly significant differences make for interesting reading, and the business media have surely accommodated us. Numerous stories have been published on generational change and its implications for management practice. Generation X, for example, is widely assumed to put maximum emphasis on individual freedom and minimum emphasis on company loyalty. A number of years ago, the author of a Fortune article on “GenX” advised that, “If your competitor lets employees keep a birdbath in the office, you will have no choice but to follow suit.”1 A Time columnist summed up the generation as one that, “...would rather hike in the Himalayas than climb a corporate ladder.”2
These observations are seductive; managing people is a difficult and complicated job filled with many headaches, and most managers want to learn all they can about human motivation. Furthermore, the answers provided by the theories on generational change seem intuitively correct. When a certain age in life is reached, people almost inevitably begin to talk about “that new generation” in a way that means, “What’s this world coming to?” The new generation is not only “not like us,” but they are “not like we were at that age.” This discussion has been going on forever. See the Socrates quote that opened this chapter.
The fact that young people are so often viewed with apprehension by their elders should make us think hard about the validity of assertions about genuine generational change. It may be just a matter of age, but even more important, it may be a confusion of what’s apparent, such as the clothes and music preferences of young people, with what is real, such as their basic goals as they enter the workforce.
An early and dramatic example of this tendency to confuse youthful tastes with human needs in the workplace occurred in the early 1970s. As the tumultuous ‘60s ended, a deluge of books, television specials, and newspaper articles spotlighted a new generation of workers. These young people were (supposedly) severely discontented with work. Even worse, it was popularly suggested that the traditional sources of worker grievances (unhappiness with pay, benefits, hours, and working conditions) were no longer the primary causes of worker dissatisfaction. We were told that the very nature of the work itself drove the “new” worker to near distraction. This worker was depicted as a product of the ‘60s, when rebellion against “over 30” adult materialistic values appeared widespread, and freedom and self-actualization were the goals. These workers, it was claimed, would not settle for their fathers’ routine and mind-numbing jobs.
The concern about workers and work at that time was perhaps best summarized in a 1973 study sponsored by the U.S. Department of Health, Education, and Welfare, titled Work in America. In describing the profoundly negative impact work seemed to have on so many young employees, the study’s editors reported the following:
The discontent of trapped, dehumanized workers is creating low productivity, increasing absenteeism, high worker turnover rates, wildcat strikes, industrial sabotage, poor-quality products, and a reluctance of workers to give themselves to their tasks.
Work-related problems are contributing to a decline in physical and mental health, decreased family stability and community cohesiveness, and less “balanced” political attitudes. Growing unhappiness with work is also producing increased drug abuse, alcohol addiction, aggression, and delinquency in the workplace and in the society at large.3
That statement was quite an indictment, and one that the media repeated endlessly. Of course, when a single factor (in this case, “dehumanizing” work content) is presumed to be responsible for so many business, social, and personal ills, rest assured that a single cure would soon follow. In the case of the HEW report, the cure (or, more accurately, the cure-all) was seen as the magic of “job enrichment.”
The Lordstown Strike and Job Enrichment “Solution”
Based on Frederick Herzberg’s “motivator-hygiene” theory, job enrichment was seen as an attempt to reinvigorate work with the prospect for real achievement, thus creating genuine satisfaction and motivation. In brief, the motivator-hygiene theory states that the work itself—the challenge of doing a job from start to finish, and so on—is the true motivator of workers, while the work environment—“hygiene” factors such as pay, benefits, and human relations—cannot positively motivate workers but, when adequate, temporarily prevents them from feeling unhappy. Therefore, the key to true motivation and lasting satisfaction is job enrichment: structuring work so it provides workers with a sense of achievement and accomplishment.4
The motivator-hygiene theory and the job-enrichment solution were extraordinarily popular in management thinking and teaching for much of the 1970s but have since largely faded from view. That is not surprising because, for one thing, cure-all solutions for cause-all problems are seldom real. Despite its academic trappings, the hullabaloo smacked of patent-medicine salesmanship. In fact, considering that so much of the expressed concern was about blue-collar workers on assembly lines, why had no labor unions placed demands for more meaningful work on their collective-bargaining agendas? Indeed, many labor leaders explicitly declined to join the rising chorus of voices concerned with job content.
The attention given to a 1972 workers’ strike in the Lordstown, Ohio, assembly plant of General Motors reinforced the skepticism about job enrichment and its claims. This strike was initially and widely interpreted to be the result of the dehumanizing nature of assembly-line work. However, the reality of Lordstown differed almost entirely from the way the strike was generally portrayed in the media and academia. In the 1960s, GM built a new factory at Lordstown that was specially designed to assemble Vega passenger cars that GM hoped would prevent foreign manufacturers from eroding GM’s margins in the compact-car arena. By 1966, GM was hiring workers for the factory, eventually employing about 7,000 people. This new plant, with advanced robotics, represented a $100-million investment by the company.
GM recruited younger, better-educated workers who, it was claimed, were products of the ethos of the 1960s. Many of the employees even had long hair, so this was indeed a “new generation.” Then, GM adopted a variety of efficiency rules designed to increase the production of the new Vega plant from 60 cars every hour (or 1 every minute) to 100 cars in the same time (or one every 39 seconds). The company did not increase the workforce or decrease the number of procedures each worker was responsible for. It just required its workers to increase their pace. The workers fell behind, not being able to keep up with the line’s speed.
If the pace was maddening, the results were disastrous. Workers tried various self-help remedies, such as letting cars go by without the required procedure or part and “doubling up” (surreptitiously doing an additional procedure for a short period of time—usually very poorly—so that a friend could rest). Absenteeism increased, and harsher work rules were imposed that violated many traditional but unspoken shop-floor conventions.
The workers went on strike. The primary reason for the strike was the workers’ view that the company was engaged in a speed-up, which is hardly a novel issue in the history of labor-management conflict. It was not a sense that the work itself had become dehumanizing, but that the company’s demand for faster work was impossible to reasonably satisfy. As one writer put it, “The main principle of Lordstown technology is the speed-up as developed by Henry Ford.”5
The Generation Gap Mythology Re-Emerges
The interpretation of workforce problems as due to new generations of workers has re-emerged in a more sophisticated form over the past two decades and blossomed into a virtual industry. Many consultants now advise managers on how to deal with new generations to obtain the most productivity from them and to assure harmonious intergenerational work relationships. Four generations are usually identified: Workers born before 1945, often termed Traditionalists; Baby Boomers, born 1946–1964; Generation Xers, born 1965–1980; and the newest members of the workforce, the Millennials, born 1981–1995.
The generations are presumed to have different characteristics. While the descriptions vary among authors, here is a pretty common set:6
• Traditionalists. Hardworking; loyal (to their country and employer); submissive (respect authority, don’t ruffle feathers); resistant to change; tech challenged.
• Baby boomers. Work-centric (extremely hardworking, define themselves by their professional accomplishments); independent (confident, self-reliant); achievement-oriented; competitive (want to win).
• Generation X. Individualistic (independent, resourceful, value freedom and responsibility, casual disdain for authority and structured work hours); technologically adept; flexible (adapt well to change, more willing to change employers, tolerant of alternative lifestyles); value work/life balance (“work to live rather than live to work”).
• Millennials. Tech-savvy; family-centric (willing to trade high pay for fewer hours, flexible schedules, and a better work/life balance); achievement-oriented (ambitious, confident, high expectations of their employers, seek out new challenges); question authority; team-oriented (value teamwork, want to be involved, seek the input and affirmation of others, crave attention).
These descriptions and their variants have been widely accepted as accurate, as was the depiction in the 1970s of young workers as “alienated.” But, as was also the case in the ‘70s, there is not a shred of systematically collected evidence that any of these depictions of generations are true. They are based entirely on anecdotes and have their source, in part, in a fundamental error: the confusion of the effects of age and, especially, tenure with “generation.” After all, so-called Traditionalists were not only born and reared in an assumedly different era culturally—they also have had longer tenure in their companies and are older. Their resistance to change—if it even exists—may have nothing to do with their generation and everything to do with their tenure or age and their reluctance to trade what has worked for them for years for something untried. In other words, the Millennials, when they age and work longer for their companies, might be no different than the Traditionalists are today.
To our knowledge, there have been just two genuinely systematic studies specifically testing the theory of generational differences, one by the Conference Board of Canada,7 and the other by Jennifer Deal of the Center for Creative Leadership.8 Both studies were based on surveys, in the Conference Board case, of 900 Canadian employees, limited to three generations: Baby Boomers: born 1945–1965; X: born 1965–1979; and, Y: born 1980–2000. Deal, on the other hand, surveyed 3,200 U.S. workers and divides her population into five generations: Silents (born 1925–1945); Early Boomers (born 1946–1954); Late Boomers (born 1955–1963); Early Xers (born 1962–1976); and, Late Xers (born 1977–1986).9
Here, in brief, are the conclusions from these studies:
• The authors of the Conference Board report conclude that, “There are some sharp differences in how the generations see one another, many of which mirror popular (and often negative) generational stereotypes. Yet, workers from across all three generations want many of the same things from their work, their colleagues, and their employers. In short, many of the supposed differences between the Boomer, Gen X, and Gen Y workers are based on perception, not reality.”10 Companies therefore need to “...provide what all workers want: respect, flexibility, and fairness.”11 Only two differences in preferences of any significance were found: Boomers somewhat more than the other two generations prefer face-to-face communications rather than technological means, such as emails (are any readers surprised?) and they are less interested in after-hours socializing with co-workers (considering the Boomers’ ages, there’s no surprise in that).
The Conference Board study explodes a number of specific myths about generational differences. Among them is the belief that “Gen Xers do not like to work in teams, whereas Boomers and Gen Yers are more collaborative and team-oriented.” Their data: “In fact, 62 percent of Gen Xers said that they prefer to work alone, compared with 59 percent of Boomers and 64 percent of Gen Yers. As well, 57 percent of Gen Xers said that they like to work in teams, compared with 55 percent of Boomers and 61 percent of Gen Yers.”12 Another prevalent belief: “Boomers value work over life, Gen Xers value life over work, and Gen Yers only value life outside of work.” But the data show that “all three generations seek work-life balance. They all work for the enjoyment of working and to have the means to enjoy a personal life.” The report’s authors caution that “...employers need to be wary of programs and practices that warn of vast gulfs between the generations, and promise to elevate organizational performance through what might be termed ‘management by stereotype.’ It does not work that way. The keys to success in managing a multigenerational workforce are not to be found in designing workplace policies to fit particular generations of workers; they come from developing a human resource management system that makes all workers feel equally valued and is based on respect, shared values, flexibility, and fairness.”13
• Jennifer Deal presents similar data and comes to strikingly similar conclusions: “...the generation gap at work is one more of appearance than substance.... People want about the same things at work, no matter what generation they are from.”14 Deal’s advice to management: “Remember, you don’t have to tie yourself into knots (or worse!) trying to accommodate each generation’s individual whims, and you don’t have to worry about learning a new set of whims when the next generation comes along. People from different generations are largely alike in what they think, believe, and want from their work life. Once people accept this fact, and make their actions consistent with the principles that apply to working with people of all generations, the (generation) gap will be retired.”15
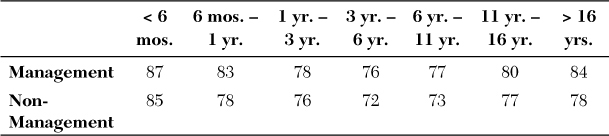
Still, in the work setting, employees and managers resist these conclusions about the lack of differences between generations because the conclusions belie what they claim they actually see and experience every day. They see Boomers acting more conservatively, and more loyal to, and satisfied with, the company. They see Traditionalists being more positive than nearly everyone at work regarding the company as a whole. As The Conference Board emphasized, there are differences in the way the generations see each other. It is also true, however, that Boomers are older and more likely to have been at the company significantly longer than, say, Gen Xers and thus may be more invested than them in it. And, Traditionalists, the oldest cohort, are more likely to be in management, a population we know to be generally more positive. So, both tenure in the company and level confound what people are seeing with their own eyes—you can’t “see” tenure, but you can “see” age, which they equate with “generation.” A related data analysis that we performed shows the impact of the demographics on overall satisfaction. We found that when we statistically take out the effect of both tenure and level, the differences by age (that is, “generation”) disappear—with the exception of a very small positive effect for Traditionalists. Our analysis thus teaches us that with regard to overall satisfaction, it is tenure—not age/generation—that has the real impact. People tend to join companies enthusiastically, hopeful that they have found an organization where their work-related goals, interests, and aspirations will be met. In most companies, however, initial expectations are not met and attitudes then decline, reaching their lowest points during their third to sixth years of employment, and begin to recover later on, as shown in Table 1-1. These effects have held up year after year since we started collecting data in 1972, and they hold up for both management and non-management. Here is the analysis between tenure and satisfaction, performed on our recent survey results.
Further analysis shows that this effect of tenure occurs at all ages! Age itself, other than a slight positive bump for Traditionalists (those over 68 years of age), has no effect. When, say, a middle-age person joins a company, he shows over time the same tenure versus satisfaction results as do younger people. (For these analyses, see our website at www.sirota.com/enthusiastic-employee.)
The recovery in attitudes later in one’s work career is likely a function of employee attrition (many unhappy employees have left), dissonance (“If I am still here, I must be satisfied!”), and habituation (“After all this time, the place has grown on me.”) Other than being on guard against the generational differences stereotypes, the only practical conclusion for managers about the research on the topic is this: if you are searching for a way to add a few points to your workforce satisfaction scores, you might consider hiring only those 68 years of age or older (the Traditionalists)—and employing them for no more than one year!
Myths About the Work Itself
There has long been a widespread belief—quite deeply engrained in our culture—that most people, of whatever generation, simply don’t like to work. This is an ancient point of view (after all, work was one of Adam’s punishments for eating fruit in Eden: “In the sweat of thy brows shalt thou eat thy bread”), and for millennia a lot of work was, indeed, extremely hard and often performed under dangerous, even brutal, conditions. But much has changed, especially in today’s developed economies. Backbreaking, endless labor has to a large extent disappeared, replaced by the tools of the industrial and information revolutions and constrained by societal norms and labor laws. And yet, the view persists that work is inherently distasteful to almost everybody.
In our employee surveys, we regularly ask people specifically how they feel about the work itself, as opposed to other aspects of their employment, such as their pay or their relationship with their supervisors. Our job satisfaction “norm” is 78 percent. This means that, on average, 78 percent of all workers across all the organizations surveyed generally enjoy the work they do. Although a 78 percent average satisfaction rate does not approach unanimity, it appears to belie the notion that work for most employees is somehow intrinsically unsatisfying.
Further, contrary to unsupported theories about worker attitudes, such as the generational-difference and job-enrichment fads, we find that the overall satisfaction of workers with the type of work they do is strong and constant over a wide variety of ages, industries, and occupations. For example, on the high end, the job-satisfaction figure for those working in the insurance industry is 83 percent. At the low end is the job satisfaction of retail workers, which is at 75 percent. That’s not much of a difference. Management across all industries is somewhat more positive than non-management (84 percent versus 77 percent on the average), and the higher the management level, the more positive. Historically, non-management professionals (such as engineers, accountants, and salespeople) have a slightly higher satisfaction rate than other salaried employees (such as clerical workers) who, in turn, are higher than hourly (mostly blue-collar) employees. But, over the past eight years, hourly attitudes have improved and are now on a par with other salaried, nonprofessional employees. Therefore, the percentage of people satisfied with their work is high for every group; most of the remaining employees are neutral, and a small percentage express dissatisfaction. The differences among the various groups are small and, by and large, in line with what one might expect.
Also, there is no evidence that younger workers are more (or less) disenchanted than their elders. Racial and gender differences are also small or nonexistent, as are those by regions of the world. Appendix C, “Job Satisfaction: Demographic, Occupational, and Regional Breaks,” details the job-satisfaction data for the various demographic, occupational, and regional groups and can be found on our website at www.sirota.com/enthusiastic-employee.
Our results on job satisfaction may seem counterintuitive to those unfamiliar with employee attitude survey findings. However, as noted in the Introduction (and summarized in Appendix D, “Comparisons with Other Norms,” on the aforementioned website), our data are similar to those collected by other researchers. Furthermore, going back to 1972 when Sirota began its surveys, we find hardly any change at all. The average level of job satisfaction on our surveys in 1972–1982 was 73 percent and in 2002–2012 it was 77 percent.
If, contrary to popular social myth, people generally like the work they do, why is it that some workers nonetheless appear more highly motivated than others, that workforces in some companies routinely perform better than others, and that workers are often unmotivated to do their jobs well, despite apparently liking what they do? In other words, if people generally like the work they do, why are they often unhappy with their work situations? Are they being irrational? What accounts for this apparent disparity? We find out by going directly to the workers.
Let’s Ask
What can you learn by asking workers about their goals and views in a simple and direct way? First, that identifying what most motivates employees is a waste of time. The vast majority of employees want a lot of things “most.” Indeed, it is a psychological illness to want just one thing, such as money to the exclusion of everything else, or affection to the point that one is willing to sacrifice anything for it, including fair compensation for one’s labor.
The Sirota Three-Factor Theory
Based on our survey research, we assert that there are three primary sets of goals of people at work: equity, achievement, and camaraderie. We call this our Three-Factor Theory of Human Motivation in the Workplace, and we maintain that:
1. The three sets of goals characterize what the overwhelming majority of workers want—whatever the generation.
2. For the overwhelming majority of workers, no other goals are nearly as important as these.
3. To our knowledge, these goals have not changed over time, and they cut across cultures, at least the cultures of the economically developed sectors of societies (the only sectors we have studied).
4. Understanding the three sets of goals, and establishing organizational policies and practices that are in tune with them, is the key to high workforce morale and firm performance. There is no conflict between the goals of most workers and the needs of their organizations.
Note
Keep in mind that our focus is on the goals of people at work. There is more to life than work, and our theory is not meant to cover all human motivation.
We have been highly critical of theories of human motivation that are unsubstantiated by systematic evidence—in fact, are contradicted by the evidence that does exist. What is the evidence for our assertions about human motivation? We have been in the business of observing and querying employees for more than four decades. After all this time and the literally tens of thousands of employees with whom we have had direct contact and the millions we have surveyed by questionnaire, we see certain themes repeating themselves time and again. They repeat themselves no matter what the occupation—from assembly-line workers to research scientists—no matter what the region of the world (North America, Europe, Latin America, or Asia), and no matter their sex, race, or age. The specifics vary, of course, but everywhere we have worked, people want to be proud of the work they do. They want to be paid a fair wage for their efforts and have job stability. Their co-workers—their cooperation and congeniality—are important to them. There is no escaping these fundamental needs of people at work and the enthusiasm they experience and express when the needs are satisfied—and the frustration when they are not.
More specifically, our evidence includes:
• Statistical analyses of the answers to the multiple-choice questions in our questionnaires that invariably show that the questions correlating most highly with employee morale and performance are those measuring the three factors (equity, achievement, and camaraderie).
• When we ask employees directly what they want from their jobs and their companies, they mention several goals, and the bulk of their answers fall into the three factors.
• When we ask employees, in focus groups and in the “write-in” questions at the end of the questionnaire, what they like and dislike most about working for their company, a careful, quantitative analysis reveals that their likes and dislikes almost always reflect the three factors.
• In our research on employee turnover, we learn that the major reasons people stay with or leave an organization—other than personal reasons, such as a spouse getting a job in a different geographical area—almost always reflect the three factors.
In short, the evidence is overwhelming, and we review a portion of it later in this chapter. But first, here are our descriptions of the three factors and the degree of satisfaction of employees with them as uncovered by our surveys.
Equity
To be treated justly in relation to the basic conditions of employment.
Certain basic conditions are expected simply by virtue of the employment relationship. They are unrelated to position in the company or to performance. They are defined by generally accepted ethical and community standards and, while the basic goals do not change over time, a number of the standards that define what is acceptable do change. The basic conditions are as follows:
• Physiological, such as having a safe working environment, a workload that does not damage workers’ physical or emotional health, and reasonably comfortable physical working conditions.
• Economic, such as having a reasonable degree of job security, satisfactory compensation, and satisfactory benefits.
• Psychological, such as being treated respectfully, having reasonable accommodation made for personal and family needs, having credible and consistent management, and being able to get a fair hearing for complaints.
Are those things surprising? Of course not. What is surprising is how little we hear of them in many modern theories of management. But, enlisting the willing cooperation of a workforce in achieving the aims of an enterprise is impossible unless people have a sense of elemental fairness in the way they are treated.
We use the term “reasonable” frequently in our definitions because employees do not expect a level of perfection unrelated to the realities of the business. For example, the desire for job security does not mean that employees expect a lifetime-employment guarantee. They are not naïve; they understand that such a guarantee is virtually impossible in a modern, capitalist economy. But they are angry when they (or their co-workers) are laid off without the company having a pressing need to let them go (when, for example, it is already highly profitable or when it has not exhausted other more obvious ways to reduce costs). Their anger is magnified by insensitive handling of layoffs, such as when layoffs are done without adequate notice or financial and job-placement assistance.
In other words, employees become angry when, in their view, elementary considerations of fairness are completely submerged by the company’s single-minded pursuit of its short-term business interests, such as the anticipated immediate impact of an announced layoff on a company’s stock price.
Similarly, consider compensation. Most people know that becoming extremely wealthy is more fantasy than reality. So, the common assumption that “employees will never be happy with their pay” is fallacious. Our norm on our satisfaction-with-pay survey question is 51 percent favorable and 25 percent unfavorable. (The rest are neutral about their pay.) Although pay satisfaction is among the lower-rated aspects of work, it is hardly very negative. Furthermore, those are the averages across many organizations, and the range of responses is large: the most positive company response is 78 percent favorable, and the least positive is 25 percent.
Contrary to “common sense,” people can view their pay as fair. Our research shows that perceived fair compensation is a function of a number of variables, including perceptions of what other organizations pay for similar work, the relationship of pay to employee contribution, and the company’s profitability. Chapter 4, “Compensation,” elaborates on these variables. The underlying attitude that these results reflect is simply whether the organization tries to be fair with its salary policies or whether it tries to squeeze every last nickel from its employees. And “fair” does not mean wildly generous. Everything else being equal, and under most circumstances, we find employees pleased with “competitive” pay and very pleased with compensation that is even a few percentage points above other companies’ pay.
Similar observations can be made about other elements of the equity factor, such as benefits. But there are elements where the ultimate is expected, such as the following:
• Safety. Where loss of life or limb is at stake, perfection has become the goal, and understandably so.
• Respect. People want to be treated like responsible adults, but many workers—primarily in factories but also in certain factory-like white-collar settings—are, as they see it, treated like children or criminals, subjected to strict monitoring of their work and other behavior to coerce performance and conformity to the “rules.” The response to this kind of treatment is that anger builds up in workers over time, and this has always been a major element in the more severe industrial relations conflicts we have studied. Even when the reaction is not explosive, this mode of management is self-defeating for the company. It is based on false assumptions about the great majority of workers (for example, that they are irresponsible) and becomes a self-fulfilling prophecy: management that expects the worst from people typically gets it.
• Management credibility. A basic need of human beings from childhood through adulthood is to be able to trust the word of those whose actions have a significant impact on them. A major source of discontent among many workers is information about important matters that is incomplete, unclear, contradictory, or simply absent. When workers assume that the company is deliberately withholding information, the void is filled with paranoid thoughts about what is really going on. This is a sure way to poison the relationship between management and its workforce.
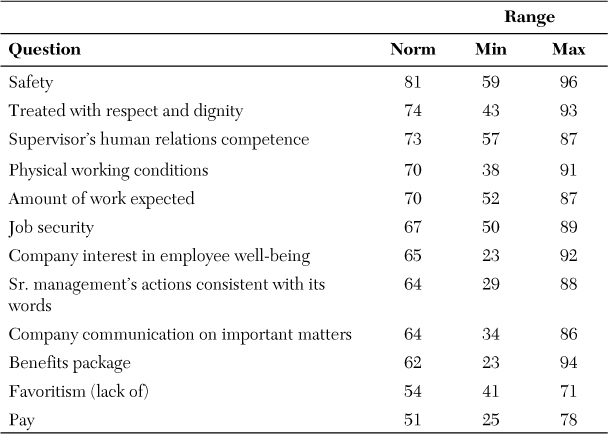
How do workers feel about the degree to which their needs for equity are being met? Our research indicates that the highest degree of average satisfaction concerns how people feel about safety at work, while the lowest is about pay. The range is 81 percent favorable for safety to 51 percent favorable for pay, demonstrating that employees make sharp differentiations among the various aspects of their work.
See Table 1-2 for a sample of the normative data relating to equity. We show in that table the average percentage satisfied across all our surveys (the “norm”) for each question and its range: the lowest score we have ever obtained on the question (the “minimum”) and the highest (the “maximum”).
The overall ranking of items is similar within most of the individual organizations that we survey. When we discover an exception to the pattern, it is cause for particular attention. Take safety, for example. In general, safety is highly rated in our surveys, but there are a few organizations, especially in heavy manufacturing, where it is among the lower-rated items. But, there are exceptions to that, too. As an example, see the discussion in Chapter 7, “Organization Purpose and Principles,” about Paul O’Neill (the former Secretary of the Treasury) and his work on safety when he was chairman of Alcoa. These “exceptions to the exceptions” are particularly noteworthy and illuminating because we learn from them that in management practice, little is foreordained. Much can be done if there is a will to do it.
Although this pattern tends to hold up across organizations (with exceptions, as noted), the levels of satisfaction—within the same broad pattern—vary widely. Thus, for example, employees in companies A and B can rate safety among the highest and pay among the lowest of all the equity items, but company A employees can be much higher than those in company B on both of these (and on just about every other equity item).
The large variations between organizations can be seen in the ranges in Table 1-2, and they are extremely important. First, they lend the lie to the commonly held assumption that people, no matter where they work, are similar to each other in their disgruntlement with their employment conditions. What management does is critical, and the differences between organizations in management behavior—and, therefore, employee response—can be huge. Second, the variability allows us to answer the key “So what?” question about employee attitudes: does satisfaction matter for business success? In Chapter 2, “Employee Enthusiasm and Business Success,” we show how business performance varies markedly between organizations with different degrees of employee satisfaction.16 The variation in the degree of satisfaction, we must stress, is not usually between highly satisfied, or “enthusiastic,” and highly dissatisfied, or “angry,” employees. Much of the variation resides in the difference between highly and moderately satisfied employees. That is a basic point of this book: the big difference in motivation and outcomes when employees say “This is a terrific place to work” vs. feeling that “It’s pretty good” or “OK.”
Achievement
To take pride in one’s accomplishments by doing things that matter and doing them well; to receive recognition for one’s accomplishments; to take pride in the organization’s accomplishments.
A sense of basic equity in the employment relationship serves as the foundation on which high employee morale can be built; the powerful need to feel proud of one’s accomplishments and the accomplishments of the organization is then freed to drive behavior toward high performance. Pride comes both from the employees’ own perceptions of accomplishment and from the recognition received from others.
That is why the often-asked question, “How do you motivate employees?” is foolish. Most people enter a new organization and job with enthusiasm, eager to work, to contribute, to feel proud of their work and their organizations. Perversely, many managers appear to then do their best to demotivate employees!
You may reject that argument if you believe that people (other than a few saints, overachievers, or neurotic workaholics) are basically greedy and lazy when it comes to work. The reverse is true: most people are reasonable in what they expect in terms of treatment and are eager to perform in a way that makes them feel good about their performance. When we observe the opposite in an employee, it is either an atypical case (see the following discussion on individual differences) or, most commonly, because management has damaged that employee’s motivation.
Our statistical analysis shows that a sense of achievement has six primary sources:
• Challenge of the work itself. The extent to which the job uses an employee’s intelligence, abilities, and skills.
• Ability to perform. Having the training, direction, resources, authority, information, and cooperation needed to perform well.
• Perceived importance of the employee’s job. To the organization, to the customer, and to society.
• Recognition received for performance. Both nonfinancial (such as a simple “thank you” from the boss or a customer) and financial (compensation and advancement that are based on performance).
• Working for a company of which the employee can be proud. Because of its purpose, its products (their quality and their impact on customers and society), its business success, its business ethics (treatment of customers, employees, investors, and community), and the quality of its leadership.
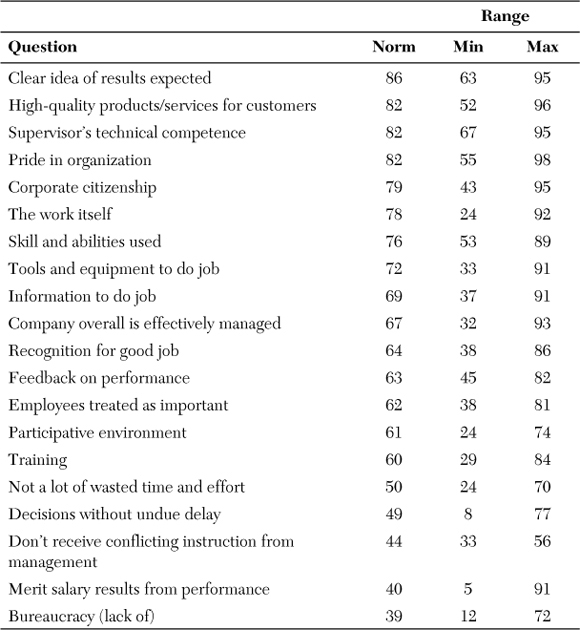
As with the equity items, the surveys reveal a mixed picture regarding achievement. A sample of the normative data relating to achievement is shown in Table 1-3. We ask many questions about this factor, and these are discussed in the relevant chapters. But for now, note that among the most positive ratings are those focused on two opposite organization poles: the macro and the micro. Employees, on the average, are most favorable toward the overall characteristics of the organization (such as the quality of the organization’s products and services, its profitability, and its ethics) and, at the other pole, toward the immediate work environment (such as the job, the co-workers, and the technical ability of the immediate supervisor). The least positive ratings tend to be about efficiency at a “middle” level (such as bureaucracy, consistency of direction from management, and, as will be seen later, cooperation across units) and about reward. There are some apparent contradictions, such as the view of many employees that the amount of work expected of them hurts quality and yet the very positive feeling about the quality of the products and services the organization delivers to its customers. All these matters are discussed in detail in this book. Where we have comparisons with surveys conducted by others, the results are similar to ours. (See Appendix D, “Comparisons with Other Norms,” at www.sirota.com/enthusiastic-employee.”)
Camaraderie
To have warm, interesting, and cooperative relations with others in the workplace.
Human beings are decidedly social animals. Positive interaction with others is not only gratifying, but essential for mental health. We often neglect the extent to which an organization—and parts of organizations—function not only as business entities but also as communities that satisfy the social and emotional needs of their members.
“What do you like most about working here?” is a typical write-in question we ask on our surveys. One of the most frequent and consistent responses to that question involves co-workers. That is because co-workers are important and because, by and large, people get along well with each other within their work units. We receive considerably fewer positive comments about relationships with other units in the organization; those comments are often in response to what employees like least. For example, note the following:
• From an employee in a real estate company (what employee likes “most”): “My team is full of intelligent people who are friendly and constantly want to do better and help each other. We work beautifully together.”
• From an employee in a factory (likes “most”): “The people I work with.” Simply this phrase, or variations of it (such as “the great people I work with”), appears repeatedly in almost every survey in response to the question about what respondents like most.
• From an employee in a hospital (likes “least”): “Cooperation and communication between physicians and nurses needs to be much better. Nurses truly know the patients. We are at the bedside dealing with families and the patient. Many times, we are ignored. It’s like we’re the physicians’ servants and we should jump when they say so.”
• From an employee in an information-technology group in a bank (likes “least”): “What gets me most upset is the way the departments we have to service are absolutely clueless about how busy we are and short-handed we are. We can’t do everything just when they want it. They don’t care, and when they complain to our V.P., he doesn’t support us.”
The quality of interaction in organizations is obviously greatly affected not just by friendliness and mutuality of interests but also by co-workers’ competence and cooperation. In that environment, a friendly slacker is an oxymoron: being unhelpful to co-workers is, by definition, unfriendly. This is another example of the way employees’ needs—in this case, for positive interpersonal relationships in the work setting—are congruent with the organization’s needs for high performance. And, as we shall discuss in Chapter 8, “Job Enablement,” innovativeness is often the result of positive interaction among colleagues.
The camaraderie concept issomewhat less complex than equity and achievement, and we came to an explicit realization of its importance somewhat later in our work. Therefore, in our surveys, fewer questions have been asked about camaraderie, and these are shown in Table 1-4. The most favorably rated aspect of camaraderie is simply the relationship between co-workers, followed by teamwork within the workers’ unit, teamwork across departments in a given location, and finally, teamwork and cooperation across the entire company.

Teamwork, as we mentioned, is not just a camaraderie issue. It also has a major effect on achievement. And, it is clear that teamwork is more positive at the micro level—within units—than at what we have termed the middle level—across units. The differences between companies, however, are large, which shows that familiarity and proximity do not always breed contentment or distance antagonism. For example, although the norm for teamwork within the unit is 80 percent, the range is from 39 to 92 percent! Also, the norm for teamwork across units is 66 percent, but the range extends from 26 to 88 percent.
Chapter 11, “Teamwork,” discusses camaraderie, its impact on performance, and ways of enhancing it. That chapter also discusses how camaraderie can sometimes work against organization goals. For example, solidarity in a workgroup might develop in opposition to a management whose practices are considered unjust by employees. Management becomes the “enemy camp” and, in those situations, equity issues must be dealt with first.
That summarizes the key sets of goals of the overwhelming majority of employees. Other than extreme cases in which our theory does not apply (which will soon be discussed), we assert that a manager does not need to know much more about human motivation at work. That is quite an assertion, but we invite readers to suggest other motivators that are as powerful, relevant in the workplace, and widespread. We claim further that a genuinely high-morale, enthusiastic, and highly productive workforce is impossible if those needs go unsatisfied.
The three goals we propose are distinct needs that, unfortunately, cannot be substituted for each other. For example, enriching the content of a job does not increase satisfaction with pay or cause an employee to minimize the importance of his pay dissatisfaction. Discontent with pay can be ameliorated only by more pay! Similarly, unhappiness with a boring job can be solved only by restructuring the job or transferring the employee to work that is more interesting; paying the employee more won’t solve the problem. Each goal—and most every subgoal—must be dealt with individually. There are no panaceas, no silver bullets that solve all issues.
The Specific Evidence for the Three-Factor Theory
We make rather strong claims—some might say startling and unbelievable—about the pervasiveness of the three sets of goals. We claim that the goals are nearly universal, applying to roughly 85 to 90 percent of a workforce. (That’s just about any workforce.)
Our assertions might appear to go against common observation and common sense. After all, managers and employee-relations experts talk endlessly about differences: the differences between individual workers and between categories of workers (such as males and females, older and younger workers, professionals and nonprofessionals) and between workers in different countries. Are we saying that this is hogwash? Yes, in large measure.
Consider the following questions in relation to the three factors: do you believe that an entire category of workers—demographic (age, sex, race, and so on), occupational, or national—does not consider being treated fairly by their employer—say, in wages—to be of very high priority? Do you believe that a category of workers exists in which the overwhelming majority does not want to take pride in their work and in their organization? Do you believe that there is a category of workers for whom having congenial and cooperative co-workers is unimportant? Of course, there are individuals to whom these rules do not apply—even individuals who willingly allow themselves to be exploited economically by their employers—but never more than a very small minority in any category.
Are there no major demographic, occupational, or national differences in these needs? Not in the fundamentals we have described (the desire for equitable treatment, achievement, and camaraderie). The differences emerge largely in what will satisfy these needs, which vary because of differing objective conditions and expectations. Let’s consider a few examples of this:
• The work itself. In Chapter 9, “Job Challenge,” we discuss the satisfaction people seek from the kind of work they do, and we say that workers want to be proud of their work. Pride in work has numerous sources, among them the employees’ feelings that their intelligence and skills are being used; that, in turn, is partly a function of the latitude they have to exercise judgment in doing their jobs. We know that the latitude given to, say, the average engineer is normally going to be much greater objectively than that given to a blue-collar machine operator. Despite this difference, the machine operator may experience the same degree of satisfaction—which is subjective—with his job autonomy. The machine operator doesn’t expect—indeed, would consider it inappropriate—to have the engineer’s latitude. But he doesn’t want to be treated as an automaton; that is, he wants to exercise the judgment that makes sense for that job and for his skills, and that latitude can be considerable (as the reader will see in Chapter 9). People at work are not stupid and do not have outrageous expectations. Machine operators—no less than engineers—have a need to be treated on the job as intelligent human beings, but the standards by which this is judged are obviously somewhat different.
• Job security. Chapter 3 discusses job security. How an organization treats employees in this respect is a key source of employee morale, but what is considered fair has shifted greatly in the United States over the past few decades. Although employees in quite a few large corporations previously expected lifetime job security, today’s workers rarely expect that. They understand that the business world has changed, but this does not mean that their desire for security has diminished. The change has been in the criteria that employees use to judge the fairness with which the issue is handled by organizations. Organizations differ greatly in this regard—for example, in whether layoffs are treated as a last resort instead of the first action taken—and these differences have a profound impact on the morale and performance of a workforce.
• Vacations. A concrete and visible example of a cultural difference is that between the vacations enjoyed by workers in the countries of Western Europe and those received in the United States. On average, Western European countries have much longer vacations, with even new employees receiving at least a full month. (Vacation time is five weeks in France, Sweden, Austria, Denmark, and Spain.) This certainly is a major difference, with profound cultural meaning and probably significant economic effect, but what are its implications for our argument regarding the commonality of the major needs? Are European workers lazy? Are they less interested in doing a good job? Do they find their jobs less interesting? There is absolutely no evidence for any such assertion. By virtue of broad historical and social trends, different countries evolved different patterns of employee relations, including different vacation time expectations. These differences result in different subjective standards of what is “fair,” but in no way undercut our proposition regarding the fundamental goals of workers.
Similar comments could be made about the satisfaction of many other goals and subgoals: employee expectations in the United States regarding the benefits an organization provides, such as medical insurance, have changed greatly, and what might have been considered unfair a decade or so ago, such as a large corporation not paying full medical-insurance premiums, can be entirely satisfactory today. Operating in the opposite direction is equipment, where the tools people use on their jobs improve continually, so what was satisfactory before is rarely satisfactory today.
Our argument, then, is not that there are no demographic, occupational, or cultural differences or that the differences are unimportant. It comes down to this: when we say that workers want to feel pride in their work, we mean almost all workers, whoever they are, whatever they do, and whenever or wherever they do it. The fundamentals are constant, but knowing how to satisfy those fundamental needs often requires knowledge of the expectations of particular groups of workers. As an extreme example, suppose an American multinational corporation decided to halve the vacation time of its European workers based solely on the assumption that their fundamental needs to do a good job and to be treated fairly are the same as American workers. That organization is in for big trouble.
But don’t make the opposite error—namely, to assume that the obvious cultural, occupational, and demographic differences in expectations and standards signify major differences in basic goals. For example, treat a blue-collar worker as if all that interests him is his wages—that exercise of his judgment on the job doesn’t matter—and you wind up with an indifferent or hostile employee. At the other extreme, treat engineers and scientists as if wages don’t matter—that all they want is an opportunity to be creative—and you wind up with hostile engineers and scientists (if they stay with the organization at all).
Table 1-5 summarizes a representative portion of the strong quantitative evidence on which we base these claims about the pervasiveness of employee goals. As we will explain, the table shows that employee morale relates strongly to the degree to which each of the three needs is satisfied, and the relationships are extraordinarily similar across all demographic, occupational, and national groups. There are no differences in the strengths of the goals to speak of; they are, indeed, nearly universal.
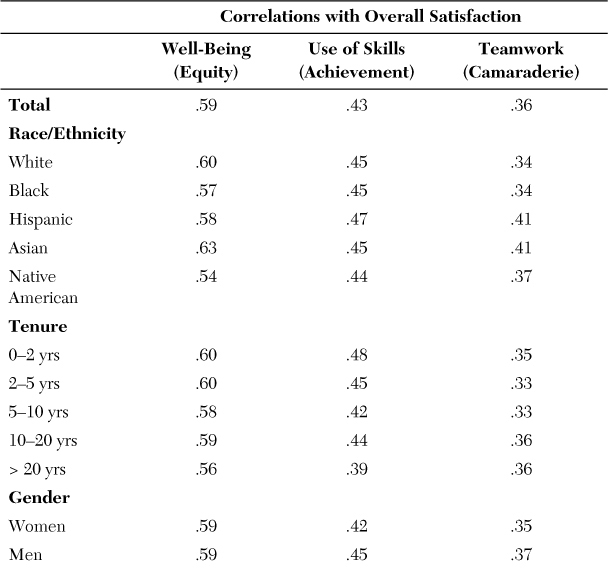
How do we know, in a systematic, quantitative way, whether a goal is important and how universal it is? One way is to correlate employees’satisfaction with it with their overall satisfaction with the organization. Table 1-5 shows these results. Overall satisfaction is a product of the degree to which employees feel their specific goals are being met, so the higher the correlation between satisfaction with a specific goal and overall satisfaction, the more important we can assume the goal to be. If an employee doesn’t care much about something—say, the color of the walls where she works—liking or not liking it would have no impact on how she feels about the organization as a whole. Compare that to the importance of how she feels about her pay or her boss. This reasoning is identical to how the performance approval rating of the president of the United States—determined from political-opinion polls—is a function of how Americans feel about specific aspects of the president’s performance, such as his handling of the economy, of national security, and his perceived interest in the well-being of the average American. The stronger the correlation between a specific aspect and the overall approval rating of the president’s performance, the more important that aspect is.
The relationship between variables (such as between overall satisfaction and satisfaction with pay or the color of the walls) can be assessed in various ways. In our analysis, it is measured by a statistic called the correlation coefficient, whose symbol is“r.” The higher r is, the stronger is the relationship. r can range from .00, which means no relationship, to 1.00, which means a perfect relationship. (r can also be negative, in which case, the relationship is inverse: the higher on one variable, the lower on the other.)
Our basic finding is that there are highly significant positive correlations between the questions on our surveys that tap the three needs and overall satisfaction. These correlations hold up in all demographic, occupational, and national groups and at approximately the same level. Illustrations of these correlations are shown in Table 1-5, where the following questions are used to tap the three needs:
• For equity. “How would you rate your organization on taking a genuine interest in the well-being of its employees?”
• For achievement. “Do you agree or disagree: my job makes good use of my skills and abilities.”
• For camaraderie. “How would you rate the cooperation and teamwork within your work unit?”
The question measuring overall morale is “Considering everything, how would you rate your overall satisfaction in [organization] at this time?”
The correlations shown in Table 1-5 were calculated using data from the many thousands of employees we survey in organizations where the four questions were asked in identical ways.
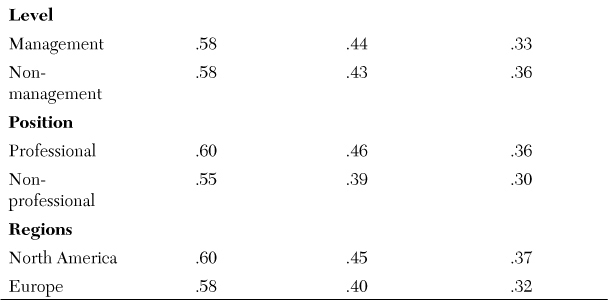
This table contains the correlations for three demographic breaks: race/ethnicity, gender, and tenure, and for occupations and regions of the world. Those familiar with correlational data, will, we trust, be amazed at just how similar the patterns are. In every instance, the item measuring the equity goal correlates in the .50s or .60s with morale, that measuring achievement in or near the .40s, and that measuring teamwork in the .30s and .40s. The possible reasons for the differences in sizes of the correlations—why equity should be the highest and teamwork the lowest—are discussed later in this chapter. Suffice it to say for now that not only are all the correlations highly significant statistically, which verifies the importance of the goals, but, to all intents and purposes, they are the same for all categories of employees.
Which aspects of work do we find not correlated with overall employee morale? They tend to be what might be termed the “frills” of work. Although senior management often spends much time on them, they don’t really touch on workers’ basic goals and what goes on in important ways in their daily workplace activities. We refer to matters such as the aesthetics of the physical work environment, recreational activities (such as holiday parties), various formal “programs” (such as suggestions programs), and formal communication mechanisms (such as the company newsletter). It’s not that employees don’t care about these at all, but that they matter much less than other, more fundamental concerns. It matters much less to them, for example, that there be a well-designed company newsletter or a suggestions program than that their immediate supervisors communicate and listen to them. We are in no way suggesting that the frills be dropped—almost everyone likes a holiday party—but that they be seen as supplements to, not substitutes for, the more basic policies and practices that we discuss throughout this book.
Similar findings are obtained in analyses of answers to the open-ended questions, questions such as what workers “like most” and “like least” about their organizations. The things employees spontaneously write in about almost invariably involve the three factors. These findings are given as examples throughout this book. The frills are almost never mentioned in answer to these questions.
How the Three Factors Work in Combination
Our analyses show the three factors interacting with each other in a somewhat complex way. The Three Factor Theory asserts that employees seek to satisfy three needs—equity, achievement, and camaraderie—in any employment situation. It further asserts that when all three needs are met, it results in enthusiasm directed toward accomplishing organizational goals. As we have said and will more fully explain in Chapter 2, enthusiasm is not just about being happier or more content—it is employees feeling that they work for a great company, one to which they willingly devote time and energy beyond what they are being paid for or what is expected and monitored. A great company for employees is one that largely meets all of their needs for equity, achievement, and camaraderie. Until that happens, it is no more than a “pretty good” company, one with which they are “moderately satisfied.”
Statistical support for this idea can be seen in the way individual satisfaction of the three needs interact to produce overall satisfaction. They don’t just add to one another in their impact, but multiply each other’s impact. Figure 1-1 shows how employees respond to the question, “Considering everything, how would you rate your overall satisfaction in [organization] at this time?” The percentages shown are just those saying “very satisfied,” the highest possible response to the question. The percentages are shown for four categories of employees: those whose satisfaction with all three needs is relatively low (labeled “None”), those who have just one need being satisfied, those who have two, and those for whom all three needs are being satisfied (labeled “All Three”). The questions used to assess satisfaction with the three needs are the same as in the correlational analysis shown in Table 1-5, namely, “How would you rate your organization on being concerned about the well-being of its employees?,” “My job makes good use of my skills and abilities,” and “How would you rate cooperation and teamwork within your immediate work unit?”
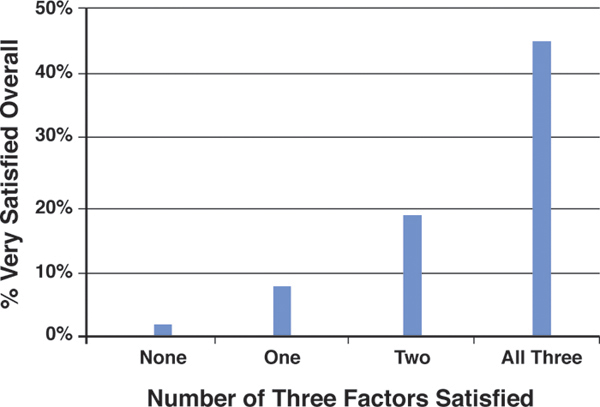
It can be seen that as more satisfied needs are added, the percentage of very satisfied employees increases exponentially. When all three needs are being satisfied, the percentage is 45! What would you think of as a great company in which to work? It’s probably not just having very good pay and benefits, or challenging and enjoyable work, or having terrific co-workers. It involves all of these needs, and when all of these needs are satisfied, something unique happens to many employees and their relationship with the organization... It is what we call enthusiasm. This finding is essential to keep in mind in reviewing our data and arguments. While, for example, 74 percent of employees say they are treated respectfully by the company—so aren’t they therefore enthusiastic?—that, by itself, is insufficient to generate enthusiasm. Say, they are on a boring job and they want challenging work to do. Or, perhaps they are having difficulties with their co-workers, and that is aggravating to them. Enthusiasm requires satisfaction with all key areas of working life.
A second important complexity is the special effect of equity. More in-depth analysis suggests that although all the needs are important, equity has a certain basic importance. That is, if people are dissatisfied with the fairness with which they are treated, satisfaction of either of the other two needs has a relatively minor effect on morale. On the other hand, feeling fairly treated does have a fairly significant impact even when one or both of the other needs are not being satisfied. That is the reason the correlations of overall satisfaction with the equity need are consistently higher than the correlations with the other two factors.17
The moral of the story is that it can be difficult to get employees excited about a company that, say, gives them challenging work to do (part of the achievement need), when they have a basic sense of inequity as to how they are treated. But equity alone is not enough to create enthusiasm: the impact of fair treatment is greatly magnified when all three needs are being satisfied.
These analyses and conclusions hold up in an amazingly consistent way across demographic groups, occupations, and world regions. The finding about the exceptional importance of equity—especially job security—is fundamental to our understanding of the impact of the Great Recession, to be discussed in Chapter 5, “The Impact of the Great Recession: Flight to Preservation.”
Racial/Ethnic and Gender Differences
In the first edition of this book, we said very little about differences between racial and ethnic groups and between women and men. Our readers communicated with us repeatedly about this, and we include this new section here to help remedy that oversight.
We showed (in Table 1-5) that the importance of the three factors varies hardly at all for subgroups: the correlations of the factors with overall satisfaction are virtually the same for the subgroups, including those defined by race and ethnicity and by gender. But, are there differences in the satisfaction levels of these subgroups?
First, here is some “objective” data. We know that a great deal of progress has been made integrating minorities and women into the workforce. For example, women make up 47 percent of the workforce today according to the Bureau of Labor Statistics, compared with 30 percent in 1950. But, using just one criterion of advancement, only 4.2 percent of the CEOs in Fortune 500 companies in 2012 were women. Minorities now constitute a growing 33 percent of the workforce, but less than 1 percent of them hold CEO positions in the Fortune 500 companies. Although many minority entrepreneurs are leading some of the nation’s most successful small businesses,18 it is clear that, with regard to both women and minorities, quite a bit remains to be done.
We turn now to the attitude data: the overall satisfaction scores on our surveys for minorities and women can be found in Table 1-6. Because there are disproportionately large numbers of men and whites in management, we have divided the data so that management and non-management can be seen separately.
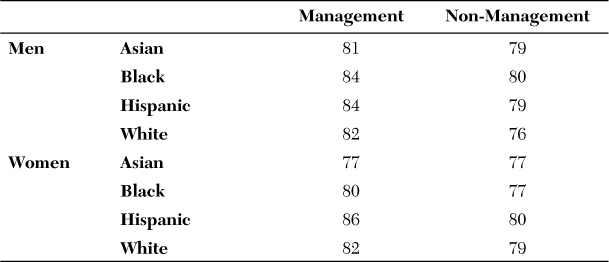
Table 1-6 reveals, first, that the differences between racial/ethnic and gender groups are quite small: all of the percentages are in the 70s and the 80s. Among the differences we do find, albeit not very large, are these:
• First, regarding management and non-management: not surprisingly, for every line of data except one, management is more satisfied than non-management.
• The differences between men and women are inconsistent: men are sometimes more positive, sometimes less so, and the two are sometimes equal.
• Asian managers—both males and females—show almost no difference from their Asian non-management counterparts. The reason, the data show, is that Asian managers’ scores are somewhat depressed, the lowest of the management groups.
• The most favorable groups of all are Hispanic women—both managers (especially) and non-managers.
• The least favorable group of all is white males in non-management.
• Blacks show no particular pattern of differences in their levels of overall satisfaction.
Now, let’s see how the different groups compare on a question dealing directly with diversity. The question is, “To what extent do you agree or disagree: the company has created an environment where people of diverse backgrounds can succeed,” and the responses can be found in Table 1-7.

Table 1-7 The Company Has Created an Environment Where People of Diverse Backgrounds Can Succeed: 2004–2012 (% Favorable)
Here, as can be seen, some larger disparities emerge:
• Contrary to the overall satisfaction data, the differences between management and non-management are not consistent on this question on diversity: for some racial/ethnic and gender groups, managers are more favorable, for some the same, and for some less favorable than their non-management counterparts.
• Also contrary to the overall satisfaction data, women are, in just about every comparison, less favorable than men. By and large, the differences in attitudes between men and women—with women less favorable—are larger in management than in non-management.
• Blacks—whether in management or not and whether male or female—stand out as the least favorable group on this question. Although it would be inaccurate to call them negative, they do see the least progress toward diversity.
• The most positive groups are whites—that is, they report seeing the most progress. White men in management are especially favorable.
• Asians and Hispanics consistently score somewhere between blacks and whites on this question.
Considering both the overall satisfaction and the diversity attitudes, the data are both surprising and unsurprising. It may come as a shock that the overall satisfaction levels of the various groups show such small differences, considering the issues that women and minorities have faced in our society, including the workplace. But those issues are reflected in answer to the question directly about diversity where the results are, perhaps, more predictable: women are less favorable than men, and blacks are less favorable than whites and the other minorities.
How can workers be—as blacks and women are—less positive toward the progress their companies have made on diversity but not, on average, much different than others in their overall satisfaction with their companies? And, how can the reverse be true for white, non-management males who are more favorable regarding the amount the company has done for diversity but the least positive of all the groups on overall satisfaction?
As we have said, overall satisfaction is the resultant of a number of different, specific forces and these can balance each other. We therefore analyzed the attitudes of these groups on a host of other, and more specific, survey questions. (The full analysis can be found on our website at www.sirota.com/enthusiastic-employee.) The highlights of this analysis are as follows:
• In line with the diversity findings, blacks do tend to be less favorable than the others with regard to various equity or fairness issues, such as pay, benefits, and favoritism. But they turn out to be more favorable regarding effectiveness matters, whether on the immediate job (such as having the resources—tools, information, and so on—needed to do the job), or broad company performance (such as the company being effectively managed overall, effectively responding to change in its business environment, and satisfying customers). That is, blacks are more impressed than others with the company’s business management but less with their own treatment on matters of equity—resulting in an about-average level of overall satisfaction.
• Hispanics are, by far, the most favorable racial or ethnic group. Among all the many specific questions we examined, they are consistently less favorable on just one: “My manager is sensitive to my work/life balance issues.”
• A distinctive characteristic of the attitudes of Asian employees is the lack of difference between those in management and those not. Asian management employees are the least favorable of the racial and ethnic management groups on the great majority of specific questions we examined. In contrast, Asian employees holding non-management positions are, on average, among the most favorable of the non-management groups (three exceptions: benefits, fairness of pay, and training, where they are among the least favorable). Because the attitudes of management employees are, in general, more positive than those in non-management, the result is that Asian managers and non-managers are very similar to each other in their attitudes.
• The pattern for whites is also quite distinctive: white managers—whether male or female—are quite similar to the other ethnic and racial management groups, but white non-management males are consistently the least, or among the least, favorable cohort overall. It is not easy to discern the reason for their relative discontent; among the larger differences in a negative direction are those relating to the effectiveness of higher management, such as the overall effectiveness with which the company is managed, having a clear sense of direction, and responding to change in its business environment. That is in direct contrast to blacks, who tended to be more favorable in those respects. Also, in direct contrast to blacks is that white non-management males are among the most favorable on the progress the company has made toward diversity. Based on other research we have done, that attitude may be a two-edged sword, with some portion of these employees feeling that, in effect, too much progress has been made.
• Taken as a whole, women tend to be less favorable than men on a majority of the specific questions. The questions on which they are more favorable are those dealing with benefits, the training they have received, and a number of aspects of company effectiveness. Among our more interesting findings is that women are especially—and quite consistently—less favorable than men on “openness” in their companies, such as the company confronting and solving problems; employees’ ability to express their opinions without fear of retribution; people accepting a variety of ideas and perspectives; top management encouraging employees to report information up the line even if it’s bad news; and management acting on employee ideas and opinions. Perhaps these results about openness reflect women having higher standards than men about what open communications means. Or, they may feel that, as women, they are less a part of the communications network in their companies. Women are also less positive on being valued as an employee and knowing a career path they can follow.
Women in management show an interesting pattern: the differences between them and men in management are greater, and more unfavorable, than the differences between non-management women and non-management men. In addition to the attitudes mentioned earlier (where, on the whole, their differences with men are greater than those of women not in management), they show rather large differences with regard to the reasonableness of their workloads and their ability to maintain a reasonable balance between their personal and work lives; their authority; the degree to which high levels of performance where they work lead to greater advancement opportunity; the consistency with which policies are administered; and, favoritism. To be clear, we are not saying that women in management are less satisfied than women not in management. To the contrary, people in management—including women—are generally more satisfied than those not in management. It is that women, when promoted to management, do not appear to gain as much morale benefit from that advancement as do men. In fact, in certain respects, it might be a disadvantage, as in their ability to achieve a balance between their personal and work lives. On the “balance” question, not only are women less positive than men in management, they are also less positive than their non-management female counterparts. We surmise that moving into positions of greater responsibility, has not, for many women, resulted in an equivalent reduction of responsibilities outside of work.
To summarize, we can say that, in general, the progress of minorities and women in our surveyed companies has undoubtedly been quite substantial—otherwise, the attitudes of these two populations would have been quite negative—but the survey data, as well as what we know from other sources, also indicate that there is still a way to go. Women and minorities (especially blacks), while not necessarily negative, are less sanguine about progress toward diversity than are whites. The review we did of an array of more specific attitudes showed the following: less sense of fair treatment among blacks on many of the equity questions; relatively depressed attitudes of Asian managers; some possible backlash among whites, especially among male non-managers; and a number of concerns of women, such as work/personal life balance (especially among women in management jobs).
Individual Differences
We have repeatedly referred to the goals of “the overwhelming majority of the workforce,” and argued that these characterized broad classes of workers. But, of course, there are individual differences in the strengths of needs. Some people are less socially oriented than others; some are more prone to see injustice in their treatment than are others; for some, work can be less important as a source of pride, perhaps because of fulfilling outside activities. The differences between individuals that are of most practical relevance to managers are the employees at the extremes, people who with regard to the equity need, for example, see injustice at every turn, or, at the other end, never see it. We estimate these extremes to constitute approximately 12 to 15 percent of a population of workers, 5 percent who are almost invariably negative and about 7 to 10 percent who are almost invariably positive. Our theory, and its practical implications for management practice, is much less relevant for these workers at the extremes.
Where do we get these estimated percentages of people at the extremes?
At the most general level, when employees are asked about their overall satisfaction with their organization, even the most positive companies in our database (over 85 percent satisfied) still have 6 to 8 percent of workers rating themselves as dissatisfied. (The rest are neutral.) Some portion of these people are not invariably unhappy but might be unsuited to their particular positions in that organization, to a particular manager, or even, perhaps, to an enthusiastic culture. But, we do know that, by nature, some people are cranky and won’t be positive about their employment anywhere. Our rough estimate, based on largely informal assessments over the years, is that these constitute about 5 percent of virtually every workforce.
At the other end of the continuum, even in very low morale companies, 12 to 15 percent will express satisfaction. Some of this is no doubt due to a fortuitous fit, albeit unusual for those organizations, between themselves and their jobs, their managers, or the culture. (Some of them are likely to be the ones making everyone else unhappy!) But, we know also that there are people who, no matter how bad the environment is, come across as happy souls, the proverbial optimists who try to see the bright side and usually give management the benefit of the doubt. It takes an enormous amount to frustrate or anger these people and our rough estimate is that they constitute about 7 to 10 percent of an average workforce.
That’s the general condition of the exceptionally and persistently dissatisfied or satisfied individuals. Our theory has less relevance for them because their satisfaction (or lack of it) will not be much affected by management’s actions. At a more specific level relating to the three factors, consider the exceptions to what we said about the achievement goal. We asserted that most people want to work and be proud of their work. But we know that there are employees who are, in effect, “allergic” to work—they do just about anything to avoid it. For them, our question, “How do you keep management from demotivating employees?” is nonsense. They are unmotivated, and a disciplinary approach—including dismissal—is about the only way they can be managed.
At the opposite extreme are employees who are just about impossible to demotivate—namely, workaholics. They work through any and all obstacles that the organization puts in their path, perhaps even unconsciously relishing the obstacles because these provide an excuse for spending additional time at work. For them, too, the motivational issue that we are discussing is largely irrelevant:
In a workshop, one of the authors of this book conducted on recognition practices, managers were asked to describe their experience with “unintended effects” of recognition. One spoke of her experience with two employees who were, by far, the most productive people in her department and among the most productive she had come across at any time. She had already given them several large salary increases but wanted to do more. She called them into her office and announced that she was granting them two additional paid days off as a token of her appreciation. They frowned, so she asked them what was wrong. Were two days not enough? Their response was extraordinary: for them, days off from work were a punishment, not a reward. Such was the level of involvement in their work. She replaced the days off with dinner-for-two rewards, and they expressed their appreciation.
Similar extremes can be found on the equity and camaraderie dimensions. For example, some people feel unfairly treated no matter what (“collectors of injustices,” as it were), and others never see injustice no matter what management does. Also, there are social isolates for whom social interaction appears to be unimportant (or even distasteful), and those for whom it is all-consuming.
Obviously, managers must be sensitive to these extremes and adjust their behavior accordingly. But a major problem is the tendency for many organizations and individual managers to mistake the extremes for the whole. This is especially obvious, and dysfunctional, with regard to the achievement goal. Many organizations and managers assume that the desire of an employee to do something that matters and do it well is the exception rather than the rule. So, when an isolated problem occurs, control systems and supervisory styles are applied to everyone, and that has the effect of demotivating the great majority who come to work eager to contribute.
In summary, this chapter presented what is essentially a positive view of the nature of people at work. That view is supported by the mountain of evidence we have gathered over many years of research, by the thinking and systematic research of others, and by the success of organizations whose policies and practices reflect such optimism.
We say that the essentials of human motivation have changed very little over time. If significant change is observed, it is not that workers’ goals have changed, but that management is acting differently and is reaping the consequences of its actions.
For example, treat workers as disposable commodities, which began to happen with the downsizings of the late ‘80s and the ‘90s, and—surprise!—employees are no longer “loyal.” Why would they be? Most people are eager to strongly identify with an organization of which they can be proud and that treats them well. But it would be irrational for people to be loyal to organizations that show no interest in them other than as, essentially, “hands”—temporary hands at that—to get the work done.
Nothing is very complicated about what we have proposed. Although the detailed implications for management practice are reserved for future chapters, those are not complicated either. Let’s call them the “blocking and tackling” of an enlightened management, enlightened in its understanding that what the overwhelming majority of people seek from work doesn’t conflict with management’s objectives and, in fact, usually strongly supports them. Satisfying these goals—fairness of treatment, pride in work and company, and a sense of camaraderie with fellow employees—is to everyone’s advantage. The results will be outstanding. Let’s now look in more detail at the evidence for the business implications of employee enthusiasm.